

ABSTRACT
Background
Epidemiological studies have shown that increased circulating branched-chain amino acids (BCAAs) are associated with insulin resistance and type 2 diabetes (T2D). This may result from altered energy metabolism or dietary habits.
Objective
We hypothesized that a lower intake of BCAAs improves tissue-specific insulin sensitivity.
Methods
This randomized, placebo-controlled, double-blinded, crossover trial examined well-controlled T2D patients receiving isocaloric diets (protein: 1 g/kg body weight) for 4 wk. Protein requirements were covered by commercially available food supplemented ≤60% by an AA mixture either containing all AAs or lacking BCAAs. The dietary intervention ensured sufficient BCAA supply above the recommended minimum daily intake. The patients underwent the mixed meal tolerance test (MMT), hyperinsulinemic-euglycemic clamps (HECs), and skeletal muscle and white adipose tissue biopsies to assess insulin signaling.
Results
After the BCAA− diet, BCAAs were reduced by 17% during fasting (P < 0.001), by 13% during HEC (P < 0.01), and by 62% during the MMT (P < 0.001). Under clamp conditions, whole-body and hepatic insulin sensitivity did not differ between diets. After the BCAA− diet, however, the oral glucose sensitivity index was 24% (P < 0.01) and circulating fibroblast-growth factor 21 was 21% higher (P < 0.05), whereas meal-derived insulin secretion was 28% lower (P < 0.05). Adipose tissue expression of the mechanistic target of rapamycin was 13% lower, whereas the mitochondrial respiratory control ratio was 1.7-fold higher (both P < 0.05). The fecal microbiome was enriched in Bacteroidetes but depleted of Firmicutes.
Conclusions
Short-term dietary reduction of BCAAs decreases postprandial insulin secretion and improves white adipose tissue metabolism and gut microbiome composition. Longer-term studies will be needed to evaluate the safety and metabolic efficacy in diabetes patients.
This trial was registered at clinicaltrials.gov as NCT03261362.
Keywords: branched-chain amino acids, patients with type 2 diabetes, diet, insulin sensitivity, insulin secretion, mitochondrial function, gut microbiome
Introduction
Branched-chain amino acids (BCAAs) account for ∼20% of total protein intake, are important for protein and glucose metabolism, and are associated with insulin resistance in obesity and type 2 diabetes (T2D) (1–3). Their increased plasma concentrations predict impaired insulin signaling (4) and the development of T2D in prospective studies (5–7). Short-term intravenous infusion of amino acids (AAs) not only increases insulin secretion, but also induces insulin resistance in humans, likely due to activation of the mechanistic target of rapamycin (mTOR) complex 1/ribosomal protein S6 kinase (p70S6K) pathway (8–11).
Increased BCAA concentrations result from perturbed proteolysis in skeletal muscle (12), adipose tissue (13), and liver (14). Because insulin inhibits protein breakdown, insulin resistance may therefore also contribute to higher fasting BCAAs (15, 16). Finally, the microbiota can also alter protein degradation and circulating BCAA concentrations (17). Animal models of obesity exhibit less intestinal Bacteroidetes and correspondingly more Firmicutes (18). However, data on the impact of dietary BCAA modification on gut microbiome composition in humans are lacking.
Overnutrition could also affect circulating BCAA concentrations. Whereas diets enriched in either plant or animal protein rather increased peripheral insulin sensitivity (19), dietary supplementation with essential AAs decreased glucose infusion rates necessary during euglycemic clamp studies at different degrees of insulinemia (20). Interestingly, ingestion of BCAA-enriched whey protein increased postprandial insulinemia without reduction of glycemia, suggesting decreased insulin sensitivity (21). Moreover, acute whey protein supplementation improved postprandial glycemia in lean, overweight and obese, and T2D patients (22).
These findings raise the question of whether dietary reduction of BCAAs would improve insulin sensitivity. In humans, 1 previous study on dietary protein reduction showed lower serum BCAAs (23), but did not report metabolic effects. In mice, the dietary omission of leucine indeed improved glycemic control (11).
Thus, this study tested the hypothesis that a reduction of dietary BCAAs increases whole-body insulin sensitivity. To this end, we examined the effects of a controlled isocaloric dietary reduction in BCAAs (BCAA−) on insulin sensitivity and secretion in patients with T2D using the 2-step hyperinsulinemic-euglycemic clamp (HEC) test with stable isotope dilution and the mixed meal tolerance test (MMT). On a cellular level, we assessed insulin signaling pathways and mitochondrial function in skeletal muscle and white adipose tissue (WAT), as well as intestinal microbiome composition. The primary outcome of this study was whole-body insulin sensitivity in response to the HEC, whereas the secondary outcome measures were insulin secretion, insulin signaling, and microbiome composition.
Methods
Patients
All participants (n = 12) gave written informed consent before inclusion in the study (NCT03261362), consistent with the Declaration of Helsinki and approved by the local ethics board of Heinrich Heine University, Düsseldorf, Germany. Inclusion criteria comprised 40–60 y of age; BMI 28–35 kg/m2; T2D treated with lifestyle modification, metformin, or other oral glucose-lowering medication; and known disease duration of ≤5 y. Exclusion criteria were smoking; acute or chronic diseases including cancer; medications affecting the immune system; antibiotics; regular endurance training >1 h/wk; insulin; thiazolidinediones; glycated hemoglobin > 9.5% (80 mmol/mol); and a diabetes type other than T2D.
Study design
In a crossover double-blinded design, all participants, recruited between May 2016 and June 2017, were randomly allocated to a dietary intervention beginning either with the complete set of AAs (BCAA+) or with a BCAA-reduced diet (BCAA−) (Supplemental Figure 1). For this task, a reproducible code from the program package in SAS version 9.3 (SAS Institute Inc.) was used. The given number of analyzed participants allows detecting large effect sizes (Cohen's d = 1) of measures of whole-body insulin sensitivity with a power ≥80% (24) and an α error rate <5%.
At all visits, the study participants arrived at the Clinical Research Center (CRC) in the morning after 10 h of overnight fasting (Supplemental Figure 2). They were instructed to refrain from any form of exercise for 3 d before the analyses. Patients withdrew their oral glucose-lowering medication for ≥3 d before all measurements to exclude its acute effects on glucose metabolism (25). Patients participated in a 4-wk isocaloric dietary intervention with 55% carbohydrates, 30% fat, and 15% protein uptake. The protein intake was kept constant at 1 g/kg body weight (BW) for the entire period of the study. During weeks 1 and 3, the protein intake was covered by commercially available regular foods, whereas in weeks 2 and 4 ∼60% of the protein intake was covered by an AA-powder either containing all AAs (K-AM, Nutricia Metabolics) or lacking BCAAs (ILV-AM3, Nutricia Metabolics) dissolved in c.200 mL water at room temperature; the rest was covered by commercially available regular foods. Powders were indistinguishably packed and labeled by an external pharmacist to ensure blinding of participants, care providers, and persons involved in the assessment of outcomes. The individual daily calorie intake was calculated using the basal metabolic rate according to the Harris–Benedict formula—for males: basal metabolic rate (in kcal) = 66.5 + (13.8 × BW in kg) + (5.0 × height in cm) − (6.8 × age in y) × physical activity level (PAL) 1.4; and for females: basal metabolic rate (in kcal) = 655.1 + (9.6 × BW in kg) + (1.9 × height in cm) − (4.7 × age in y) × PAL 1.4 (26, 27).
Monitoring of diet and exercise behavior
An experienced dietitian designed detailed individually tailored nutritional protocols and supervised participants’ dietary behavior. Dietary protocols were analyzed using the Prodi system [Prodi 6.3.0.1 (Nbase 3.60), Nutri-Science GmbH]. The participants documented any deviation from these protocols, which were adapted by nutritional advice. The intensive monitoring ensured constant protein and correspondingly average BCAA intake throughout the study period. BW changes had to be <5%. The patients’ compliance was checked from serum AA concentrations, measured in the fasted state at each visit, and from urinary excretion of riboflavin (vitamin B-2), which had been added to the AA powders as a dosage of 300 mg/d. Urine samples were collected thrice—at baseline and at the end of each of the 2 intervention weeks with/without AA supplementation—over 24 h during the intervention to measure the concentration of riboflavin by a fluorimetric assay (28) corrected for individual creatinine concentrations. An exercise physiologist supervised the physical activity behavior of participants. For monitoring, 3-axial acceleration sensors (move II, Movisens GmbH) were attached to the participant's waist above the right anterior axillary line according to the manufacturer's recommendations and worn throughout the intervention. Steps and energy expenditure were calculated with the Movisens DataAnalyzer software (29).
MMT
To assess the acute effects of 1 MMT on top of 1 wk exposure to a modified BCAA intake on insulin secretion, an MMT was performed at the end of each intervention week (weeks 2 and 4). These findings were referred to as “meal-induced.” After 10 h overnight fasting, participants ingested a standardized liquid meal (Duocal, Nutricia Metabolics), either containing the complete set of AAs or being BCAA-free, within 2 min starting at zero time. The meal size was adapted to the patients’ individual energy requirements and corresponded to 25% of their estimated daily energy requirement (30). Blood samples were taken at minutes −10, −1, +10, +20, +30, +60, +90, +120, +180, and +240 for measurements of glucose, insulin, C-peptide, free fatty acids (FFAs), and triglycerides (TGs) to calculate incremental AUCs (iAUCs), using the trapezoidal rule after subtracting the basal (fasting) values (31). The oral glucose sensitivity index (OGIS) was calculated from the MMT as described previously (32). The PREDIcted M (PREDIM) index was computed from the OGIS and MMT data and allows for nominal comparison with the HEC-derived M value as described previously (33).
Tissue biopsies
The biopsies were obtained at the end of each intervention period at the end of the MMT. For skeletal muscle biopsies, the region above the vastus lateralis muscle was anaesthetized by subcutaneous injection of 15 mL 2% lidocaine. Thereafter, ∼70–200 mg tissue was obtained using a modified Bergström needle with suction as described (8). Adipose tissue biopsies were obtained in the paraumbilical region at the level of the rectus abdominis muscle as described (34).
High-resolution respirometry
Ex vivo analysis of mitochondrial oxidative capacity was performed on permeabilized muscle fibers and isolated mitochondria in a 2-chamber oxygraph (Oroboros Instruments) as described previously (21). Maximal fatty acid oxidative capacity (state 3) was measured using either octanoyl-carnitine (50 µmol/L) and ADP (1 mmol/L) to assess β-oxidation–linked respiration, or pyruvate (10 mmol/L), glutamate (10 mmol/L), ADP (1 mmol/L), and succinate (10 mmol/L) to assess tricarboxylic acid cycle–linked respiration. Cytochrome C (10 µmol/L) was added to test the integrity of the outer mitochondrial membrane. Respiration due to proton leak and not coupled to ATP synthesis (state 4o) was measured after addition of oligomycin. Finally, the maximal uncoupled respiration capacity of the electron transport chain (state u) was assessed by incremental titration with carbonyl cyanide p-[trifluoromethoxyl]-phenyl-hydrozone (fccp) (0.1 mmol/L per step) and nonmitochondrial respiration by adding 2.5 µM antimycin A. The respiratory control ratio (RCR) and the leak control ratio (LCR), markers of mitochondrial coupling and efficiency, respectively, were calculated as the ratios of state 3:state 4o and state 4o:state u respiration, respectively. A high RCR and low LCR indicate tight coupling and high efficiency of mitochondrial function. Oxygen consumption was normalized to adipose tissue wet weight or to mitochondrial density assessed from a citrate synthase activity assay (35).
Two-step HEC test
Patients arrived at the CRC at 0650 on the day of the clamp test. A primed-continuous infusion {3.6 mg/kg [(free plasma glucose in mg/dL)/90]} of D-[6,6-2H2] glucose (99% enriched, Cambridge Isotope Laboratories) was started at 0700. At 0855, the somatostatin infusion (0.1 μg · kg BW−1 · min−1) was commenced, simultaneously with infusion of 20 mU · min−1 · m−2 (low-dose for 2 h, low clamp), followed by 40 mU · min−1 · m−2 (high-dose for 2 h, high clamp) of short-acting human insulin (Insuman Rapid, Sanofi-Aventis) (36). Plasma glucose was measured every 5 min and kept constant by a variable intravenous glucose infusion (20% glucose, enriched in D-[6,6-2H2] glucose). Insulin-stimulated whole-body glucose disposal (M value: expressed as mg · kg BW−1 · min−1) was calculated as described (37). M/I was calculated as the HEC-derived M value adjusted for the prevailing insulin concentrations during steady-state conditions. For measuring endogenous glucose production (EGP), participants received a 20-min priming bolus [0.36 mg · kg BW−1 · min−1 · fasting plasma glucose (mg/dL)] of D-[6,6-2H2] glucose (99% enriched in 2H glucose; Cambridge Isotope Laboratories) at −240 min, followed by a continuous infusion (0.036 mg · kg BW−1 · min−1) (25).
Laboratory analyses
For analysis of AA concentrations, serum samples were processed using the Phenomenex EZ:faast AA analysis kit (Phenomenex) for GC-MS with norvalin and an isotopically labeled AA mixture (Cambridge Isotope Laboratories) as internal standards (38, 39). AAs were analyzed on a Hewlett Packard 6890 gas chromatograph interfaced to a Hewlett Packard 5975 mass selective detector (Agilent Technologies). For the analysis of arginine, serum samples were treated with arginase (Creative Enzymes) for 20 min at 37°C to convert arginine to ornithine. Ornithine was then quantified after sample processing as described above. Arginine concentration was calculated as the difference of ornithine concentrations before and after arginase treatment. The CVs for individual AAs ranged from 1.4% to 5.1%.
Total LDL cholesterol, HDL cholesterol, TGs, and FFAs as well as transaminases were measured on a Cobas c311 analyzer (Roche Diagnostics) (25). Plasma fibroblast growth factor 21 (FGF21) concentrations were measured with the Human FGF21 Quantikine ELISA [R&D Systems (Bio-techne)] as described previously (40).
Fecal microbiome composition
Stool samples were collected by the participants on the last day of each intervention week and stored at −80°C. Total genomic DNA was extracted from 120 mg fecal material using the QIAcube with QIAamp DNA mini kit (Qiagen) according to the manufacturer's instructions (41). Next-generation sequencing was performed as described previously (42).
Western blot
Proteins were extracted from ∼30 mg frozen tissue (skeletal muscle or WAT) and homogenized in 300 µL lysis buffer (25 mM Tris-HCl), 1 mM EDTA, 150 mM NaCl, and 0.20% NP-40 with protease (cOmplete Tablets, EASYpack, Roche Diagnostics) and phosphatase (PhosSTOP, EASYpack, Roche Diagnostics) inhibitors. Samples were shaken 3 times for 1 min at 20 Hz in a Tissue Lyzer and centrifuged (16,000 ×g for 15 min at 4°C) to pellet insolubilized material, such as DNA, nuclei, and unbroken cellular membranes. The concentration of the extracted proteins was determined in the supernatant using the Bradford Assay (Quick Start Bradford, Biorad) (43). Aliquots of 30 µg total proteins were diluted 6 times with the loading buffer [0.35 M Tris-HCl at pH of 6.8, 10% sodium dodecyl sulfate (SDS), 30% glycerol, 0.6 M dithiothreitol, 0.175 mM Bromophenol Blue] and then loaded onto an SDS-polyacrylamide gradient gel (4–20% Mini-PROTEAN TGX Precast Protein Gels, Biorad). After electrophoresis, a semidry blotting to a polyvinylidene difluoride membrane was performed at 8 mA/cm2 for 1 h. After blocking the membranes for 2 h at room temperature using the blocking solution (5% milk in Tris-buffered saline-Tween), the membranes were incubated with the primary antibodies diluted in blocking solution in combination with the respective horseradish peroxidase (HRP)-conjugated secondary antibodies: anti-rabbit 1:2500 for all the primary antibodies. The membranes were finally coated with Immobilon Western Chemiluminescent HRP Substrate (Millipore) and the proteins were detected using a Bio-Rad ChemiDoc MP Imaging System in combination with the software ImageLab 6.0.1 (Bio Rad Laboratories) for densitometric analysis.
Primary antibodies were all purchased from Cell Signaling Technology: phospho-AKT (Thr308) (9275) [pAKT (Thr308)]; phospho-AKT (Ser473) (9271) [pAKT (Ser473)]; phospho-p70S6K (Thr389) (70-kDa p70S6K) (9205) [p-p70S6K (Thr389)]; phosphor-p70S6K (Thr421/Ser424) (70-kDa p70S6K) (9204) [p-p70S6K (Thr421/Ser424)]; phospho-mTOR (Ser2481) (2974) [pmTOR (Ser2481)]; and GAPDH (2118) as the housekeeping protein. Data are expressed in arbitrary units and normalized to the housekeeping protein.
Statistical analyses
Data are presented as means ± SDs or percentages. Because time sequence effects may cause systematic variations in the outcomes of crossover studies, differences between treatment effects were tested using the classical crossover test, which compares the intraindividual period differences of the outcome between the sequence groups (24). Variables with skewed distributions were ln-transformed before analyses to approximate normality. P values <5% were considered statistically significant effects. All statistical analyses were performed using SAS version 9.4 (SAS Institute).
Results
Patients’ characteristics
All patients had near-normal glycemic control (Table 1) under treatment with lifestyle modification (n = 6) or metformin (n = 6). BW decreased similarly, by 1.7 ± 1.1 kg in the group which first received the BCAA+ diet and by 1.2 ± 0.8 kg in the group which first received the BCAA− diet, at the end of the whole intervention period relative to BW at baseline. The change in BW relative to baseline after the dietary intervention was <2% (both P < 0.05) in both groups and not different between the groups. Total energy expenditure (2621 ± 516 kcal/d under BCAA+ compared with 2576 ± 483 kcal/d under BCAA−) and steps (6340 ± 3897/d under BCAA+ compared with 5646 ± 2811/d under BCAA−) were similar in all participants during both diets (both P > 0.05).
TABLE 1.
Study participants’ anthropometric and metabolic characteristics1
| Variables | Values |
|---|---|
| n (men/women) | 12 (8/4) |
| Age, y | 54 ± 4 |
| BMI, kg/m2 | 30.8 ± 2.8 |
| HbA1c, mmol/mol | 49 ± 10 |
| HbA1c, % | 6.6 ± 0.9 |
| Fasting blood glucose, mg/dL | 118 ± 8 |
| Triglycerides, mg/dL | 273 ± 245 |
| Total cholesterol, mg/dL | 224 ± 135 |
| LDL cholesterol, mg/dL | 145 ± 32 |
| HDL cholesterol, mg/dL | 45 ± 11 |
| ALT, U/I | 38 ± 14 |
| AST, U/I | 28 ± 6 |
| GGT, U/I | 48 ± 8 |
| Total BCAAs, µmol/L | 531 ± 98 |
| Isoleucine, µmol/L | 87 ± 25 |
| Leucine, µmol/L | 159 ± 35 |
| Valine, µmol/L | 285 ± 41 |
Values are mean ± SD unless otherwise indicated. ALT, alanine aminotransferase; AST, aspartate aminotransferase; BCAA, branched-chain amino acid; GGT, γ-glutamyltransferase; HbA1c, glycated hemoglobin.
Fasting BCAA concentrations and diet adherence during the intervention
The 60% reduction of dietary BCAA intake (BCAA−) resulted in a 17% decrease of total circulating BCAA concentrations from 507 ± 90 to 422 ± 56 µmol/L (P < 0.001) under fasting conditions. Serum concentrations of valine, leucine, and isoleucine decreased by 22% from 276 ± 50 to 214 ± 28 µmol/L (P < 0.001), 11% from 155 ± 28 to 139 ± 19 µmol/L (P < 0.05), and 9% from 76 ± 14 to 69 ± 12 µmol/L (P < 0.05), respectively, whereas those of non-BCAAs increased by 10% from 2706 ± 217 to 2982 ± 163 µmol/L (P < 0.01) (Supplemental Table 1). At the end of weeks 1 and 3, when participants did not receive AA mixtures, serum concentrations of all BCAAs, non-BCAAs, and total AAs were comparable.
Adherence to diets was demonstrated by a 33.4-fold increase of urinary concentration of riboflavin after the BCAA+ diet (from 1.3 ± 1.2 to 43.4 ± 15.8 mg/24 h) and a 48.8-fold increase after the BCAA− diet (from 1.3 ± 1.2 to 62.1 ± 31.2 mg/24 h) (both P < 0.05). There were no differences in urinary concentrations of riboflavin between the 2 diets (P > 0.05).
Meal-induced effects of BCAA reduction during the MMT
During the MMT, serum BCAAs decreased by 62% from 158,484 ± 24,410 µmol · L−1 · 4 h−1 after BCAA+ to 61,864 ± 9386 µmol · L−1 · 4 h−1 (P < 0.001) after BCAA− diet (Figure 1A, B). Serum valine, leucine, and isoleucine were reduced by 54% from 75,689 ± 11,562 to 35,195 ± 5138 µmol · L−1 · 4 h−1 (P < 0.001), 71% from 48,848 ± 7938 to 14,931 ± 2610 µmol · L−1 · 4 h−1 (P < 0.001), and 71% from 26,229 ± 4229 to 7699 ± 1524 µmol · L−1 · 4 h−1 (P < 0.001), respectively. Blood glucose concentrations were similar after both dietary interventions (Figure 1C, D). Furthermore, there were no changes in maximal concentrations of blood glucose during the MMT. Incremental insulin release (iAUC) was lower after 1 wk of BCAA− compared with BCAA+ diet (21 ± 11 compared with 29 ± 19 mU · mL−1 · 4 h−1, P < 0.05) (Figure 1E, F). In parallel, incremental C-peptide release was lower after BCAA− diet (2.5 ± 0.8 compared with 2.8 ± 0.9 µg · mL−1 · 4 h−1, P < 0.05) (Figure 1G, H). Accordingly, incremental release of insulin and C-peptide was reduced by 28% and 11%, respectively (both P < 0.05). The time course of serum FFA concentrations was similar after both diets (Figure 1I, J).
FIGURE 1.
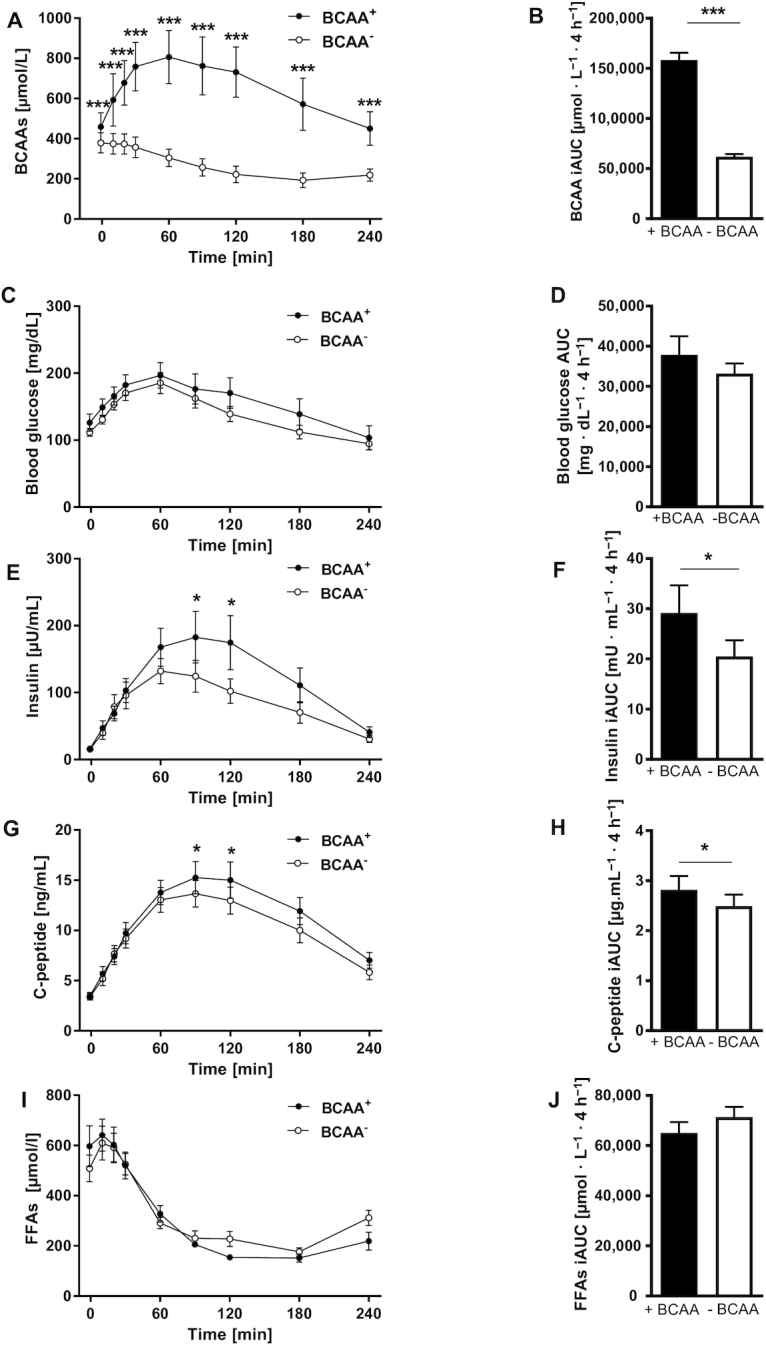
Insulin secretion assessed by mixed meal tolerance test. (A) Concentrations of BCAAs, (B) iAUC for BCAAs, (C) blood glucose, (D) AUC for blood glucose, (E) insulin, (F) iAUC for insulin, (G) C-peptide, (H) iAUC for C-peptide, (I) FFAs, and (J) iAUC for FFAs at the end of each intervention week. Differences between treatment effects were tested using the classical crossover test, which compares the intraindividual period differences of the outcome between the sequence groups. Values are mean ± SEM. *P < 0.05, ***P < 0.01 compared to the corresponding BCAA− values, n = 12. BCAA, branched-chain amino acid; FFA, free fatty acid; iAUC, incremental AUC.
Assessment of postprandial insulin sensitivity during the MMT revealed that under conditions of reduced BCAA concentrations, OGIS was 24% higher (increased from 279 ± 94 mL · min−1 · m−2 after BCAA+ to 346 ± 91 mL · min−1 · m−2 after BCAA−, P < 0.01) (Figure 2A) and PREDIM was 27% higher (increased from 2.6 ± 0.9 mg · kg−1 · min−1 after BCAA+ to 3.3 ± 1.3 mg · kg−1 · min−1 after BCAA−, P < 0.01) (Figure 2B).
FIGURE 2.
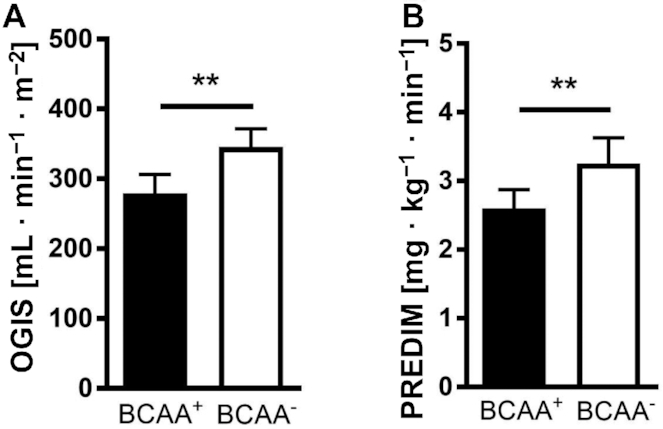
OGIS (A) and PREDIM (B) at the end of both interventions. Differences between treatment effects were tested using the classical crossover test, which compares the intraindividual period differences of the outcome between the sequence groups. Values are mean ± SEM. **P < 0.01, n = 12. BCAA, branched-chain amino acid; OGIS, oral glucose sensitivity index; PREDIM, PREDIcted M.
Changes in HEC during 2–4 wk of BCAA reduction
During the HEC steady state, circulating BCAA concentrations were only 13% lower after the BCAA− (307 ± 57 µmol/L) than after the BCAA+ diet (352 ± 85 µmol/L) (P < 0.01); specifically, valine concentrations were reduced by 15% from 206 ± 48 to 175 ± 35 µmol/L (P < 0.001), leucine concentrations were reduced by 8% from 101 ± 25 to 93 ± 18 µmol/L (P < 0.05), and isoleucine concentrations were reduced by 14% from 44 ± 13 to 38 ± 9 µmol/L (P < 0.05).
Whole-body (M/I), hepatic (insulin-mediated EGP suppression), and adipose-tissue insulin sensitivity (insulin-mediated FFA suppression) remained unchanged after 1 wk of the BCAA− or BCAA+ diet (Table 2).
TABLE 2.
Results from whole-body insulin sensitivity testing by 2-step HEC test1
| Low clamp | High clamp | ∆L vs. ∆H2 | |||||
|---|---|---|---|---|---|---|---|
| BCAA+ | BCAA− | P value | BCAA+ | BCAA− | P value | P value | |
| BCAAs, µmol/L | n.d. | n.d. | — | 346.6 ± 80.2 | 312.1 ± 67.3 | <0.001 | — |
| Glucose, mg/dL | 91.9 ± 2.2 | 91.6 ± 2.3 | 0.78 | 90.7 ± 1.8 | 91.4 ± 2.4 | 0.41 | 0.17 |
| Insulin, µU/mL | 25.5 ± 5.9 | 26.3 ± 7.0 | 0.43 | 54.2 ± 10.4* | 52.2 ± 11.4# | 0.46 | 0.31 |
| M/I | 0.04 ± 0.03 | 0.04 ± 0.03 | 0.98 | 0.07 ± 0.04* | 0.06 ± 0.04# | 0.21 | 0.17 |
| EGP suppression, % | 29.2 ± 16.6 | 49.4 ± 10.6 | 0.97 | 83.1 ± 18.0* | 86.8 ± 11.4# | 0.36 | 0.17 |
| FFA suppression, % | 65.7 ± 19.5 | 64.6 ± 14.8 | 0.84 | 85.1 ± 11.0* | 86.6 ± 6.2# | 0.66 | 0.07 |
Values are mean ± SD, n = 12. All parameters were measured during the HEC steady state. *P < 0.05 between variables derived after BCAA+ intervention under low and high clamp conditions; #P < 0.05 between variables derived after BCAA− intervention under low and high clamp conditions. BCAA, branched-chain amino acid; EGP, endogenous glucose production; FFA, free fatty acid; HEC, hyperinsulinemic-euglycemic clamp; M/I, HEC-derived M value adjusted for prevalent insulin concentrations during steady state; n.d., not done; ∆H, changes of parameters during high clamp; ∆L, changes of parameters during low clamp.
P values of comparisons between ∆L and ∆H.
The BCAA− diet increased fasting FGF21 concentrations in serum by 21% (from 323 ± 55 to 405 ± 68 pg/mL, P < 0.05) relative to the BCAA+ diet.
Insulin signaling and mitochondrial function in skeletal muscle and WAT
At 240 min of the MMT, Ser473- and Thr308-phosphorylation of AKT as well as phosphorylation of mTOR p70S6K in skeletal muscle were not different between the 2 dietary interventions (data not shown). Also, skeletal muscle oxidative capacity was similar after both diets (data not shown).
On the other hand, adipose tissue pAKT (Ser473) and pAKT (Thr308) decreased by 61% (P < 0.05) and 64% (P < 0.01), respectively, after BCAA− (Figure 3A, B). Also, pmTOR (Ser2481) decreased by 38% (P < 0.05) (Figure 3C). The BCAA− diet resulted in increased RCR by 67% (Figure 3D) and unchanged LCR (data not shown), whereas oxidation capacity after exposure to oligomycin, fccp, and antimycin A decreased (Figure 3E).
FIGURE 3.

Insulin signaling and mitochondrial oxidative efficiency/capacity in white adipose tissue biopsy samples. (A) Phosphorylation of protein kinase B (AKT) at serine 473, (B) phosphorylation of AKT at threonine 308, (C) pmTOR at serine 2481, (D) RCR (state 3:state 4o), and (E) β-oxidation–linked respiration in adipose tissue. Differences between treatment effects were tested using the classical crossover test, which compares the intraindividual period differences of the outcome between the sequence groups. Values are mean ± SEM. *P < 0.05, **P < 0.01, n = 12. BCAA, branched-chain amino acid; fccp, carbonyl cyanide p-[trifluoromethoxyl]-phenyl-hydrozone; pmTOR, phosphorylation of mechanistic target of rapamycin; RCR, respiratory control ratio.
Composition of fecal microbiota
Next-generation sequencing revealed an 11% lower abundance of Firmicutes after BCAA− dietary intervention compared with BCAA+, whereas the abundance of Bacteroidetes was 40% higher (both P < 0.05, Figure 4) in stool samples collected at the end of each intervention period.
FIGURE 4.

Alterations in microbiota: abundance of fecal Firmicutes and Bacteroidetes. Values are mean ± SEM. Differences between treatment effects were tested using the classical crossover test, which compares the intraindividual period differences of the outcome between the sequence groups. *P < 0.05, n = 10.
Discussion
A short-term dietary reduction of BCAAs in patients with T2D 1) decreased insulin secretion, 2) increased postprandial insulin sensitivity, 3) stimulated mitochondrial efficiency in adipose tissue, and 4) altered gut microbiome composition in favor of Bacteroidetes.
The acute effects of BCAA reduction during the MMT reflect the endocrine response of the pancreas to the absence of the physiological AA stimulus. Leucine is a prominent allosteric activator of insulin secretion from the pancreatic β-cell (44) and all BCAAs are potent insulin-secretion stimulators (45). Interestingly, the lower insulin secretion did not result in higher blood glucose concentrations during the MMT, suggesting improved insulin sensitivity. Indeed, postprandial insulin sensitivity as calculated from the OGIS and PREDIM, which have been validated and correlate with clamp-derived measures of whole-body insulin sensitivity (33), was >20% higher than after the BCAA+ diet. This improvement could have resulted from increased insulin-mediated glucose disposal, which mainly occurs in skeletal muscle under these conditions (46). Alternatively, EGP could have been decreased under BCAA-depleted conditions owing to lower substrate supply for hepatic gluconeogenesis (47). Improvements in OGIS and PREDIM were registered in insulin-resistant patients in the face of decreased peripheral insulin concentrations. Of note, the lower degree of insulinemia would rather favor glycogenolysis and thereby stimulation of EGP (47). The reduced insulin and C-peptide secretion upon acute stimulation after the BCAA− diet is in line with a previous finding of decreased ex vivo glucose-stimulated insulin secretion in isolated pancreatic islets from mice (48).
Interestingly, insulin-stimulated peripheral glucose disposal was not different between the 2 dietary interventions under HEC conditions, when skeletal muscle is responsible for the majority of glucose disposal (49). Of note, hepatic and adipose tissue insulin sensitivity were also comparable during HEC. Also of note, the experimental setup created conditions of dynamic changes during the MMT compared with constant concentrations of hormones and metabolites during the clamp. This includes different degrees of splanchnic compared with peripheral insulinemia, which markedly affect hepatic glucose turnover (50). Nevertheless, the most obvious explanation for the difference between the MMT and HEC resides in the different degree of BCAA reduction. The 60% decrease in total serum BCAA concentrations during the MMT was associated with higher postprandial insulin sensitivity. In contrast, the minor reduction of circulating BCAA concentrations during HEC did not correlate with insulin sensitivity. Insulin decreases the appearance and increases the uptake of AAs in the periphery (51). Consequently, the reduction of BCAA concentrations during the HEC steady state under hyperinsulinemia was, as expected, lower than during the MMT. It is conceivable that the dietary reduction of BCAAs by 60% does not suffice to improve the insulin resistance of these patients with overt T2D. These data also suggest that the acute effect of BCAA reduction observed during the MMT does not persist during the course of the dietary intervention. Thus, another possible reason for the lack of an effect on insulin sensitivity could be the short intervention period. But even a modulation of BCAA intake for 1 mo failed to affect whole-body insulin sensitivity as assessed from HEC (52). Because BCAAs are essential and are ubiquitously present in regular foods, it was not possible to further reduce their dietary intake. BCAA degradation may also stimulate fatty acid synthesis and induce insulin resistance in skeletal muscle or WAT (53); however, measuring BCAA catabolic products was beyond the scope of this study.
The tissue-specific contributions to improved postprandial insulin sensitivity were examined in biopsies from skeletal muscle and adipose tissue taken at 4 h after the start of the MMT. In skeletal muscle, there were no differences in the phosphorylation of AKT or mTOR/p70S6K. This may be due to the relatively small differences in circulating insulin and BCAA concentrations at the end of the MMT and the transient nature of insulin on its cellular signaling pathways (54). Although skeletal muscle strongly relies on mitochondrial oxidative phosphorylation and decreased oxidative capacity can be a major contributor to the development of insulin resistance (55), there were also no differences in ex vivo mitochondrial function.
Previous studies suggested that adipose tissue can also metabolize substantial amounts of BCAAs (56) and may be a prominent site to store excess BCAAs as lipids (4). Indeed, the reduction of BCAA intake resulted in lower mTOR phosphorylation. Reduced AKT activity in WAT, however, might result from decreased peripheral insulinemia. Meal-induced effects of reduced BCAA intake were also detected in WAT energy metabolism, resulting in higher RCR and lower oxidative capacity. A high RCR in adipose tissue indicates a higher efficiency of mitochondrial function under conditions of BCAA reduction. The difference in RCR can be explained mainly by a difference in the proton leak and, to a certain extent, by altered substrate oxidation (57). Substrates contributing electrons to the ubiquinone pool such as succinyl-CoA under reduced-BCAA conditions possibly alter proton translocation stoichiometry and proton leak compared with predominantly NADH-linked substrates during high-BCAA conditions.
Furthermore, the hepatokine FGF21 could contribute to the interplay between BCAAs and altered adipose tissue energy metabolism. In line with previous findings (23), plasma FGF21 concentrations increased after 1 wk of the BCAA− diet. The insulin-sensitizing hormone FGF21 is considered a metabolic signal of dietary protein restriction (58) and a marker of improvement of metabolic health (48) by enhancing glucose uptake in adipose tissue. Thus, the increase in FGF21 after BCAA reduction may support increased mitochondrial efficiency in adipose tissue. This possibly results in subsequent activation of the FGF21–AMPK (5'-adenosine monophosphate-activated protein kinase) pathway. In line with this, increased FGF21 concentrations after deprivation of the single BCAA leucine have been reported previously (59).
Reduced BCAA intake also affected the gut microbiome, with increased Bacteroidetes and decreased Firmicutes phyla. In contrast, long-term protein-rich diet revealed a correlation with increased abundance of Bacteroidetes (60). In addition, short-term dietary changes have been proven to alter the human gut microbiome (61). The altered composition of gut bacteria at the end of only 1 wk of BCAA-reduced food intake might be the link to decreased insulin secretion. Dietary modifications may affect gut microbiome composition including bacterial species producing SCFAs such as acetate, propionate, and butyrate, which contribute to the regulation of glucose homeostasis (62). Precisely, acetate modulates insulin secretion (63) and increased concentrations of acetate and butyrate have been found in parts of the distal guts of obese mice, which grants the microbiome an independent role in the development of obesity (64). However, gut acetate and butyrate were not measured in this study.
The present study benefits from the supervised dietary intervention, the comparison of meal-induced effects with effects during 2–4 wk treatment, and the comprehensive phenotyping of the patients. On the other hand, this study does not allow us to draw conclusions as to dose–effect relations and chronic effects of dietary BCAA depletion.
In conclusion, short-term dietary reduction of BCAAs acutely decreases meal-induced insulin secretion, and improves postprandial insulin sensitivity and the mitochondrial efficiency of WAT. Dietary BCAA reduction for 1 wk does not affect whole-body insulin sensitivity, but increases circulating FGF21 concentrations and the abundance of intestinal Bacteroidetes.
Supplementary Material
ACKNOWLEDGEMENTS
We thank Silke Tosenovian and Ulrike Partke, at the German Diabetes Center, Düsseldorf, Germany, for their excellent technical help and Professor Frederik Bäckhed, at the Wallenberg Laboratory, Department of Molecular and Clinical Medicine, Institute of Medicine, University of Gothenburg, Gothenburg, Sweden, for supporting the analyses of microbiome composition.
The authors’ responsibilities were as follows—MR and DS: had the idea for this study; MR, YK, JS, M-CS, and VB: designed the research; YK and TK: conducted the research, YK: enrolled participants, assigned participants to interventions, analyzed the data, and wrote the paper; VB, KM, JS, and MR: contributed to the discussion; GP and AT: analyzed the data with mathematical modeling; VB, KM, JS, MR, KB, and O-PZ: reviewed and edited the paper; TJ and LM: collected the data; DP and MW: provided essential materials; DM and FB: performed laboratory analyses; KS: performed statistical analyses and generated the allocation sequence; MR and JS: are the guarantors of this work and, as such, had full access to all the data in the study and take responsibility for the integrity of the data and the accuracy of the data analysis; and all authors: read and approved the final manuscript. DS and FB are employees of Sanofi-Aventis Deutschland, a pharmaceutical company. None of the other authors reported a conflict of interest related to the study.
Notes
Some data were presented as an abstract/poster at the 78th American Diabetes Association, the 79th American Diabetes Association, and the 54th European Association for the Study of Diabetes Annual Meeting in 2018 as well as an oral presentation at the 53rd German Diabetes Association Annual Meeting in 2018 and a poster presentation at the 54th German Diabetes Association Annual Meeting in 2019.
Supported by the Ministry for Culture and Science of the State of North Rhine-Westphalia (MKW NRW) and the German Federal Ministry of Health (BMG); and in part by grants from the Federal Ministry of Education and Research (BMBF) to the German Center for Diabetes Research (DZD e.V.); the German Research Foundation grants DFG, SFB 1116, B05, and B12; the German Diabetes Association (DDG); the Wallenberg Laboratory, Department of Molecular and Clinical Medicine, University of Gothenburg, Sweden; and an unrestricted grant from Sanofi-Aventis, Germany.
Supplemental Figures 1 and 2 and Supplemental Table 1 are available from the “Supplementary data” link in the online posting of the article and from the same link in the online table of contents at https://academic.oup.com/ajcn/.
JS and MR contributed equally to this work.
Abbreviations used: AA, amino acid; BCAA, branched-chain amino acid; BW, body weight; CRC, Clinical Research Center; EGP, endogenous glucose production; fccp, carbonyl cyanide p-[trifluoromethoxyl]-phenyl-hydrozone; FFA, free fatty acid; FGF21, fibroblast-growth factor 21; HEC, hyperinsulinemic-euglycemic clamp; HRP, horseradish peroxidase; iAUC, incremental AUC; LCR, leak control ratio; M/I, HEC-derived M value adjusted for prevalent insulin concentrations during steady state; MMT, mixed meal tolerance test; mTOR, mechanistic target of rapamycin; OGIS, oral glucose sensitivity index; p70S6K, ribosomal protein S6 kinase; PAL, physical activity level; PREDIM, PREDIcted M; RCR, respiratory control ratio; SDS, sodium dodecyl sulfate; TG, triglyceride; T2D, type 2 diabetes; WAT, white adipose tissue.
References
- 1. Lynch CJ, Adams SH. Branched-chain amino acids in metabolic signalling and insulin resistance. Nat Rev Endocrinol. 2014;10(12):723–36. [DOI] [PMC free article] [PubMed] [Google Scholar]
- 2. Newgard CB. Interplay between lipids and branched-chain amino acids in development of insulin resistance. Cell Metab. 2012;15(5):606–14. [DOI] [PMC free article] [PubMed] [Google Scholar]
- 3. Gancheva S, Jelenik T, Alvarez-Hernandez E, Roden M. Interorgan metabolic crosstalk in human insulin resistance. Physiol Rev. 2018;98(3):1371–415. [DOI] [PubMed] [Google Scholar]
- 4. Felig P, Marliss E, Cahill GF Jr. Plasma amino acid levels and insulin secretion in obesity. N Engl J Med. 1969;281(15):811–16. [DOI] [PubMed] [Google Scholar]
- 5. McCormack SE, Shaham O, McCarthy MA, Deik AA, Wang TJ, Gerszten RE, Clish CB, Mootha VK, Grinspoon SK, Fleischman A. Circulating branched-chain amino acid concentrations are associated with obesity and future insulin resistance in children and adolescents. Pediatr Obes. 2013;8(1):52–61. [DOI] [PMC free article] [PubMed] [Google Scholar]
- 6. Wang TJ, Larson MG, Vasan RS, Cheng S, Rhee EP, McCabe E, Lewis GD, Fox CS, Jacques PF, Fernandez C et al.. Metabolite profiles and the risk of developing diabetes. Nat Med. 2011;17(4):448–53. [DOI] [PMC free article] [PubMed] [Google Scholar]
- 7. Yamakado M, Nagao K, Imaizumi A, Tani M, Toda A, Tanaka T, Jinzu H, Miyano H, Yamamoto H, Daimon T et al.. Plasma free amino acid profiles predict four-year risk of developing diabetes, metabolic syndrome, dyslipidemia, and hypertension in Japanese population. Sci Rep. 2015;5:11918. [DOI] [PMC free article] [PubMed] [Google Scholar]
- 8. Tremblay F, Krebs M, Dombrowski L, Brehm A, Bernroider E, Roth E, Nowotny P, Waldhausl W, Marette A, Roden M. Overactivation of S6 kinase 1 as a cause of human insulin resistance during increased amino acid availability. Diabetes. 2005;54(9):2674–84. [DOI] [PubMed] [Google Scholar]
- 9. Bischof MG, Bernroider E, Krssak M, Krebs M, Stingl H, Nowotny P, Yu C, Shulman GI, Waldhausl W, Roden M. Hepatic glycogen metabolism in type 1 diabetes after long-term near normoglycemia. Diabetes. 2002;51(1):49–54. [DOI] [PubMed] [Google Scholar]
- 10. Newgard CB, An J, Bain JR, Muehlbauer MJ, Stevens RD, Lien LF, Haqq AM, Shah SH, Arlotto M, Slentz CA et al.. A branched-chain amino acid-related metabolic signature that differentiates obese and lean humans and contributes to insulin resistance. Cell Metab. 2009;9(4):311–26. [DOI] [PMC free article] [PubMed] [Google Scholar]
- 11. Xiao F, Yu J, Guo Y, Deng J, Li K, Du Y, Chen S, Zhu J, Sheng H, Guo F. Effects of individual branched-chain amino acids deprivation on insulin sensitivity and glucose metabolism in mice. Metabolism. 2014;63(6):841–50. [DOI] [PubMed] [Google Scholar]
- 12. Lerin C, Goldfine AB, Boes T, Liu M, Kasif S, Dreyfuss JM, De Sousa-Coelho AL, Daher G, Manoli I, Sysol JR et al.. Defects in muscle branched-chain amino acid oxidation contribute to impaired lipid metabolism. Mol Metab. 2016;5(10):926–36. [DOI] [PMC free article] [PubMed] [Google Scholar]
- 13. Cheng S, Wiklund P, Autio R, Borra R, Ojanen X, Xu L, Tormakangas T, Alen M. Adipose tissue dysfunction and altered systemic amino acid metabolism are associated with non-alcoholic fatty liver disease. PLoS One. 2015;10(10):e0138889. [DOI] [PMC free article] [PubMed] [Google Scholar]
- 14. Lake AD, Novak P, Shipkova P, Aranibar N, Robertson DG, Reily MD, Lehman-McKeeman LD, Vaillancourt RR, Cherrington NJ. Branched chain amino acid metabolism profiles in progressive human nonalcoholic fatty liver disease. Amino Acids. 2015;47(3):603–15. [DOI] [PMC free article] [PubMed] [Google Scholar]
- 15. She P, Olson KC, Kadota Y, Inukai A, Shimomura Y, Hoppel CL, Adams SH, Kawamata Y, Matsumoto H, Sakai R et al.. Leucine and protein metabolism in obese Zucker rats. PLoS One. 2013;8(3):e59443. [DOI] [PMC free article] [PubMed] [Google Scholar]
- 16. Mahendran Y, Jonsson A, Have CT, Allin KH, Witte DR, Jorgensen ME, Grarup N, Pedersen O, Kilpelainen TO, Hansen T. Genetic evidence of a causal effect of insulin resistance on branched-chain amino acid levels. Diabetologia. 2017;60(5):873–8. [DOI] [PubMed] [Google Scholar]
- 17. Saad MJ, Santos A, Prada PO. Linking gut microbiota and inflammation to obesity and insulin resistance. Physiology (Bethesda). 2016;31(4):283–93. [DOI] [PubMed] [Google Scholar]
- 18. Ley RE, Turnbaugh PJ, Klein S, Gordon JI. Microbial ecology: human gut microbes associated with obesity. Nature. 2006;444(7122):1022–3. [DOI] [PubMed] [Google Scholar]
- 19. Markova M, Pivovarova O, Hornemann S, Sucher S, Frahnow T, Wegner K, Machann J, Petzke KJ, Hierholzer J, Lichtinghagen R et al.. Isocaloric diets high in animal or plant protein reduce liver fat and inflammation in individuals with type 2 diabetes. Gastroenterology. 2017;152(3):571–85..e8. [DOI] [PubMed] [Google Scholar]
- 20. Robinson MM, Soop M, Sohn TS, Morse DM, Schimke JM, Klaus KA, Nair KS. High insulin combined with essential amino acids stimulates skeletal muscle mitochondrial protein synthesis while decreasing insulin sensitivity in healthy humans. J Clin Endocrinol Metab. 2014;99(12):E2574–83. [DOI] [PMC free article] [PubMed] [Google Scholar]
- 21. Smith GI, Yoshino J, Stromsdorfer KL, Klein SJ, Magkos F, Reeds DN, Klein S, Mittendorfer B. Protein ingestion induces muscle insulin resistance independent of leucine-mediated mTOR activation. Diabetes. 2015;64(5):1555–63. [DOI] [PMC free article] [PubMed] [Google Scholar]
- 22. Stevenson EJ, Allerton DM. The role of whey protein in postprandial glycaemic control. Proc Nutr Soc. 2018;77(1):42–51. [DOI] [PubMed] [Google Scholar]
- 23. Maida A, Chan JSK, Sjoberg KA, Zota A, Schmoll D, Kiens B, Herzig S, Rose AJ. Repletion of branched chain amino acids reverses mTORC1 signaling but not improved metabolism during dietary protein dilution. Mol Metab. 2017;6(8):873–81. [DOI] [PMC free article] [PubMed] [Google Scholar]
- 24. Wellek S, Blettner M. On the proper use of the crossover design in clinical trials: part 18 of a series on evaluation of scientific publications. Dtsch Arztebl Int. 2012;109(15):276–81. [DOI] [PMC free article] [PubMed] [Google Scholar]
- 25. Szendroedi J, Saxena A, Weber KS, Strassburger K, Herder C, Burkart V, Nowotny B, Icks A, Kuss O, Ziegler D et al.. Cohort profile: the German Diabetes Study (GDS). Cardiovasc Diabetol. 2016;15:59. [DOI] [PMC free article] [PubMed] [Google Scholar]
- 26. Baecke JA, Burema J, Frijters JE. A short questionnaire for the measurement of habitual physical activity in epidemiological studies. Am J Clin Nutr. 1982;36(5):936–42. [DOI] [PubMed] [Google Scholar]
- 27. Harris JA, Benedict FG. A biometric study of human basal metabolism. PNAS. 1918;4(12):370–3. [DOI] [PMC free article] [PubMed] [Google Scholar]
- 28. Ramanujam VM, Anderson KE, Grady JJ, Nayeem F, Lu LJ. Riboflavin as an oral tracer for monitoring compliance in clinical research. Open Biomark J. 2011;2011(4):1–7. [DOI] [PMC free article] [PubMed] [Google Scholar]
- 29. Anastasopoulou P, Tubic M, Schmidt S, Neumann R, Woll A, Hartel S. Validation and comparison of two methods to assess human energy expenditure during free-living activities. PLoS One. 2014;9(2):e90606. [DOI] [PMC free article] [PubMed] [Google Scholar]
- 30. Clayton DJ, Stensel DJ, James LJ. Effect of breakfast omission on subjective appetite, metabolism, acylated ghrelin and GLP-17-36 during rest and exercise. Nutrition. 2016;32(2):179–85. [DOI] [PubMed] [Google Scholar]
- 31. Weber KS, Strassburger K, Fritsch M, Bierwagen A, Koliaki C, Phielix E, Pacini G, Hwang JH, Markgraf DF, Burkart V et al.. Meal-derived glucagon responses are related to lower hepatic phosphate concentrations in obesity and type 2 diabetes. Diabetes Metab. 2018;44(5):444–8. [DOI] [PubMed] [Google Scholar]
- 32. Mari A, Pacini G, Murphy E, Ludvik B, Nolan JJ. A model-based method for assessing insulin sensitivity from the oral glucose tolerance test. Diabetes Care. 2001;24(3):539–48. [DOI] [PubMed] [Google Scholar]
- 33. Tura A, Chemello G, Szendroedi J, Gobl C, Faerch K, Vrbikova J, Pacini G, Ferrannini E, Roden M. Prediction of clamp-derived insulin sensitivity from the oral glucose insulin sensitivity index. Diabetologia. 2018;61(5):1135–41. [DOI] [PubMed] [Google Scholar]
- 34. Nowotny B, Zahiragic L, Krog D, Nowotny PJ, Herder C, Carstensen M, Yoshimura T, Szendroedi J, Phielix E, Schadewaldt P et al.. Mechanisms underlying the onset of oral lipid-induced skeletal muscle insulin resistance in humans. Diabetes. 2013;62(7):2240–8. [DOI] [PMC free article] [PubMed] [Google Scholar]
- 35. Koliaki C, Szendroedi J, Kaul K, Jelenik T, Nowotny P, Jankowiak F, Herder C, Carstensen M, Krausch M, Knoefel WT et al.. Adaptation of hepatic mitochondrial function in humans with non-alcoholic fatty liver is lost in steatohepatitis. Cell Metab. 2015;21(5):739–46. [DOI] [PubMed] [Google Scholar]
- 36. Szendroedi J, Yoshimura T, Phielix E, Koliaki C, Marcucci M, Zhang D, Jelenik T, Muller J, Herder C, Nowotny P et al.. Role of diacylglycerol activation of PKCθ in lipid-induced muscle insulin resistance in humans. PNAS. 2014;111(26):9597–602. [DOI] [PMC free article] [PubMed] [Google Scholar]
- 37. Rohling M, Strom A, Bonhof G, Puttgen S, Bodis K, Mussig K, Szendrödi J, Markgraf D, Lehr S, Roden M et al.. Differential patterns of impaired cardiorespiratory fitness and cardiac autonomic dysfunction in recently diagnosed type 1 and type 2 diabetes. Diabetes Care. 2017;40(2):246–52. [DOI] [PubMed] [Google Scholar]
- 38. Badawy AA, Morgan CJ, Turner JA. Application of the Phenomenex EZ:faast™ amino acid analysis kit for rapid gas-chromatographic determination of concentrations of plasma tryptophan and its brain uptake competitors. Amino Acids. 2008;34(4):587–96. [DOI] [PMC free article] [PubMed] [Google Scholar]
- 39. Matsumura S, Kataoka H, Makita M. Capillary gas chromatographic analysis of protein amino acids as their N(O,S)-isobutoxycarbonyl methyl ester derivatives. Biomed Chromatogr. 1995;9(5):205–10. [DOI] [PubMed] [Google Scholar]
- 40. Jimenez V, Jambrina C, Casana E, Sacristan V, Munoz S, Darriba S, Rodo J, Mallol C, Garcia M, Leon X et al.. FGF21 gene therapy as treatment for obesity and insulin resistance. EMBO Mol Med. 2018;10(8):e8791. [DOI] [PMC free article] [PubMed] [Google Scholar]
- 41. Mobini R, Tremaroli V, Stahlman M, Karlsson F, Levin M, Ljungberg M, Sohlin M, Berteus Forslund H, Perkins R, Backhed F et al.. Metabolic effects of Lactobacillus reuteri DSM 17938 in people with type 2 diabetes: a randomized controlled trial. Diabetes Obes Metab. 2017;19(4):579–89. [DOI] [PubMed] [Google Scholar]
- 42. Karlsson F, Tremaroli V, Nielsen J, Backhed F. Assessing the human gut microbiota in metabolic diseases. Diabetes. 2013;62(10):3341–9. [DOI] [PMC free article] [PubMed] [Google Scholar]
- 43. Jelenik T, Flogel U, Alvarez-Hernandez E, Scheiber D, Zweck E, Ding Z, Rothe M, Mastrototaro L, Kohlhaas V, Kotzka J et al.. Insulin resistance and vulnerability to cardiac ischemia. Diabetes. 2018;67(12):2695–702. [DOI] [PMC free article] [PubMed] [Google Scholar]
- 44. Yang J, Chi Y, Burkhardt BR, Guan Y, Wolf BA. Leucine metabolism in regulation of insulin secretion from pancreatic beta cells. Nutr Rev. 2010;68(5):270–9. [DOI] [PMC free article] [PubMed] [Google Scholar]
- 45. Nair KS, Short KR. Hormonal and signaling role of branched-chain amino acids. J Nutr. 2005;135(6 Suppl):1547s–52s. [DOI] [PubMed] [Google Scholar]
- 46. Morrison DJ, Kowalski GM, Grespan E, Mari A, Bruce CR, Wadley GD. Measurement of postprandial glucose fluxes in response to acute and chronic endurance exercise in healthy humans. Am J Physiol Endocrinol Metab. 2018;314(5):E503–E11. [DOI] [PubMed] [Google Scholar]
- 47. Krebs M, Brehm A, Krssak M, Anderwald C, Bernroider E, Nowotny P, Roth E, Chandramouli V, Landau BR, Waldhausl W et al.. Direct and indirect effects of amino acids on hepatic glucose metabolism in humans. Diabetologia. 2003;46(7):917–25. [DOI] [PubMed] [Google Scholar]
- 48. Fontana L, Cummings NE, Arriola Apelo SI, Neuman JC, Kasza I, Schmidt BA, Cava E, Spelta F, Tosti V, Syed FA et al.. Decreased consumption of branched-chain amino acids improves metabolic health. Cell Rep. 2016;16(2):520–30. [DOI] [PMC free article] [PubMed] [Google Scholar]
- 49. DeFronzo RA, Ferrannini E, Hendler R, Wahren J, Felig P. Influence of hyperinsulinemia, hyperglycemia, and the route of glucose administration on splanchnic glucose exchange. Proc Natl Acad Sci U S A. 1978;75(10):5173–7. [DOI] [PMC free article] [PubMed] [Google Scholar]
- 50. Roden M, Price TB, Perseghin G, Petersen KF, Rothman DL, Cline GW, Shulman GI. Mechanism of free fatty acid-induced insulin resistance in humans. J Clin Invest. 1996;97(12):2859–65. [DOI] [PMC free article] [PubMed] [Google Scholar]
- 51. Tessari P. Effects of insulin on whole-body and regional amino acid metabolism. Diabetes Metab Rev. 1994;10(3):253–85. [DOI] [PubMed] [Google Scholar]
- 52. Prodhan UK, Milan AM, Thorstensen EB, Barnett MPG, Stewart RAH, Benatar JR, Cameron-Smith D. Altered dairy protein intake does not alter circulatory branched chain amino acids in healthy adults: a randomized controlled trial. Nutrients. 2018;10(10):E1510. [DOI] [PMC free article] [PubMed] [Google Scholar]
- 53. Herman MA, She P, Peroni OD, Lynch CJ, Kahn BB. Adipose tissue branched chain amino acid (BCAA) metabolism modulates circulating BCAA levels. J Biol Chem. 2010;285(15):11348–56. [DOI] [PMC free article] [PubMed] [Google Scholar]
- 54. Samuel VT, Shulman GI. Mechanisms for insulin resistance: common threads and missing links. Cell. 2012;148(5):852–71. [DOI] [PMC free article] [PubMed] [Google Scholar]
- 55. Szendroedi J, Phielix E, Roden M. The role of mitochondria in insulin resistance and type 2 diabetes mellitus. Nat Rev Endocrinol. 2011;8(2):92–103. [DOI] [PubMed] [Google Scholar]
- 56. Rosenthal J, Angel A, Farkas J. Metabolic fate of leucine: a significant sterol precursor in adipose tissue and muscle. Am J Physiol. 1974;226(2):411–18. [DOI] [PubMed] [Google Scholar]
- 57. Brand MD, Nicholls DG. Assessing mitochondrial dysfunction in cells. Biochem J. 2011;435(2):297–312. [DOI] [PMC free article] [PubMed] [Google Scholar]
- 58. Laeger T, Henagan TM, Albarado DC, Redman LM, Bray GA, Noland RC, Munzberg H, Hutson SM, Gettys TW, Schwartz MW et al.. FGF21 is an endocrine signal of protein restriction. J Clin Invest. 2014;124(9):3913–22. [DOI] [PMC free article] [PubMed] [Google Scholar]
- 59. Wanders D, Stone KP, Dille K, Simon J, Pierse A, Gettys TW. Metabolic responses to dietary leucine restriction involve remodeling of adipose tissue and enhanced hepatic insulin signaling. Biofactors. 2015;41(6):391–402. [DOI] [PMC free article] [PubMed] [Google Scholar]
- 60. Wu GD, Chen J, Hoffmann C, Bittinger K, Chen YY, Keilbaugh SA, Bewtra M, Knights D, Walters WA, Knight R et al.. Linking long-term dietary patterns with gut microbial enterotypes. Science. 2011;334(6052):105–8. [DOI] [PMC free article] [PubMed] [Google Scholar]
- 61. David LA, Maurice CF, Carmody RN, Gootenberg DB, Button JE, Wolfe BE, Ling AV, Devlin AS, Varma Y, Fischbach MA et al.. Diet rapidly and reproducibly alters the human gut microbiome. Nature. 2014;505(7484):559–63. [DOI] [PMC free article] [PubMed] [Google Scholar]
- 62. den Besten G, van Eunen K, Groen AK, Venema K, Reijngoud DJ, Bakker BM. The role of short-chain fatty acids in the interplay between diet, gut microbiota, and host energy metabolism. J Lipid Res. 2013;54(9):2325–40. [DOI] [PMC free article] [PubMed] [Google Scholar]
- 63. Priyadarshini M, Villa SR, Fuller M, Wicksteed B, Mackay CR, Alquier T, Poitout V, Mancebo H, Mirmira RG, Gilchrist A et al.. An acetate-specific GPCR, FFAR2, regulates insulin secretion. Mol Endocrinol. 2015;29(7):1055–66. [DOI] [PMC free article] [PubMed] [Google Scholar]
- 64. Turnbaugh PJ, Ley RE, Mahowald MA, Magrini V, Mardis ER, Gordon JI. An obesity-associated gut microbiome with increased capacity for energy harvest. Nature. 2006;444(7122):1027–31. [DOI] [PubMed] [Google Scholar]
Associated Data
This section collects any data citations, data availability statements, or supplementary materials included in this article.