

Abstract
Background and aims
Cancer in end-stage renal disease (ESRD) patients is an important comorbidity to be taken into consideration while planning for renal replacement therapy (RRT) options due to its associated increased mortality. This study aims to investigate the natural history and association of cancer with all-cause mortality in an ESRD population receiving dialysis.
Method
The study was conducted on 1271 ESRD patients receiving dialysis between January 2012 and December 2017. A comparative analysis was carried out between 119 patients with and 1152 without cancer history at entry into this study (baseline). A 1:2 (119 cancer: 238 no cancer) propensity score matched sample of 357 patients was also used for analysis. Cox-regression analysis was used to study the strength of the association between cancer and all-cause mortality. Kaplan–Meier (KM) analysis was used to demonstrate the difference in cumulative survival between the groups. A competing risk analysis was also carried out to calculate the probability of competing events (death, transplant and incident cancer).
Results
At baseline, 10.1% of the cohort had a history of cancer (current and past) with the annual incident rate being 1.3%. Urological cancers were the leading site of cancer. The median age of our cohort was 63 years with a predominance of males (63%) and Caucasians (79%). The majority (69%) of the cohort were receiving haemodialysis. 47% had a history of diabetes with 88% being hypertensive. During a median follow-up of 28 months, the proportion of deaths observed was similar between the groups in the matched sample (cancer 49.6 versus no-cancer 52.1%, p value 0.77). In a univariable Cox-regression model, there was no significant association between cancer and all-cause mortality (HR 1.28; 95% CI 0.97–1.67; p = 0.07). The KM estimates showed similar observations in the cumulative survival between the groups (matched sample log-rank, p value 0.85). In competing risk analysis, the cumulative probability of death at 5 years was non-significantly higher in the cancer group (cancer group 64% vs no cancer group 51%, p value 0.16).
Conclusions
In our real-world multi-morbid dialysis cohort of 119 cancer patients, baseline cancer history did not prove to be an independent risk factor for all-cause mortality in the first 5 years of follow-up, suggesting the need for a case-by-case approach in provision of RRT options, including transplantation.
Keywords: Cancer, End-stage renal disease, Dialysis, All-cause mortality, Onconephrology
Introduction
Cancer in end-stage renal disease (ESRD) patients receiving dialysis can be an added burden to their overall morbidity and mortality. Urological cancers including cancers of kidney, prostate, bladder and urinary tract are noted to be the leading sites of cancer in ESRD patients, which is of no surprise given their anatomical situation [1]. An increased incidence of cancer in patients after kidney transplantation due to immunosuppression is well reported. However, it has become increasingly evident that there is an increased incidence of cancer even in ESRD patients on dialysis because of the effects of uraemic toxins [2, 3]. Cancer risk was not found to be different between patients receiving haemodialysis or peritoneal dialysis modalities [4]. The United States Renal Data System (USRDS) annual data from 2016 reports the prognosis of ESRD patients with cancer to be worse than those without, although cardiovascular disease is still the leading cause of death in this population [5]. A recent study from the Australian and New Zealand dialysis and transplant registry showed a > 2.5-fold increased risk of cancer death in dialysis and transplant recipients compared to the general population [6].
Examining the natural history of cancer in ESRD patients can help in the decision-making process for renal replacement therapy and in planning treatment withdrawal. Several recent studies looking at cancer and its association with outcomes in ESRD are reported in East Asian ethnic groups [7, 8]. However, such studies are scarce in a Caucasian population with patients managed in an entirely different health care system. This study aims to investigate the distribution of cancer and its association with mortality in ESRD patients receiving dialysis in a United Kingdom (UK) renal service.
Methods
Sampling
This cross-sectional observational study was conducted on ESRD patients receiving dialysis at Salford Royal Hospital (a tertiary renal centre in the UK with a catchment population of 1.55 million) and its four satellite units. A list of all patients who received chronic dialysis between 1st January 2012 and 31st December 2017 was generated from the hospital electronic patient records (EPR). From this list of 1446 patients, a sample of 1271 patients who were receiving dialysis for at least 3 months from recruitment and with complete follow-up datasets were included in this study. Of the 1271 patients, 128 had a history of cancer at this study entry (baseline). Further comparative analysis was carried out between 119 patients with cancer and 1152 patients without cancer, after including nine patients with non-melanoma skin cancer (NMSC) in the no cancer group. A 1:2 (119 cancer: 238 no cancer) propensity score matched sample of 357 patients generated from these groups was also used in the analysis. A flowchart of patient recruitment to the study is shown in Fig. 1.
Fig. 1.
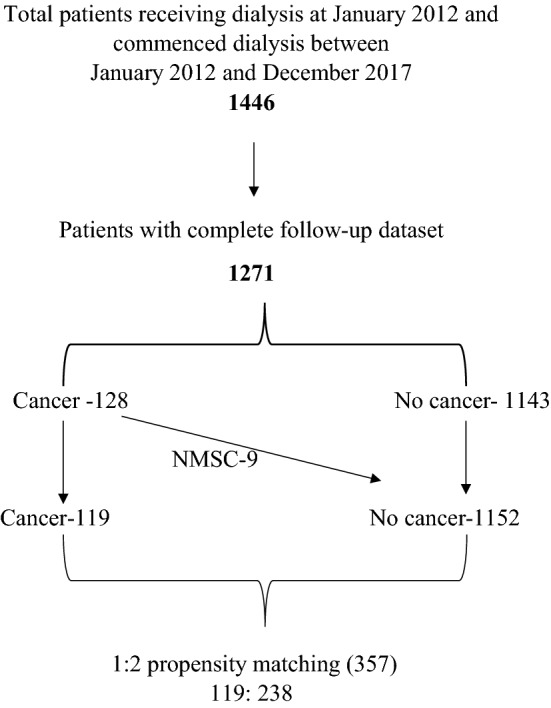
Flowchart of patient recruitment to the study
Data collection
At study baseline, data including demographics, co-morbidities, physical parameters (weight, height and blood pressure) and blood results were gathered. Follow-up data collected included incident cancer details, transplant date and date of death. The baseline study date was taken as 1/1/2012 for those patients who started dialysis before that date and the dialysis start date for the remaining of the patients. All patients were followed-up until reaching a study endpoint which included death, renal transplant, or an arbitrary end date 31/10/2018. Comprehensive cause of death data was unavailable for the patients in this cohort.
Statistics
The 119 cancer patients were matched for age, gender and ethnicity with the 1152 patients without cancer at baseline by propensity score matching. Matching was undertaken using three major variables age, gender and ethnicity by a 1:2 neighbour match of patients with the same propensity scores that were generated by the `MatchIt’ package of the R software version 3.5.1 [9, 10]. The resulting matched cohort of 357 patients was used for comparative analysis. In the comparative analysis, the continuous variables were expressed as median (interquartile range) with the Mann–Whitney U test used to define the p value while categorical data were expressed as number (percentage) and the Chi square test was used to elucidate the p value. Cox-regression analysis was used to study the strength of the association between the baseline cancer status and all-cause mortality. To overcome the influence of competing risk of death, transplant and incident cancer, data were censored at the first occurring event in the regression models [11]. The Kaplan–Meier survival curve was also used to illustrate the cumulative survival between the groups. A competing risk analysis was also conducted using ‘cmprsk’ package of the R software [12]. The p value for the competing risk model was generated using modified X2 test (Gray, 1988) [13]. The rest of the analysis was performed using SPSS (version 22), licenced to the University of Manchester. The study complies with the declaration of Helsinki and local ethical approval has been obtained from the Research and Innovation department, Northern Care Alliance NHS group (Ref: S19HRANA09).
Results
10.1% (128/1271) of this ESRD cohort had a history of cancer at baseline with an annual incident rate of 1.3% throughout the study duration. The cancer site distribution is illustrated (number of patients in each cancer type) in Fig. 2. Urological cancers were the leading site for both prevalent and incident cancers, followed by haematological cancers.
Fig. 2.

Cancer site distribution
At baseline, the median age of the cohort was 62 years, with patients in the cancer group being older (70 versus 60 years, p value < 0.001). There was a predominance of males (63%) and Caucasians (79%) in our cohort. The majority (69%) of the cohort were receiving haemodialysis. 47% of the cohort were diabetic with nearly 90% having a history of hypertension.
The groups were similar for most baseline comorbidities and cardiovascular event history apart from a higher prevalence of peripheral vascular disease noted in the cancer group (26% versus 18%, p value 0.02). The prevalence of chronic hepatitis infection (B&C) was 0.31% (4/1271). The biochemical parameters were similar in the two groups. Once propensity score matched for age, gender and ethnicity, the two groups were similar in all the baseline characteristics. Over a median follow-up of 28 months, there were more deaths noted in the cancer group (49.6% versus 39.6%, p value 0.02) although this difference was not observed in the matched sample. A significantly smaller percentage of patients in the cancer group received transplants compared to the no cancer group both in the total and matched sample (6% versus 28%, p value < 0.001) (Table 1).
Table 1.
Baseline characteristics between patients with and without cancer in the total and the matched sample
| Variable | Cancer (119) | No cancer (1152) | p value | Cancer (119) | No cancer (238) | p value |
|---|---|---|---|---|---|---|
| Age | 70 (62.6–75) | 60 (48–72) | 0.000 | 70 (62.6–75) | 69.6 (62–75.5) | 0.84 |
| Male | 79 (66.4%) | 721 (62.3%) | 0.42 | 79 (66.4%) | 170 (71.4%) | 0.34 |
| Ethnicity (Caucasian) | 107 (89.9%) | 893 (77.5%) | 0.002 | 107 (89.9%) | 216 (90.7%) | 0.79 |
| BMI | 28.1 (24.3–32) | 26.8 (23.4–31.1) | 0.14 | 28.1 (24.3–32) | 27 (23.4–31.4) | 0.43 |
| Systolic BP | 140 (124–157) | 143 (128–160) | 0.19 | 140 (124–157) | 143 (128–159) | 0.35 |
| Diastolic BP | 73 (64–86) | 78 (68–89) | 0.01 | 73 (64–86) | 73 (65–82) | 0.99 |
| Smoking | 64 (53.8%) | 519 (45%) | 0.07 | 64 (53.8%) | 134 (56.3%) | 0.65 |
| Alcohol | 102 (85.7%) | 890 (77.3%) | 0.76 | 102 (85.7%) | 185 (77.7%) | 0.71 |
| Modality (HD) | 81 (68%) | 792 (68.8%) | 0.88 | 81 (68%) | 172 (72.3%) | 0.41 |
| Hypertension | 105 (88.2%) | 1016 (88.2%) | 0.99 | 105 (88.2%) | 208 (87.4%) | 0.82 |
| Diabetes mellitus | 53 (44.5%) | 539 (46.7%) | 0.64 | 53 (44.5%) | 119 (50%) | 0.33 |
| Hypercholesterolemia | 33 (27.7%) | 302 (26.2%) | 0.72 | 33 (27.7%) | 71 (29.8%) | 0.68 |
| IHD | 36 (30.5%) | 327 (28.4%) | 0.67 | 36 (30.5%) | 75 (31.5%) | 0.81 |
| MI | 13 (10.9%) | 155 (9.9%) | 0.44 | 13 (10.9%) | 40 (16.8%) | 0.14 |
| CCF | 37 (31%) | 381 (33%) | 0.66 | 37 (31%) | 93 (39.1%) | 0.14 |
| PVD | 31 (26%) | 205 (17.8%) | 0.03 | 31 (26%) | 50 (21%) | 0.28 |
| CVA | 6 (5.04%) | 92 (%) | 0.25 | 6 (5.04%) | 25 (12.2%) | 0.08 |
| COPD | 19 (15.9%) | 180 (15.6%) | 0.92 | 19 (15.9%) | 50 (21%) | 0.26 |
| CLD | 10 (8.4%) | 100 (8.7%) | 0.92 | 10 (8.4%) | 23 (9.7%) | 0.69 |
| Chronic hepatitis (B&C) | 0/119 | 4/1152 | – | 0/119 | 1/238 | – |
| Dialysis vintagea | 37.5 (20.9–51.9) | 29.6 (11.9–54.1) | 0.26 | 37.5 (20.9–51.9) | 23.9 (11–44.4) | 0.04 |
| RAS blocker | 61 (51.3%) | 620 (53.8%) | 0.59 | 61 (51.3%) | 119 (50%) | 0.82 |
| Statin | 81 (68%) | 697 (60.5%) | 0.11 | 81 (68%) | 147 (61.7%) | 0.24 |
| HB (g/L) | 102 (89–110) | 101(89–112) | 0.79 | 102 (89–110) | 101 (89–112) | 0.80 |
| Albumin (g/L) | 37 (33–39) | 37 (32–40) | 0.78 | 37 (33–39) | 36 (32–39) | 0.62 |
| CRP (mg/L) | 18.5 (5–43) | 11(5–32) | 0.03 | 18.5 (5–43) | 12.5 (5–39) | 0.26 |
| Calcium (mmol/L) | 2.3 (2.2–2.4) | 2.33(2.2–2.4) | 0.82 | 2.3 (2.2–2.4) | 2.3(2.2–2.4) | 0.99 |
| Phosphate (mmol/L) | 1.6 (1.29–1.97) | 1.5 (1.2–1.9) | 0.24 | 1.6 (1.29–1.97) | 1.5 (1.2–1.85) | 0.15 |
| Ferritin (ug/L) | 452 (262–683) | 395 (218–670) | 0.08 | 452 (262–683) | 427 (237–703) | 0.35 |
| Follow up (months) | 27 (17–47) | 29 (16.7–47) | 0.94 | 27 (17–47) | 29.6 (17–48) | 0.68 |
| Death | 60 (49.6%) | 456 (39.6%) | 0.02 | 60 (49.6%) | 124 (52.1%) | 0.77 |
| Transplant | 7 (5.9%) | 321 (27.9%) | 0.000 | 7 (5.9%) | 38 (15.9%) | 0.007 |
Statistically significant p-values are displayed in bold (i.e. p < 0.05)
Continuous variables are expressed as median (interquartile range) and p value by Mann–Whitney U test. Categorical variables are expressed as number (%) and p value by Chi Square test
BMI body mass index, BP blood pressure (mm of Hg), DM diabetes mellitus, IHD ischemic heart disease, MI myocardial infarction, CCF congestive cardiac failure, CVA cerebrovascular accident, PVD peripheral vascular disease, COPD chronic obstructive pulmonary disease, CLD chronic liver disease, RAS renin-angiotensin system, HD haemodialysis, Hb haemoglobin, CRP c-reactive protein
aDialysis vintage was calculated for 455 patients on dialysis before the date of recruitment
In a univariable Cox-regression model, a cancer history at baseline was found not to be associated with all-cause mortality in either the total or in the matched sample (total sample, HR 1.28; 95% CI 0.97–1.67; p = 0.07). Older age, diabetes, and the presence of cardiovascular events at baseline proved to be the risk factors associated with mortality in this model (Table 2). The Kaplan–Meier chart demonstrated similar observation with no difference noted in the cumulative survival in the presence of cancer (matched sample, Log-Rank p value 0.852) (Fig. 3).
Table 2.
Univariable cox-regression model
| Variable | Total sample | Matched sample | ||
|---|---|---|---|---|
| HR (95% CI) | p value | HR (95% CI) | p value | |
| Cancer | 1.28 (0.97–1.67) | 0.08 | 0.97 (0.71–1.32) | 0.85 |
| Age | 1.04 (1.03–1.05) | 0.000 | 1.04 (1.02–1.06) | 0.000 |
| Male gender | 1.1 (0.92–1.32) | 0.286 | 1.18 (0.84–1.7) | 0.35 |
| Caucasian | 1.39 (1.11–1.7) | 0.004 | 0.98 (0.58–1.6) | 0.94 |
| Smoking | 1.32 (1.11–1.57) | 0.001 | 1.1 (0.82–1.48) | 0.52 |
| Diabetes | 1.56 (1.31–1.86) | 0.000 | 0.99 (0.75–1.3) | 0.98 |
| Modality (HD) | 1.04 (0.86–1.26) | 0.68 | 1.02 (0.73–1.41) | 0.93 |
| IHD | 1.58 (1.33–1.88) | 0.000 | 1.48 (11–1.98) | 0.008 |
| MI | 1.73 (1.41–2.14) | 0.000 | 1.44 (1.01–2.0) | 0.04 |
| CCF | 1.86 (1.56–2.2) | 0.000 | 1.52 (1.13–2.02) | 0.005 |
| PVD | 1.43 (1.17–1.74) | 0.000 | 1.27 (0.93–1.75) | 0.14 |
| CVA | 1.60 (1.23–2.08) | 0.000 | 1.56 (0.98–2.46) | 0.06 |
Statistically significant p-values are displayed in bold (i.e. p < 0.05)
IHD ischemic heart disease, MI myocardial infarction, CCF congestive cardiac failure, CVA cerebrovascular accident, PVD peripheral vascular disease, HD haemodialysis
Fig. 3.
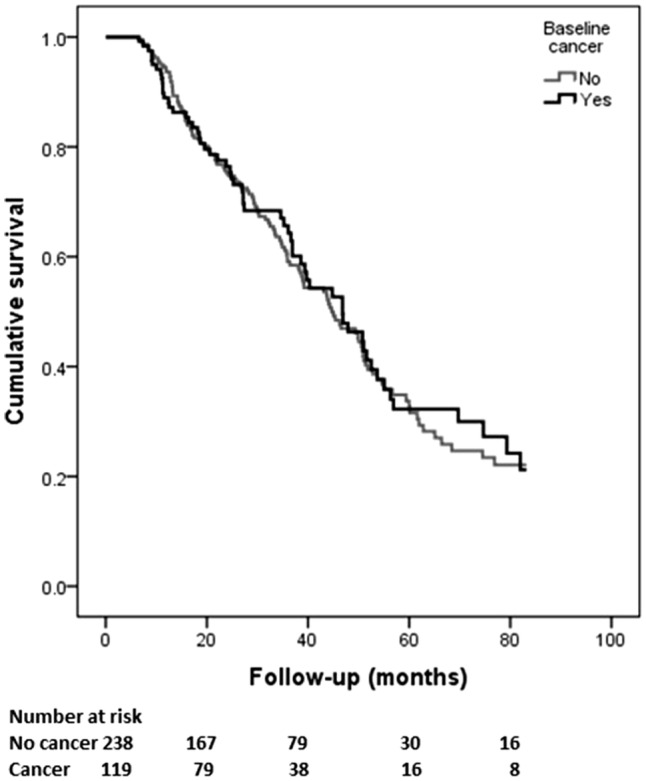
Kaplan–Meier chart comparing baseline cancer status with all-cause mortality in the matched sample
In a competing risk model including death, transplant and incident cancer as endpoints, a higher probability of death at 5 years was noted in the cancer group however the difference was not statistically significant (64% versus 51%, p value 0.16). The patients in the no cancer group had a significantly higher probability of having received a transplant at 5 years (18% versus 6%, p value 0.01) (Table 3 and Fig. 4).
Table 3.
Cumulative incidence probability for death and transplant between the groups (cancer vs. non-cancer) in the matched sample
| Months | Status (number at risk) | Death | Transplant |
|---|---|---|---|
| 20 | Cancer (79) | 0.19 | 0.02 |
| No cancer (167) | 0.18 | 0.05 | |
| 40 | Cancer (38) | 0.40 | 0.07 |
| No cancer (79) | 0.38 | 0.13 | |
| 60 | Cancer (16) | 0.64 | 0.07 |
| No cancer (30) | 0.51 | 0.18 | |
| p value | 0.16 | 0.01 |
Fig. 4.
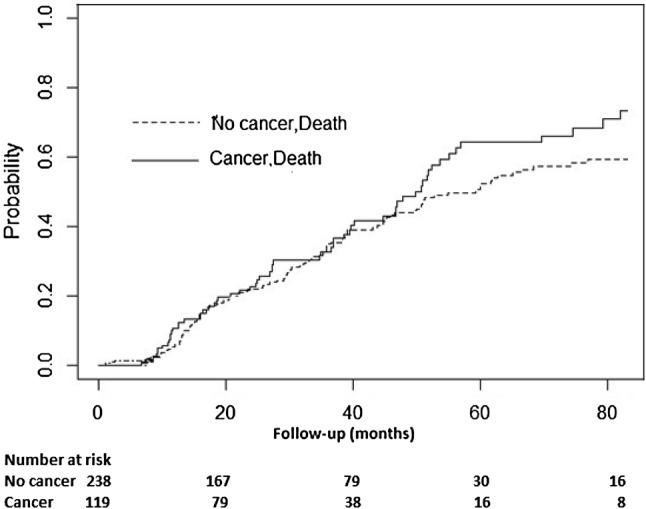
Cumulative probability of death between the groups in competing risk model in the matched sample
Discussion
Our study has given an overview of the distribution of various cancers and their association with all-cause mortality in a representative UK ESRD population receiving dialysis. The cancer prevalence rate of 10.1% and incident rate 1.3% are similar to observations in other dialysis cohorts [14, 15]. The prevalence of all cancer including NMSC in the UK general population in December 2015 was calculated to range between 2.4 and 3.9% across the regions (Public Health England data) and the incidence rate for all cancers in 2015 was 0.83% (Cancer Research UK). (https://www.cancerresearchuk.org/health-professional/cancer-statistics/incidence).
Urological (kidney, prostate, bladder and urinary tract) cancers followed by haematological cancers were the leading cancer distribution sites in our cohort which is in agreement with earlier reports [16]. The prevalence and incidence of hepatocellular carcinoma was low in our cohort compared to observations in East Asian populations which is likely due to a lower prevalence of viral hepatitis (0.31%), due to effective screening and immunisation practices [17, 18]. Patients with NMSC were included in the no cancer group for the comparative analysis as the 10-year mortality rate of patients with NMSC is reported to be the same as the general population [19].
The patients in the cancer group had a significantly higher median age at baseline compared to those without cancer. Association of old age with cancer is well documented [20]. A higher percentage of deaths was observed in the cancer group in the total sample, a likely reflection of the higher age in this group as this difference was not observed in the age matched sample. A significantly lesser proportion of patients in the cancer group received a kidney transplant, which may indicate a mindful risk-based approach in the transplant work-up [21].
In our study, a history of cancer did not prove to be an independent risk factor for all-cause mortality. The association of cancer with all-cause mortality in the ESRD population receiving dialysis has been variably reported. The mortality risk due to cancer in dialysis patients was noted to be similar to the general population in a multicentre study in Hong Kong by Cheung et al. [15], but few other studies have shown such an increased risk [22, 23]. The Dialysis Outcomes and Practice Patterns Study (DOPPS) in 2003 showed cancer as an independent risk factor to be associated with all-cause mortality (HR: 1.28, p < 0.001) [24]. In the ERA-EDTA registry study, among the non-cardiovascular causes of death in dialysis patients, infection-related mortality was increased by 82-fold while that of cancer-related mortality was 2.9 times higher than the general population [25]. In another large Japanese study comparing the mortality risk between the general population and dialysis patients, the all-cause mortality was found to be sevenfold higher in dialysis patients than the general population in the 60–74-year age group, which was mainly attributed to cardiovascular events and infection-related death (36 fold higher risk) while malignancies contributed to only a twofold higher risk [26].
The lack of association between the cancer status and all-cause mortality in our cohort may reflect a combination of increased mortality due to cardiovascular events and a careful choice in the provision of renal replacement therapy (RRT) options for ESRD patients. The difference observed in the uptake of kidney transplantation between the groups also strengthens this hypothesis.
Our study is limited by the single centre observational nature of the study methodology. Also, the lack of cause of death data limited our ability to identify the cancer-specific mortality risk. Our data was not able to capture the stage or treatment status of cancer, which might have had an influence on the results. In addition, we cannot exclude the possibility of a hidden selection bias in sampling, as cancer patients with limited expected survival may not choose to start RRT when ESRD supervenes.
In conclusion, there is an increased prevalence and incidence of cancer in ESRD patients receiving dialysis, with urological cancers being the leading cancer site, as might be expected by anatomical relationships. Baseline cancer history did not prove to be an independent risk factor for all-cause mortality in our multi-morbid dialysis population. There is a need for a careful case-by-case based approach in the provision of RRT options, including transplantation, in ESRD patients with cancer.
Acknowledgements
We extend our acknowledgements to all Salford dialysis units and patients.
Author contributions
Conception or design, or analysis and interpretation of data, or both: RC, EF, PK; Drafting the article or revising it: RC, PK; Providing intellectual content of critical importance to the work described: RC, PK; Final approval of the version to be published: RC, PK.
Funding
No financial support
Availability of data and material
The datasets used and/or analysed during the current study are available from the corresponding author on reasonable request.
Compliance with ethical standards
Conflict of interest
No competing interest to declare
Ethical approval and informed consent
The study complies with the declaration of Helsinki and ethical approval for this study was obtained from the Research and Innovation department of the Northern Care Alliance NHS Group (Ref: S19HRANA09). As this was a retrospective observational study with full patient anonymity, the Northern Care Alliance NHS Group Research and Innovation review board determined that the need for informed consent from surviving patients should be waived.
Footnotes
Publisher's Note
Springer Nature remains neutral with regard to jurisdictional claims in published maps and institutional affiliations.
References
- 1.Maisonneuve P, Agodoa L, Gellert R, Stewart JH, Buccianti G, Lowenfels AB, et al. Cancer in patients on dialysis for end-stage renal disease: an international collaborative study. Lancet. 1999;354(9173):93–99. doi: 10.1016/S0140-6736(99)06154-1. [DOI] [PubMed] [Google Scholar]
- 2.Stewart JH, Vajdic CM, Van Leeuwen MT, Amin J, Webster AC, Chapman JR, et al. The pattern of excess cancer in dialysis and transplantation. Nephrol Dial Transplant. 2009;24(10):3225–3231. doi: 10.1093/ndt/gfp331. [DOI] [PubMed] [Google Scholar]
- 3.Fischereder M. Cancer in patients on dialysis and after renal transplantation. Nephrol Dial Transplant. 2008;23(8):2457–2460. doi: 10.1093/ndt/gfn183. [DOI] [PubMed] [Google Scholar]
- 4.Lee YC, Hung SY, Wang HK, Lin CW, Wang HH, Chang MY, et al. Is there different risk of cancer among end-stage renal disease patients undergoing hemodialysis and peritoneal dialysis? Cancer Med. 2018;7(2):485–498. doi: 10.1002/cam4.1289. [DOI] [PMC free article] [PubMed] [Google Scholar]
- 5.Saran R, Robinson B, Abbott KC, Agodoa LYC, Bragg-Gresham J, Balkrishnan R, et al. US renal data system 2016 annual data report: epidemiology of kidney disease in the United States. Am J Kidney Dis. 2017;71(3):A7. doi: 10.1053/j.ajkd.2018.01.002. [DOI] [PMC free article] [PubMed] [Google Scholar]
- 6.Au EH, Chapman JR, Craig JC, Lim WH, Teixeira-Pinto A, Ullah S, et al. Overall and site-specific cancer mortality in patients on dialysis and after kidney transplant. J Am Soc Nephrol. 2019;30:471–480. doi: 10.1681/ASN.2018090906. [DOI] [PMC free article] [PubMed] [Google Scholar]
- 7.Yoo KD, Lee JP, Lee SM, Park JY, Lee H, Kim DK, et al. Cancer in Korean patients with end-stage renal disease: a 7-year follow-up. PLoS One. 2017;12(7):e0178649. doi: 10.1371/journal.pone.0178649. [DOI] [PMC free article] [PubMed] [Google Scholar]
- 8.Loy EY, Choong HL. Cancer among end-stage renal disease patients on dialysis. Ann Acad Med. 2013;42:640. [PubMed] [Google Scholar]
- 9.R Development Core Team (2018), R: a language and environment for statistical computing,Vienna, Austria : the R Foundation for Statistical Computing. ISBN: 3-900051-07-0. Available online at https://cran.r-project.org/mirrors.html. Accessed 15 Apr 2019
- 10.Randolph JJ, Falbe K, Manuel AK, Balloun JL. A step-by-step guide to propensity score matching in R. Pract Assess Res Eval. 2014;19(18):1–6. [Google Scholar]
- 11.Noordzij M, Leffondré K, Van Stralen KJ, Zoccali C, Dekker FW, Jager KJ. When do we need competing risks methods for survival analysis in nephrology? Nephrol Dial Transplant. 2013;28(11):2670–2677. doi: 10.1093/ndt/gft355. [DOI] [PubMed] [Google Scholar]
- 12.Scrucca L, Santucci A, Aversa F. Regression modeling of competing risk using R: an in depth guide for clinicians. Bone Marrow Transplant. 2010;45(9):1388–1395. doi: 10.1038/bmt.2009.359. [DOI] [PubMed] [Google Scholar]
- 13.Gray RJ. A class of k sample tests for comparing the cumulative incidence of a competing risk. Ann Stat. 1988;16:1142–1154. doi: 10.1214/aos/1176350951. [DOI] [Google Scholar]
- 14.Mazzucotelli V, Piselli P, Verdirosi D, Cimaglia C, Cancarini G, Serraino D, et al. De novo cancer in patients on dialysis and after renal transplantation: north-western Italy, 1997–2012. J Nephrol. 2017;30(6):851–857. doi: 10.1007/s40620-017-0385-y. [DOI] [PubMed] [Google Scholar]
- 15.Cheung CY, Chan GCW, Chan SK, Ng F, Lam MF, Wong SSH, et al. Cancer incidence and mortality in chronic dialysis population: a multicenter cohort study. Am J Nephrol. 2016;43(3):153–159. doi: 10.1159/000445362. [DOI] [PubMed] [Google Scholar]
- 16.Stewart JH, Buccianti G, Agodoa L, Gellert R, McCredie MR, Lowenfels AB, et al. Cancers of the kidney and urinary tract in patients on dialysis for end-stage renal disease: analysis of data from the United States, Europe, and Australia and New Zealand. J Am Soc Nephrol. 2003;14(1):197–207. doi: 10.1097/01.ASN.0000039608.81046.81. [DOI] [PubMed] [Google Scholar]
- 17.Chien CC, Han MM, Chiu YH, Wang JJ, Chu CC, Hung CY, et al. Epidemiology of cancer in end-stage renal disease dialysis patients: a national cohort study in Taiwan. J Cancer. 2017;8(1):9–18. doi: 10.7150/jca.16550. [DOI] [PMC free article] [PubMed] [Google Scholar]
- 18.Geddes C, Lindley E, Duncan N. Renal association clinical practice guideline on prevention of blood borne virus infection in the renal unit. Nephron Clin Pract. 2011;118(SUPPL. 1):165–188. doi: 10.1159/000328068. [DOI] [PubMed] [Google Scholar]
- 19.Jensen AØ, Lamberg AL, Jacobsen JB, Olesen AB, Sørensen HT. Non-melanoma skin cancer and ten-year all-cause mortality: a population-based cohort study. Acta Derm Venereol. 2010;90(4):362–367. doi: 10.2340/00015555-0899. [DOI] [PubMed] [Google Scholar]
- 20.White MC, Holman DM, Boehm JE, Peipins LA, Grossman M, Jane Henley S. Age and cancer risk: a potentially modifiable relationship. Am J Prev Med. 2014;46(3):7–15. doi: 10.1016/j.amepre.2013.10.029. [DOI] [PMC free article] [PubMed] [Google Scholar]
- 21.Frascà GM, Brigante F, Volpe A, Cosmai L, Gallieni M, Porta C. Kidney transplantation in patients with previous renal cancer: a critical appraisal of current evidence and guidelines. J Nephrol. 2019;32(1):57–64. doi: 10.1007/s40620-018-0542-y. [DOI] [PubMed] [Google Scholar]
- 22.Lee JE, Han SH, Cho BC, Park JT, Yoo TH, Kim BS, et al. Cancer in patients on chronic dialysis in Korea. J Korean Med Sci. 2009;24(1):95–101. doi: 10.3904/kjim.2009.24.2.95. [DOI] [PMC free article] [PubMed] [Google Scholar]
- 23.Tanaka A, Inaguma D, Shinjo H, Murata M, Takeda A. Relationship between mortality and cancer-bearing status at time of dialysis initiation. Ther Apher Dial. 2017;21(4):345–353. doi: 10.1111/1744-9987.12525. [DOI] [PubMed] [Google Scholar]
- 24.Goodkin DA, Bragg-Gresham JL, Koenig KG, Wolfe RA, Akiba T, Andreucci VE, et al. Association of comorbid conditions and mortality in hemodialysis patients in europe, japan, and the united states: the dialysis outcomes and practice patterns study (DOPPS) J Am Soc Nephrol. 2003;14(12):3270–3277. doi: 10.1097/01.ASN.0000100127.54107.57. [DOI] [PubMed] [Google Scholar]
- 25.Vogelzang JL, Van Stralen KJ, Noordzij M, Diez JA, Carrero JJ, Couchoud C, et al. Mortality from infections and malignancies in patients treated with renal replacement therapy: data from the ERA-EDTA registry. Nephrol Dial Transplant. 2015;30(6):1028–1037. doi: 10.1093/ndt/gfv007. [DOI] [PubMed] [Google Scholar]
- 26.Wakasugi M, Kazama JJ, Yamamoto S, Kawamura K, Narita I. Cause-specific excess mortality among dialysis patients: comparison with the general population in Japan. Ther Apher Dial. 2013;17(3):298–304. doi: 10.1111/j.1744-9987.2012.01144.x. [DOI] [PubMed] [Google Scholar]
Associated Data
This section collects any data citations, data availability statements, or supplementary materials included in this article.
Data Availability Statement
The datasets used and/or analysed during the current study are available from the corresponding author on reasonable request.