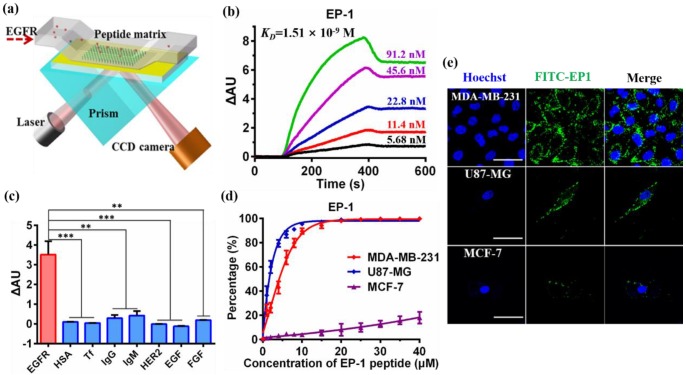
Figure 1.
Evaluation of the affinity and specificity of peptide EP-1 towards EGFR. (a) Schematic illustration of high-throughput peptide library screening using surface plasmon resonance imaging (SPRi). The synthesized thiol-containing peptides were immobilized on the gold-coated SPRi chip. EGFR was passed through the flow chamber at various concentrations to check its binding with the peptides. (b) Representative SPRi sensorgram shows the binding of EP-1 to different concentrations of EGFR. The KD value was determined to be 1.51 × 10⁻⁹ M using BIAevaluation version 4.1 software (Biacore, Inc.). (c) SPRi binding signals of EP-1 towards EGFR, HSA, Tf, IgG, IgM, HER2, EGF and FGF. Error bars represent the standard deviation (n = 3). **p < 0.01, ***p < 0.001 (Student's t-test). (d) Binding affinity of EP-1 towards EGFR in MDA-MB-231, U87-MG and MCF-7 cell lines. The percentage of cells bound with FITC-labeled EP-1 was detected by flow cytometry. Error bars represent the standard deviation (n = 3). (e) Confocal microscopic images showing the binding of FITC-labeled EP-1 to MDA-MB-231 (upper), U87-MG (middle) and MCF-7 (bottom). Cells were incubated with 40 μM of FITC-EP1 for 1 h. Scale bar: 50 μm.

