Abstract
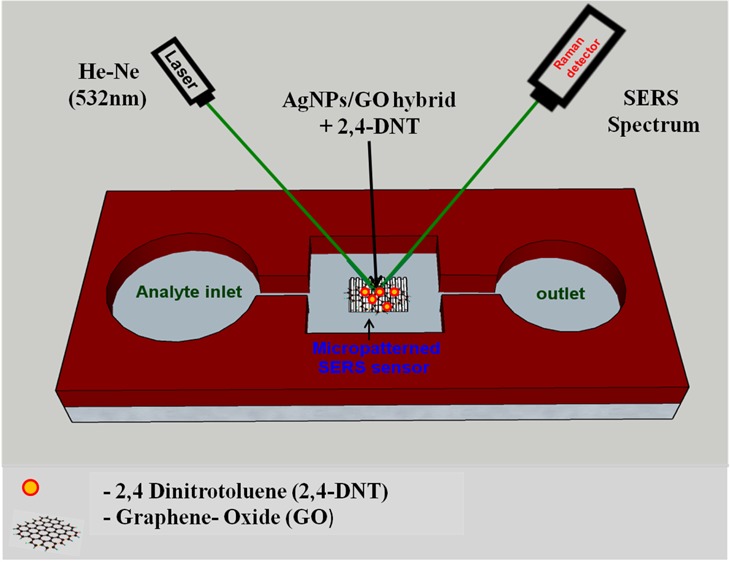
We demonstrate an ultrafast laser-ablated hierarchically patterned silver nanoparticle/graphene oxide (AgNP/GO) hybrid surface-enhanced Raman scattering (SERS) substrate for highly sensitive and reproducible detection of an explosive marker 2,4-dinitrotoluene (2,4-DNT). A hierarchical laser-patterned silver sheet (Ag–S) is achieved by ultrafast laser ablation in air with pulse energies of 25, 50, and 100 μJ. Multiple laser pulses at a wavelength of 800 nm and a pulse repetition rate of 50 fs at 1 kHz are directly focused on Ag–S to produce and deposit AgNPs onto Ag–S. The surface morphology of ablated Ag–S was evaluated using atomic force microscopy, optical profilometry, and field emission scanning electron microscopy (FESEM). A rapid increase in the ablation rate with increasing laser energy was observed. Selected area Raman mapping is performed to understand the intensity and size distribution of AgNPs on Ag–S. Further, GO was spin-coated onto the AgNPs produced by ultrafast ablation on Ag–S. The hierarchical laser-patterned AgNP/GO hybrid structure was characterized using FESEM, high-resolution transmission electron microscopy, X-ray diffraction, Fourier transform infrared spectroscopy, and Raman spectroscopy. Further, hierarchical laser-patterned AgNP/GO hybrid structures have been utilized as SERS-active substrates for the selective detection of 2,4-DNT, an explosive marker. The developed SERS-active sensor shows good stability and high sensitivity up to picomolar (pM) concentration range with a Raman intensity enhancement of ∼1010 for 2,4-DNT. The realized enhancement of SERS intensity is due to the cumulative effect of GO coated on Ag–S as a proactive layer and AgNPs produced by ultrafast ablation.
1. Introduction
In recent years, surface-enhanced Raman scattering (SERS) technique1 has emerged as a highly sensitive and selective analytical tool for the identification of warfare agents,2 food safety inspection,3 medical diagnostics,4 and chemical/biological5 species at trace concentrations adsorbed on substrates containing noble metal (Ag, Au, and Cu) nanostructured surfaces or nanoparticles (NPs).6 Apart from sensitivity and selectivity, several other factors such as ease of sample preparation, nondestructive nature, real-time response, and label-free detection of molecules of interest make SERS a versatile, cost-effective, and acceptable technology for practical sensing applications.7 In the SERS-based analytical detection technique, typically two major amplification mechanisms responsible for the Raman intensity enhancement are reported: an electromagnetic enhancement (EM) and a chemical enhancement (CE). EM originates from huge local electric field because of surface plasmon resonance (SPR) of the nanostructured metallic particles; on the other hand, CE contributes because of the charge transfer between the SERS-active substrate and the molecule of choice adsorbed on the surface.8−10 However, a significant problem in using the SERS technique as a regular analytical tool capable of detecting low concentration levels of an analyte is the development of reusable, homogeneous, reproducible, cost-effective, and stable SERS-active substrates. Because both the amplification mechanisms contribute simultaneously in the Raman intensity enhancement, one needs to fabricate SERS hybrid substrates which can utilize both amplification mechanisms at the same time.
Recently, graphene and graphene oxide (GO)/reduced GO (rGO)-based carbon materials in combination with noble metals, particularly silver nanoparticles (AgNPs)/nanostructures, have been used by many research groups to improve the sensitivity, stability, and reproducibility of the SERS substrates by protecting the AgNPs/nanostructures from oxidation.11−15 GO has a 2D structure in which a uniform monolayer of carbon atoms is arranged in a honeycomb crystal plane. Furthermore, graphene and its derivatives are atomically flat, which provides excellent transmission and efficient charge transfer because of the short distance between the graphene/GO and the analyte molecule to be probed for SERS detection. Also, being a florescent quencher, GO can be used as an active SERS substrate for fluorescent molecules. Recently, Xu et al. demonstrated various hybrid SERS substrates having a combination of metal NPs and GO for the detection of adenosine and DNA molecules. For adenosine detection, two different substrates having graphene-wrapped Cu NP hybrids (G/Cu NP) prepared by chemical route16 and graphene-isolated AgNPs (G/AgNP) by using excimer laser were used.17 Furthermore, they reported that a graphene single-crystal domain patterned into multiple channels could measure time- and concentration-dependent DNA hybridization kinetics and affinity reliably and sensitively with a detection limit of 10 pM for the DNA.18 Yang et al. have proposed an SERS substrate based on silver-plated cicada wings with a seamless graphene layer (GrAgNPs-C.w.). They have compared AgNPs-C.w. and Gr-AgNPs-C.w. hybrids, which suggested that Gr-AgNPs-C.w. demonstrated superior SERS performance with high sensitivity, good uniformity, and good stability with R6G detection. The minimum detected concentration was found to be 10–15 M.19
A lot of SERS-based research work has been reported on rGO-based AgNP (rGO/AgNP) hybrid composites either in wet chemical phase or on solid substrates.20−23 These rGO/AgNP hybrid structures show great potential as SERS-active substrates because the charge transfer between the adsorbate and rGO leads to chemical amplification mechanism; on the other hand, SPR of AgNPs results in electromagnetic amplification.
Several researchers have employed several bottom-up and top-down micro–nano fabrication-based approaches to fabricate the SERS-active substrate including core–shell nanowire array,24 self-assembled metal colloid monolayers,25 template method,26 self-assembly,27 nanosphere lithography,28 electron-beam lithography,29 nanoimprint lithography,30 deep ultraviolet photolithography,31 and so on. Majority of these techniques mentioned above are complicated, time-consuming, and/or expensive in nature and need a huge infrastructure. The femtosecond (fs) laser-based ultrafast ablation technique is a potential technique for rapid, facile, and economical fabrication of nanostructured metallic ordered arrays over large area. The femtosecond laser–material interaction has recently been utilized as a fast and reproducible technique to obtain hierarchically patterned nanostructured metal sheets on a large area for SERS application.2 The surface morphology of the metal sheet can be controlled by tuning various laser ablation parameters such as average laser power, pulse width, scan rate, and the surrounding medium such as liquid32 and air.33
Several research groups have been working on the different properties of femtosecond laser-ablated nanosheets (NSs) and NPs in air as well as in liquid medium. Han et al. have demonstrated a facile laser scribing method to fabricate AgNPs and GO-based biochips as a reusable SERS sensor for DNA detection. They demonstrate direct patterning of SERS-sensitive channels by programmable laser scribing of the AgNP/GO composite films, which consist of graphene-supported AgNPs by exfoliating the composites into hierarchically porous structures. On-chip SERS detection of a 30-base ssDNA samples at a concentration of 10–6 M has been achieved within 1 min.34 Ma et al. fabricated SERS-active metallic micro–nano structures by using femtosecond laser. In this work, they have used a series of femtosecond laser-mediated fabrication strategies, including the two-photon reduction of metal ions, template-assisted metal coating and metal filling, photodynamic assembly of metal NPs, and selective NP sintering. It was found that the femtosecond laser ablation method plays a crucial role in the fabrication of metal nano/microstructures. The fabrication of nano/microstructures with arbitrary shapes and appropriate roughness with high resolution has been developed with this technique.35 Yan et al. reported the fabrication of rGO grating structures using two-beam laser interference for the fabrication of SERS substrates via simple physical vapor deposition coating of silver. Hierarchical rGO grating structures with microscale gratings and nanoscale folders through a laser treatment-induced ablation and photoreduction process have been achieved. Further, the prepared rGO gratings were used for the detection of rhodamine B and a detection limit of 10–10 M was achieved.36 Lu et al. demonstrated a sensitive, reproducible, and stable 3D plasmonic hybrid with bilayer WS2 as a nanospacer for SERS analysis. They have fabricated an SERS substrate (AuNP/WS2@AuNPs hybrid) by inserting a bilayer film of WS2 as the nanospacer. A tight combination of WS2 film with AuNPs was done by using thermal decomposition method. Rhodamine 6G dye was detected with a minimum detection limit of 10–11 M.37
Li et al. reported a novel SERS substrate based on GO/AgNP/Cu film-covered silicon pyramid arrays by wet texturing technology to detect rhodamine-6G, methylene blue (MB), and crystal violet (CV) on AgNP/PCu@Si and GO/AgNP/PCu@Si substrates.38 The limit of detection was found to be 10–15, 10–9, and 10–9 M for rhodamine-6G, MB, and CV. Byram et al. demonstrated versatile gold-based SERS substrates fabricated by ultrafast laser ablation for sensing of picric acid (PA) and ammonium nitrate (AN). They accomplished the detection of AN, PA, rhodamine-6G (Rh6G), and MB at 10–5, 10–6, 10–7, and 10–8 M concentrations by using AuNSs as the SERS substrate fabricated through ultrafast laser ablation technique in liquids.39 Bao et al. demonstrated ultrathin tin oxide layer-wrapped gold NPs induced by laser ablation in solution-based SERS substrate and their enhanced performances. In this work, they presented a simple and flexible technique for the synthesis of ultrathin semiconductor oxide layer-wrapped AuNPs. After laser ablation of Au target in AuCl4 solutions, the size of the obtained AuNPs was found to be 2 nm. The process of the formation of Au@SnO2 NPs involves two steps: the laser ablation-induced formation of AuNPs and subsequent Coulomb effect-based colloidal attachment and self-assembly on the AuNPs. It was found that the Au@SnO2 NP-built film shows stronger SERS effect to organic phosphor molecules (phenyl phosphonic acid) and excellent performance in gas sensing to H2S at room temperature compared with the bare AuNP and pure SnO2 NP films, respectively.40 Dell’Aglio et al. reported the mechanisms and processes of pulsed laser ablation in liquids (PLALs) during NP production. In this work, PLAL for the formation of NPs was studied by applying different time-resolved diagnostic techniques, such as optical emission spectroscopy, shadowgraph, laser scattering imaging, and DP-LAL (double-pulse LAL) for laser-induced breakdown detection. The results demonstrated that NPs are produced in the first stage of the PLAL process, that is, during the plasma cooling. This observation clearly explains the narrow distribution of size generally observed in NPs synthesized by PLAL technique.41
Herein, we propose a facile route for preparing SERS-active substrates based on hierarchical laser-patterned Ag sheet/GO (AgNP/GO) hybrid structure. Hierarchically patterned Ag sheets were achieved by ultrafast laser ablation of Ag bulk sheet (Ag–S) in the air with different laser energies (25, 50, and 100 μJ). Each laser-ablated Ag–S was ascribed onto 5 × 5 mm2 area with an interablated distance of 100 μm for the fabrication of hierarchical nanostructure. Subsequently, well-synthesized GO was spin-coated on each nanostructured Ag sheets to make AgNP/GO hybrid structure to prevent Ag nanostructures from oxidation as well as to enhance the SERS intensity through charge transfer. Developed hybrid structures were inspected using field emission scanning electron microscopy (FESEM), high-resolution transmission electron microscopy (HRTEM), Fourier transform infrared (FTIR) spectroscopy, atomic force microscopy (AFM), and X-ray diffraction (XRD) technique. Further, the hybrid structure has been used as a sensing platform for SERS-based selective detection of 2,4-dinitrotoluene (2,4-DNT), an explosive marker, at different concentrations (10–3, 10–6, 10–9, and 10–12 M). A schematic of the fabrication of hierarchically patterned AgNP/GO hybrid using femtosecond laser ablation and further SERS studies for the detection of explosive marker 2,4-DNT is shown in Figure 1.
Figure 1.
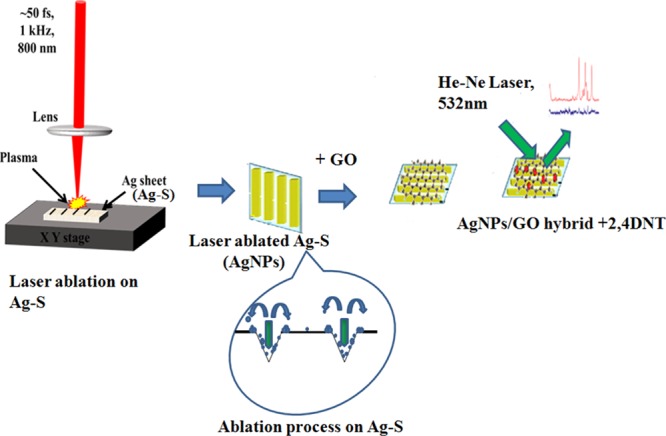
Schematic of the preparation of AgNP/GO composite using femtosecond laser ablation followed by SERS studies.
2. Results and Discussion
Laser ablation is a simple one-step route to fabricate nanostructures on solid thin metal sheets such as Ag, Au, and Cu either in air or in liquid medium for SERS-active substrates with the added advantage of high speed, low cost, and high throughput on large area.
2.1. Multiline Laser Ablation of Bulk Ag Sheet
An Ag sheet (Ag–S) target of 1 mm thickness has been used for the multiline ablation using ultrafast femtosecond laser in the air with laser energies of 25, 50, and 100 μJ. The surface roughness of Ag–S has been measured in several spots across the 5 × 5 mm2 area before ablation using AFM. The average surface roughness (root mean square) is found to be 17 ± 2 nm (Figure S1). Further, laser ablation on Ag–S with interspacing lines of 100 μm on 5 × 5 mm2 area has been performed. Figure 2 shows the schematic diagram of laser ablation process on Ag–S using femtosecond laser. The laser pulses were scanned across Ag–S at a speed of 0.1 mm/s and focused onto Ag–S by a lens.
Figure 2.
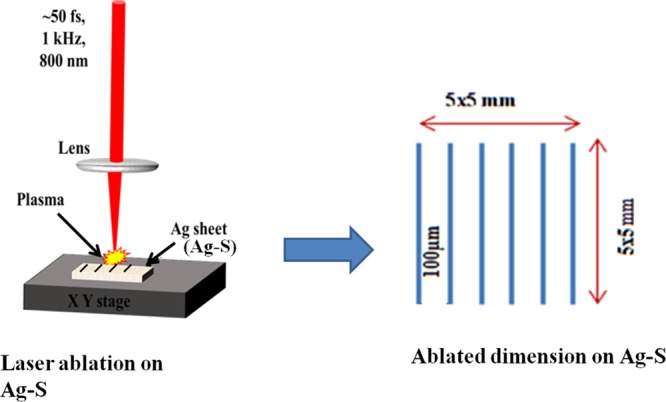
Schematic of multiline ultrafast laser ablation for AgNP deposition.
Laser ablation of Ag–S is a complicated process to remove and transport AgNPs. When the laser pulses with high enough energy ablate Ag–S, the absorbed laser energy causes a breakdown of the Ag–S target and formed plasma. The interaction between the plasma species and the air molecules decreases the kinetic energy of plasma species gradually, which promotes the aggression of plasma species to form NPs. When an ultrafast fs laser pulse interacts with the surface of Ag sheet, melting of the surface takes place at room temperature. Because of this effect, the higher pressure was generated at the surface of the Ag sheet, hence results in nanotexturing on the surface. These NPs gradually release the kinetic energy during transport and are deposited onto Ag–S because of the gravity force. Further, Ag–S ablated at three different energies (25, 50, and 100 μJ) were examined using optical profilometry in the noncontact mode as illustrated in Figure 3.
Figure 3.
Profilometry images of laser-ablated AgNSs at input energies of (a) 25 (b) 50, and (c) 100 μJ.
Figure 3a–c depicts the profilometry images of Ag–S ablated at 25, 50, and 100 μJ, respectively. The images indicate that the ablated depth increases with an increase in laser energy. Similarly, the ablated width also increases with the increase in the laser energy, whereas the remaining width between the two ablated lines decreases. Initially, the distance between the two ablated lines (width) was 100 μm. After ablation, the width starts to decrease because of melting (remaining width).
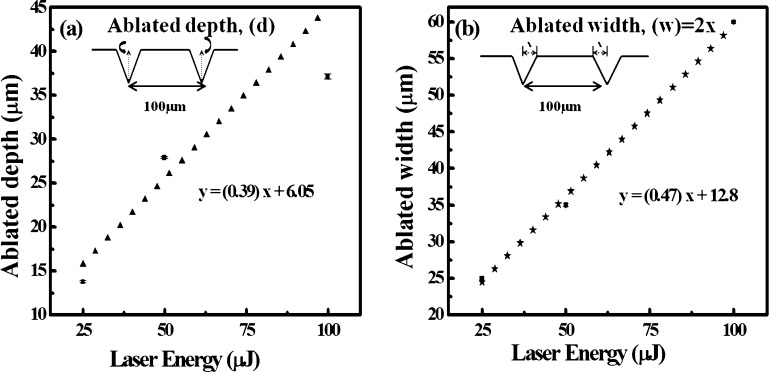
Data in Figure 4a illustrate that the variation of ablated depth (d) with laser energy is almost linear. The inset of Figure 4a represents the ablated depth (d). It is evident from Figure 4a that the “d” on Ag–S was 14 ± 2, 28 ± 2, and 37 ± 3 μm at input laser energies of 25, 50, and 100 μJ, respectively.
Figure 4.
Variation of (a) ablated depth and (b) ablated width between two ablated lines with laser energy. The inset shows the definition of “d” and “w”.
Figure 4b shows the variation of ablated width with laser energy. The inset of Figure 4b represents the distance between two ablated lines, the ablated width and the remaining width. The dotted lines represent the ablated width (w) and the solid line represents the remaining width. The ablated widths at 25, 50, and 100 μJ were found to be 12.5, 16.5, and 30 μm, respectively. This indicates that the “w” increases and the remaining width decreases with increase in laser energy. The remaining width is found to be 75, 65, and 40 μm at input laser energies of 25, 50, and 100 μJ, respectively. This is because as the laser energy is incident on the surface of Ag–S, the point of contact heats up and melts. As the laser energy increases, more and more heat energy is generated at the point of interaction, which results in more melting of the material and hence increasing the ablated width.
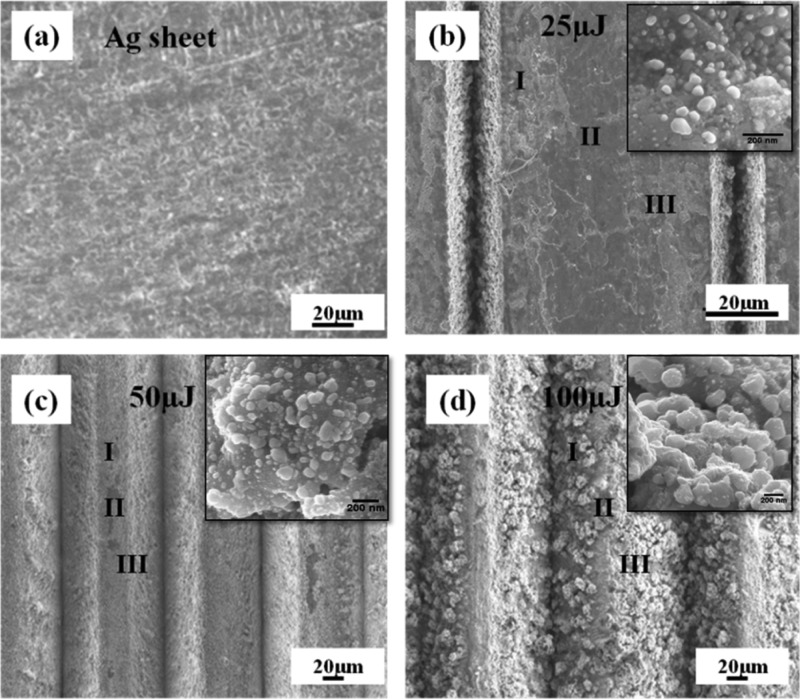
The surface morphologies of the laser-ablated Ag–S at 25, 50, and 100 μJ energies have been investigated by FESEM and the images are shown in Figure 5. Figure 5a shows the surface morphology of the pre-cleaned Ag–S before laser ablation. The bulk Ag sheet (Ag–S) looks perfectly flat with low roughness of around 17 nm (Figure S1), which can be seen from Figure 5a.
Figure 5.
FESEM images of (a) Ag sheet, (b) Ag NS ablated at 25, (c) 50, and (d) 100 μJ laser energies. The insets show the AgNP formation on the surface in region II.
The same Ag–S depicted in Figure 5a was ablated. Figure 5b shows that the surface of Ag–S ablated by 25 μJ, found almost flat, similar to Ag–S before ablation except close to the ablated lines, where small population of the ablated AgNPs is found to be deposited after ablation. On the other hand, in the case of 50 μJ, the density of the AgNPs was much higher closer to the ablated lines and very few in the middle portion of Ag–S as compared to the 25 μJ cases. However, in the case of 100 μJ, most of the ablated AgNPs are found to be lying in the middle portion of the Ag sheet because the ablated width between the two ablated lines decreases with the increase in laser energy. The variation in the ablated width due to laser energy can also be seen in the profilometry data (Figure 4). The images of AgNPs have been shown in the inset of Figure 5b–d, along with ablated energies of 25, 50, and 100 μJ. The insets of Figure 5 clearly show the shape and size of AgNPs generated in each case of ablation.
To understand the distribution of ablated AgNPs between the two laser-ablated lines, FESEM images are divided into three regions for each ablated Ag–S [Figure 5b–d] target as surface morphology plays a crucial role in the SERS signals. Region I marked is close to the first ablated line, region II marked is in the middle of the two ablated lines on Ag–S, and region III marked close to the second ablated line.
It was observed that the density of AgNPs in regions I and III increases gradually after ablation with 25 and 50 μJ energies, and on the other hand, in region II, only few AgNPs could be seen in the case of 50 μJ. However, in the case of 100 μJ energy, the density of AgNPs over region II is maximum as compared to regions I and III as most part of regions I and III melted during laser ablation. The NP formation depends on the melt formed during femtosecond ablation and the redeposition of this melt after the pulses have left. Because the scanning speed utilized was 0.1 mm/s and the repetition rate being 1 kHz, there are several pulses interrogating the same area of the surface. If we assume a spot size of 50 μm (100 μm), the number of pulses hitting the same area will be 500 (1000). The interaction of this number of pulses with the melt and redistribution would have resulted in different morphologies of the NPs on the surface.
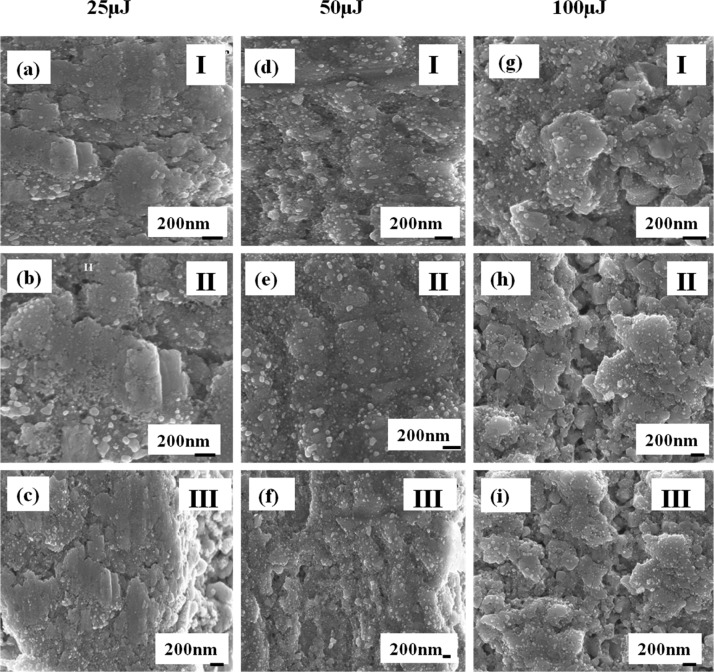
Figure 6 presents the FESEM images of regions I, II, and III on Ag–S ablated at 25, 50, and 100 μJ. It is also found that the size of the AgNPs increases with the increase in laser energy. The FESEM images were processed under ImageJ software. The average sizes of the AgNPs in region II (25, 50, and 100 μJ) are estimated to be 54, 59, and 62 nm.
Figure 6.
FESEM images of regions I, II, and III on AgNS ablated at 25 μJ (a) region I, (b) region II, and (c) region III; 50 μJ (d) region I, (e) region II, and (f) region III and 100 μJ (g) region I, (h) region II, and (i) region III.
2.2. Effect of Surface Morphology of the Ablated Ag–S
The surface morphology of the deposited laser-ablated NPs plays a vital role in the enhancement of the Raman signal of any analyte molecule in the SERS technique.42 The morphology of AgNPs can produce a giant electric field through the propagating surface plasmons on interaction with laser pulses at a particular wavelength. To understand the effect of different surface morphologies induced by laser ablation of different energies, Raman mappings were performed for all the samples (Figure S2). The Raman spectra of Ag–S and laser-ablated Ag–S at 25 μJ shows a group of bands in the range 700–1600 cm–1 region [Figure 7a]. The main vibrational bands were at 1579, 1377, and 997 cm–1 and are generally assigned to the silver–oxygen mode (AgO).43
Figure 7.
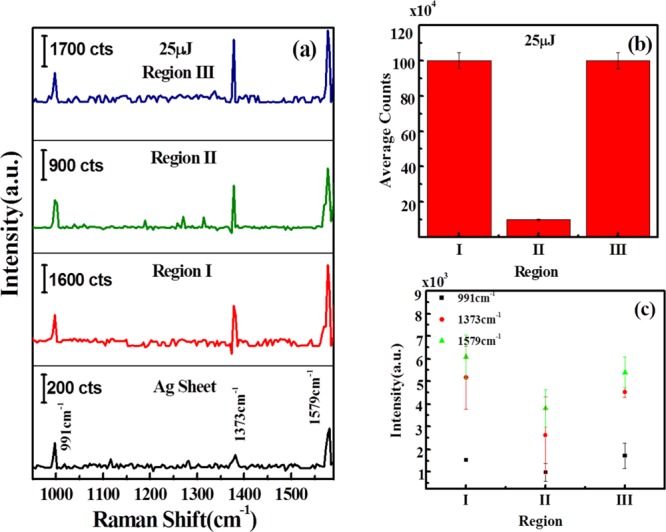
(a) Raman spectra of AgNPs, showing silver peaks on Ag sheet and variation of Ag peaks in regions I, II, and III on laser-ablated Ag–S obtained at 25 μJ of input laser energy; (b) variation of average intensity counts in regions I, II, and III on laser-ablated Ag–S; and (c) variation of intensities of 991, 1373, and 1579 cm–1 signature peaks of Ag–O at regions I, II, and III on laser-ablated Ag–S ablated at 25 μJ. “a.u.” stands for arbitrary units in the figure.
To measure the Raman intensities in different regions, we have chosen 30 × 30 μm2 area for each region between two laser-ablated lines. We have recorded the Raman spectra at 10 different spots in each region and the average intensities are plotted. Figure 7 shows that the Raman intensities vary between the regions which reflect the clear role of the surface morphology. In order to produce a clearer picture, specific peaks at 991, 1373, and 1579 cm–1, for Ag–S in Raman spectra, have been chosen from the mapped area and average intensities of these peaks in each region are plotted. Figure 7b shows the variation of average counts of AgNPs over laser-ablated Ag–S at 25 μJ of laser energy. It is found that average counts are high and almost similar at regions I and III, whereas in region II, the numbers of counts are very less as compared to regions I and III. Figure 7c depicts that the bands at 991, 1373, and 1579 cm–1 were chosen as the signature peaks of Ag–O on Ag–S. The intensity counts of these peaks were plotted at different regions, and it was found that the intensity of these peaks was higher at regions I and III as compared to region II. Similar plots have been obtained for Ag–S ablated at 50 and 100 μJ laser energies.
Figure 8 shows the Raman spectra of Ag–S ablated at 50 μJ. Figure 8a shows the Raman spectra of Ag–S ablated at 50 μJ of laser energy. Again, the three signature peaks of AgNPs have been observed at 991, 1373, and 1579 cm–1. Figure 8b illustrates the variation of intensity counts over laser-ablated Ag–S at 50 μJ of laser energy. It was found that the intensity counts are high and almost similar at regions I and III, whereas in region II, the number of AgNP intensity counts are very less as compared to regions I and III but more than as observed in the case of 25 μJ. Figure 8c depicts the variation of intensity counts of the signature peaks of AgNPs at 991, 1373, and 1579 cm–1.
Figure 8.
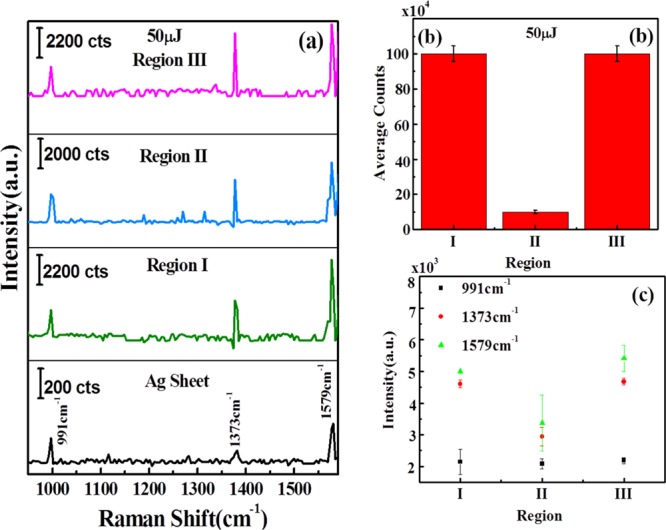
(a) Raman spectra of AgNPs, showing silver peaks on Ag sheet and variation of Ag peaks in regions I, II, and III on laser ablated Ag–S obtained at 50 μJ of input laser energy; (b) variation of average intensity counts in regions I, II, and III on laser-ablated Ag–S; and (c) variation of intensities of 991, 1373, and 1579 cm–1 signature peaks of Ag–O at regions I, II, and III on laser-ablated Ag–S ablated at 50 μJ. “a.u.” stands for arbitrary units in the figure.
Figure 9a shows the Raman spectra of Ag–S ablated at 100 μJ of input laser energy. Again, the three signature peaks of AgNPs were observed at 991, 1373, and 1579 cm–1. Figure 9b shows the variation of intensity counts over laser-ablated Ag–S at 100 μJ energy. It is evident that the intensity counts are almost similar in all regions I, II, and III. Figure 9c shows the variation of intensity counts of the signature peaks of AgNPs at 991, 1373, and 1579 cm–1. These results established that the surface morphology plays a significant role in enhancing the Raman signals. The above results indicate that regions I and III show similar behavior, and, therefore, instead of mentioning regions I and III, they will further be treated as region I.
Figure 9.
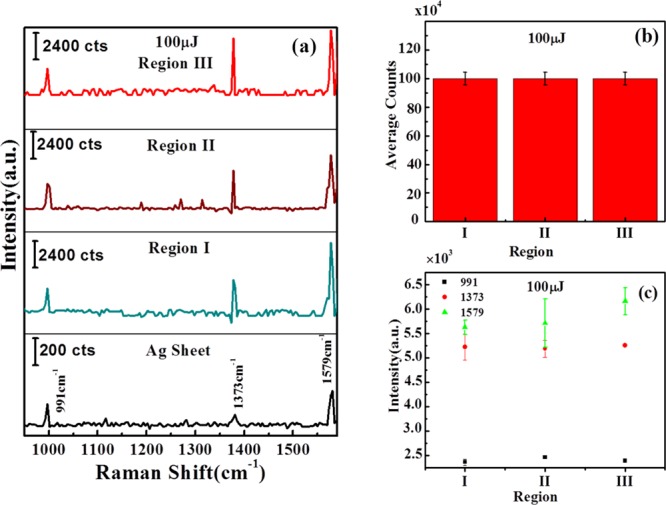
(a) Raman spectra of Ag–S, showing silver peaks on Ag sheet and variation of Ag peaks; (b) variation of average intensity counts in regions I, II, and III on laser-ablated Ag–S obtained at 100 μJ of input laser energy, and (c) variation of intensities of 991, 1373, and 1579 cm–1 signature peaks of silver NPs at regions I, II, and III on Ag–S ablated at 100 μJ. “a.u.” stands for arbitrary units in the figure.
The above experimental SERS results clearly proved that the morphology of the laser-ablated regions of silver plays a crucial role on the Raman signals. Because the ablation was performed in ambient air, the energy-dependent ablation has resulted in a nonuniform distribution of the AgNPs on the surface (with varying sizes, numbers, and shapes) depend on the region of observation. The groove formed due to ablation can also be used for SERS studies, but the depth did not permit us in recording the Raman spectra. Regions I and III seem to have similar morphologies (sizes and numbers) for energies up to 50 μJ. However, for the 100 μJ case, the enhancement was found to be uniform across the regions. This is a significant result because the number of “hotspots” generated will be different in each case. Assuming that the generated NPs are hemispherical in nature, the sizes and the distances between these NPs (density) will influence the Raman signal. Therefore, by varying the input energy, one could obtain, in principle, a variety of morphologies with different-sized NPs and densities, which in turn results in different enhancements. This NP formation on the surface is unique to femtosecond pulse ablation unlike in nanosecond ablation where the heat-affected zones are prominent and the longer pulse results in physical melting (no NP formation). Further, performing the ablation in a liquid will create a different morphology and will be investigated in our future studies.
2.3. GO Synthesis
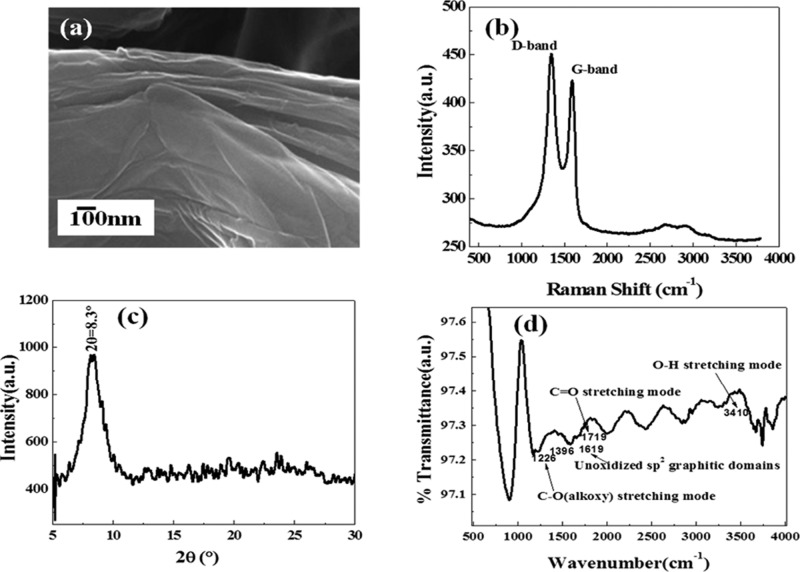
The synthesized GO was characterized by different techniques such as FESEM, Raman spectroscopy, XRD, and FTIR spectroscopy. Figure 10a illustrates the FESEM image of GO which indicates the exfoliation of GO in layered form.
Figure 10.
(a) FESEM image, (b) Raman spectra, (c) XRD, and (d) FTIR spectra of GO.
Figure 10d shows the FTIR spectra of GO, which gives the functional groups of GO as discussed in various literature studies and hence confirms the well-synthesized form of GO. Figure 10b depicts the Raman spectra of GO which shows the signature peaks of GO at 1350 and 1590 cm–1. These peaks are named D band and G band. The D band is assigned to the disordered band responsible for the structural defects and dangling sp2 carbon bonds, whereas the G peak is due to the in-plane stretching motion between sp2 carbon atoms. Figure 10b illustrates the 2D band of GO between 2500 and 3000 cm–1, which shows two lumps indicating two layers of graphene in GO.5 In Figure 10b, the intensity of the D band is higher than that of G band, which is due to the disruption of sp2 bonds of carbon as GO has oxidative functional groups. Figure 10c shows the XRD spectra of GO, which indicates the sharp peak of GO at 2θ = 8.3°, which confirms the formation of GO. Further, the AFM studies were performed to verify the thickness of GO. The thickness of each graphene layer was found to be around 2.4 nm, which is slightly higher because of the presence of oxygen functional groups. Further, the intensity ratio for (ID/IG) is found to be 1.1 and full width at half-maximum for D and G bands are found to be 159 and 85, respectively. Further, the synthesized GO was spin-coated on the surface of laser-ablated Ag–S.
2.4. SERS Measurements
Laser-textured silver/GO (AgNP/GO) hybrid has been used as a substrate for analyte detection. We have chosen 2,4-DNT as an explosive marker molecule to investigate the performance of the developed SERS-active substrate using a range of solution concentrations (10–6, 10–9, and 10–12 M). 2,4-DNT is a marker molecule for the explosive trinitrotoluene and, hence, the material of choice in the present study. Besides, it is also used as a nitroaromatic explosive and has a low vapor pressure; therefore, its detection at low concentration is of utmost importance.
Figure 11 shows the SERS spectra of 2,4-DNT on AgNP/GO at 25 μJ at 10–12 M concentration. 2,4-DNT is an explosive compound which can be used as a marker for land mine detection. The observed Raman bands at 791, 866, and 911 cm–1 correspond to the stretching modes of NO2, whereas the band at 1130 cm–1 is assigned to the H–C–H asymmetric bending movement. The vibrational mode assigned to the H–C–C in-plane bending movement appears at 1202 cm–1, two bands at 1353 and 1573 cm–1 correspond to the D and G bands of GO, and are found to be matching with the reported peaks in the literature.44−47
Figure 11.
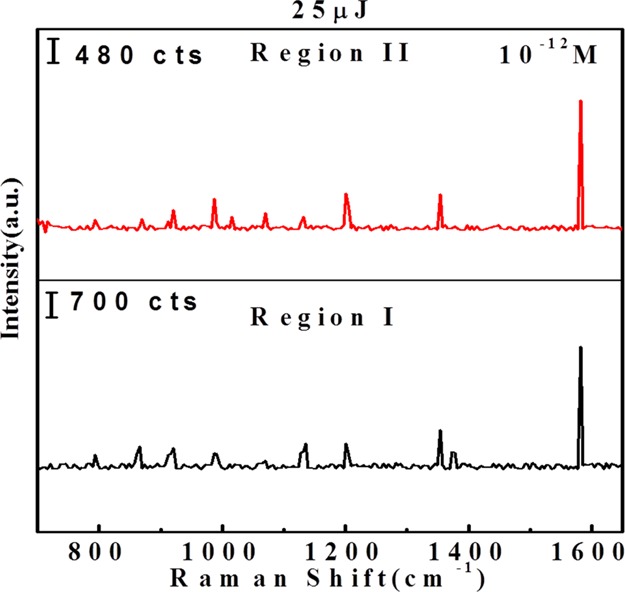
SERS spectra of AgNP/GO ablated at 25 μJ laser energy with 10–12 M concentration of 2,4-DNT. a.u. refers to arbitrary units in the Y-axis. “a.u.” stands for arbitrary units in the figure.
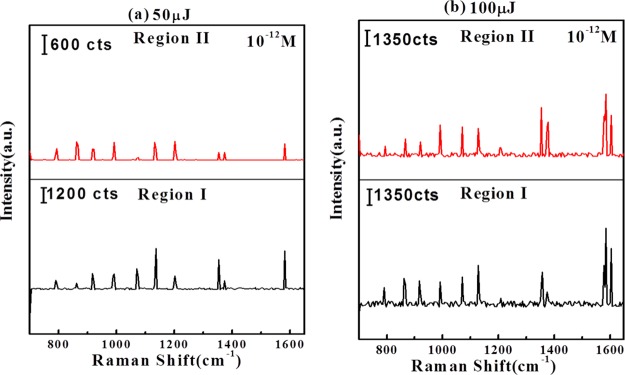
Figure 12 shows the Raman spectra of 2,4-DNT on AgNP/GO composite at (a) 50 and (b) 100 μJ laser energies. Similar signature peaks have been observed at 50 and 100 μJ.
Figure 12.
SERS spectra of AgNP/GO ablated at (a) 50 and (b) 100 μJ laser energy with 10–12 M concentration of 2,4-DNT. “a.u.” stands for arbitrary units in the figure.
To check the reproducibility of the substrate and to compensate the thickness and defect variations on AgNP/GO substrate area due to spin coating, the intensity ratio (I/ID) of the 866 cm–1 peak, where I is the intensity of 866 cm–1 band and ID is the intensity of the D band on AgNP/GO substrate, was calculated. The intensities I and ID were calculated by averaging 10 different spots on the AgNP/GO substrate. The variation of I/ID ratio is plotted against different concentrations of 2,4-DNT (Figure S3), which indicates the linear dependence of I/ID on concentrations.
Figure 13a–c shows the variation of intensities of 866, 791, and 911 cm–1 peaks of 2,4-DNT in regions I and II on AgNP/GO hybrid ablated at 25, 50, and 100 μJ laser energies. Figure 13d shows the variation of intensity versus energy of the laser of 866 cm–1 peak of 2,4-DNT in regions I and II. It demonstrates a linear increase in intensities with an increase in laser energy.
Figure 13.
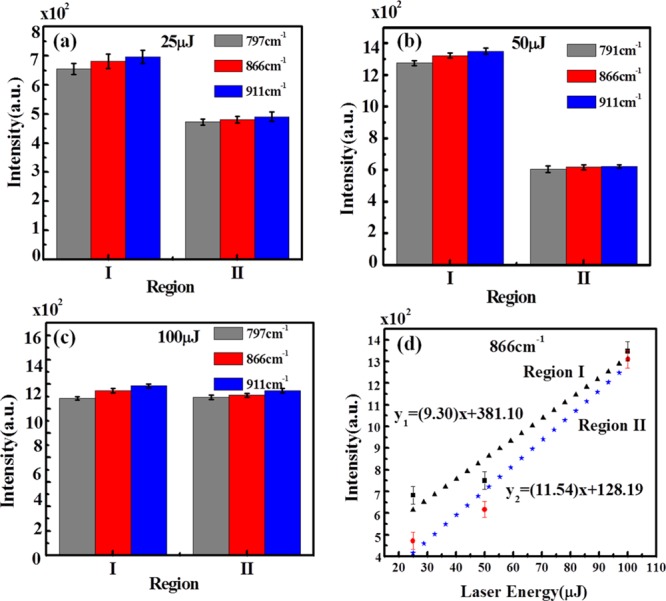
Variation of intensities of 866, 791, and 911 cm–1 peaks of 2,4-DNT at regions I and II on AgNP/GO ablated at (a) 25, (b) 50, and (c) 100 μJ laser energy and (d) variation of intensities vs laser energy of 866 cm–1 peak at regions I and II.
It is also observed that the intensity of 866 cm–1 peak in region II of AgNP/GO is equally high at 100 μJ of laser energy. It shows that the AgNP/GO substrate acts as a good sensor with pM detection limit with good reproducibility. The other peaks at 791, 911, 1130, and 1202 cm–1 demonstrate a similar behavior as shown by 866 cm–1 peak. It is interesting to note that at 100 μJ, the SERS intensity from 2,4-DNT is almost equal for regions I and III, indicating the disappearance of region II because of deposition of AgNPs far away from the ablation region. This observation is supported by the FESEM image of 50 and 100 μJ samples (Figure 5), as well as from Figure 9b, which demonstrates the variation of average intensity counts in regions I, II, and III on laser-ablated Ag–S at 100 μJ. This suggests that the appropriate size of the AgNPs can be achieved for energies up to 100 μJ and no further ablation is necessary to get AgNPs of required size. Further, increasing the laser energy, AgNPs produced will be larger in size, which may not be useful for the plasmon resonance condition, necessary for LSPR generation in SERS measurements.
2.5. Analytical Enhancement Factors
To check the performance of the well-fabricated AgNP/GO substrate, the average enhancement factor (AEF) has been calculated for 2,4-DNT. The AEF in SERS Raman spectra was calculated using the following equation
| 1 |
where ISERS is the SERS band intensity of 2,4-DNT using the synthesized AgNP/GO substrate, IR is the Raman intensity of an analyte on a glass slide (without using substrate), CSERS represents the corresponding concentration of an analyte on a substrate (10–12 M), and CR is the concentration of an analyte on a glass slide (10–3 M, without substrate), which produces the Raman signal, IR. The calculated AEF values for 2,4-DNT on AgNP/GO substrate at 25, 50, and 100 μJ in regions I and II are found to be 1.10 × 10¹⁰, 2.14 × 10¹⁰, and 2.18 × 10¹⁰ and 7.79 × 10⁹, 1.15 × 10¹⁰, and 2.12 × 10¹⁰ (866 cm–1 peak), respectively. The comparative enhancement factors of regions I and II are shown in the histogram given in Figure 14. As discussed earlier, because of deposition of AgNPs far away from the actual ablation region, there is hardly any difference in the enhancement factor for structures obtained at 100 μJ. Our SERS measurements clearly indicate that the hierarchical laser-patterned AgNP/GO substrate can detect 2,4-DNT at significantly low concentrations of 10–12 M.
Figure 14.
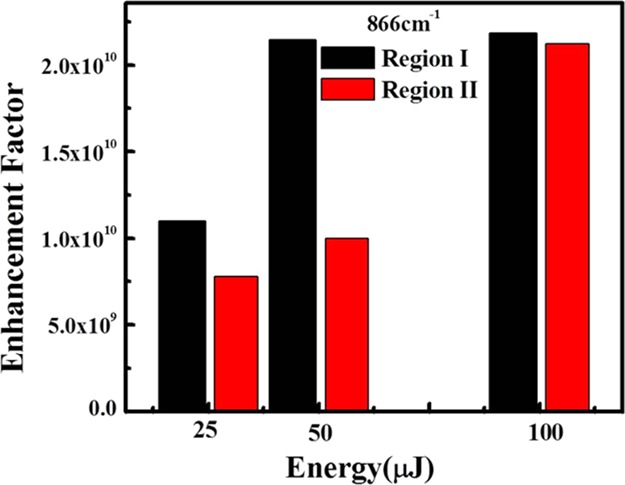
Comparison of the enhancement factors of 2,4-DNT on AgNP/GO substrate obtained at three different laser energies of 25, 50, and 100 μJ in regions I and II of the substrate.
The higher detection limit of the developed AgNP/GO substrate may be due to the good interaction of the 2,4-DNT molecules electromagnetically as well as chemically. Further, to check the effect of spreading area on the silver sheet, we recorded the Raman spectra of 2,4-DNT on Ag–S keeping the same protocols as taken on the glass slide (i.e., volume: 2 μL of 10–3 M 2,4-DNT solution). The Raman intensities were obtained by averaging data from 10 different spots over the surface of Ag–S and AgNP/GO hybrid, and the cross-sectional area of laser spot was ∼500 nm. Further, the Raman spectra of Ag–S and glass slide were compared and the enhancement factor was calculated. The Raman spectra of 2,4-DNT were recorded on plain Ag–S with and without GO and compared with the Raman spectra of 2,4-DNT on AgNP/GO substrate at regions I and II ablated at 25, 50, and 100 μJ of laser energy (Figure S4).
Table S1 (given in the Supporting Information) summarizes the enhancement factors calculated on plain Ag–S and plain glass sheet. As shown in Table S1, it was found that the enhancement factor on Ag–S is 1 order of magnitude lower than that on the glass slide. The difference in the enhancement factors may be due to the difference in the spreading areas on different substrates. Further, the performance of the AgNP/GO hybrid substrate fabricated by laser ablation for explosive marker detection (2,4-DNT) has been evaluated with earlier reported SERS substrates fabricated by various approaches. We have compared different SERS substrates with their enhancement factors, as shown in Table S2 (given in the Supporting Information). The enhancement factor achieved by other authors was in the range of 105 to 108. However, the enhancement factor achieved by our substrate is found to be ∼109, which is comparable or even superior to the other reported literature.2,32,48−50 Furthermore, we have repeated the SERS experiment on the same substrate at different intervals of time (as prepared, after 2 weeks, and finally after 1 month) and did not find significant changes in the Raman intensity of the 2,4-DNT molecules investigated. This clearly indicates that the stability of the developed sensor is quite good.
3. Conclusions
In the present work, we have fabricated and demonstrated a generic SERS sensor based on a hierarchical laser-patterned AgNP/GO hybrid structure to detect 2,4-DNT molecules successfully. Ag sheet has been ablated by a femtosecond laser at three different laser energies, 25, 50, and 100 μJ, to fabricate and deposit AgNPs along the ablated trench, which were later successfully incorporated with GO to form the AgNP/GO hybrid structure. The fabricated AgNP/GO hybrid behaves as an extremely sensitive SERS substrate for the detection of 2,4-DNT analyte with three different concentrations in the picomolar range. The calculated AEF values for 2,4-DNT on AgNP/GO substrate at 25, 50, and 100 μJ in regions I and II are found to be 1.10 × 10¹⁰, 2.14 × 10¹⁰, and 2.18 × 10¹⁰ and 7.79 × 10⁹, 1.15 × 10¹⁰, and 2.12 × 10¹⁰ (866 cm–1 peak), respectively. We have compared the enhancement factor of 2,4-DNT on Ag–S with a glass slide on the AgNP/GO hybrid. The enhancement factors at regions I and II on Ag–S are 2.74 × 10⁹ and 1.93 × 10⁹; 5.31 × 10⁹ and 2.47 × 10⁹; and 5.41 × 10⁹ and 5.26 × 10⁹ for 25 μJ, for 50, and 100 μJ, respectively, calculated for 866 cm–1 peak. It was found that the enhancement factor on Ag–S is 1 order of magnitude less than that on the glass slide.
The AgNP/GO hybrid substrate demonstrated a remarkable enhancement in the SERS intensity even at ultralow analyte concentration. The generic SERS sensor thus fabricated has immense potential to be used as a portable explosive detector, owing to its sensing specificity and sensitivity.
4. Experimental Section
4.1. Materials Used
All the chemicals and reagents used in our study are of AR grade. Ag target (Ag–S) of 1 mm thickness (≥99% pure), pristine graphite powder, and 2,4-DNT were purchased from Sigma-Aldrich, and concentrated sulfuric acid (H2SO4), potassium permanganate (KMnO4), and hydrogen peroxide (H2O2) were procured from Samir Tech, India. The chemicals and reagents used in this work were used as received without any further treatment. Deionized water was used for the SERS sample preparation and cleaning purposes throughout all the experiments.
4.2. Laser Ablation of the Silver Sheet (Ag–S)
AgNPs were produced through the laser ablation using a femtosecond (fs) laser amplifier (Ti:sapphire, LIBRA, Coherent) delivering ∼50 fs pulses with a repetition rate of 1 kHz with a central wavelength of 800 nm. The laser beam was focused using a convex lens of 100 mm focal length at normal incidence onto the bulk silver target (Ag–S, 5 × 5 mm2) in ambient air. A computer-controlled motorized XY stage was used to translate the sample along X- and Y-directions with the speed of 0.1 mm/s and with the step size of 0.1 mm. The laser ablation experiments were performed with three different pulse energies of 25, 50, and 100 μJ to understand the role of laser energy in ablation process. In all the cases, the typical ablation time was ∼30 min. Further, AgNPs fabricated onto Ag–S by laser ablation were investigated using FESEM and AFM for evaluating the surface morphology. Selected area Raman mapping was performed to understand the distribution of AgNPs on Ag–S before using them for SERS substrate preparation.
4.3. Synthesis of GO
GO used in this work was synthesized using simple Hummer’s method.16 The details of the synthesis process are provided in our previous work.50 Further, synthesized GO was characterized by using FESEM, XRD, FTIR, and HRTEM techniques before using it for SERS substrate preparation.
4.4. Instrumentation
Surface morphology images of the AgNPs were obtained using FESEM with a Supra 40 VP, Carl Zeiss, attached with an energy-dispersive X-ray microanalyzer (OXFORD EDAX). Surface roughness was measured using an atomic force microscope, Asylum Research, MFP-3D origin, operated at a drive frequency of 137.9 kHz in 2 μm scan size at a scan rate of 0.88 Hz. XRD spectra of synthesized GO were recorded on an X-ray diffractometer (45 kV, 40 mA) (X’pert PRO from PANalytical, Netherlands) with Cu Kα radiation (μ = 1.5418 Å) in the 2θ range of 5°–90° at a scanning rate of 2° min–1. FTIR spectra were recorded with a PerkinElmer, USA FTIR microscope to investigate the functional groups present in GO. The SERS Raman intensity of Ag–S, AgNPs, and 2,4-DNT explosive marker was recorded with a Raman spectrometer (WiTec CRM 2000 Raman spectrometer, Germany), attached with a He–Ne laser excitation source (wavelength of 532 nm, focused via a 20×, 0.4 NA microscope objective). The integration time and spectral resolution for all the samples were kept at 5 s and 1 cm–1, respectively, to reduce the signal-to-noise ratio and improve the spectral quality. Raman mapping was performed on the 90 × 90 μm2 area with a scanning speed of 0.1 s/pixel, and 225 pixels were scanned in a line. Three sets/batches of the substrate were prepared to check the reproducibility of the results for 2,4-DNT explosive marker. The SERS Raman intensity measurements were done on 10 different spots across the prepared substrate.
4.5. Sample Preparation for SERS Substrate
The amount of GO was optimized at 2.5 mg (complete details are provided in our previous work) to get the uniform and homogeneous distribution of GO on laser-ablated nanostructures.50 Different concentrations (10–3, 10–6, 10–9, and 10–12 M) of 2,4-DNT solutions were prepared in 10 mL of ethanol. Further, GO solution was prepared in 10 mL of ethanol. The prepared GO solution (10 μL) was then spin-coated onto precleaned Ag–S ablated at three different laser energies (25, 50, and 100 μJ) at 500 rpm for 20 s. The AgNP/GO spin-coated substrate was dried for 10 minutes on a hot plate kept at 50 °C. Different concentrations of 2,4-DNT (2 μL) were then spin-coated on the surface of the AgNP/GO substrate at 500 rpm for 20 s and then the solvent was allowed to evaporate at room temperature for adsorption. Spin coating the solution leads to a uniform distribution of 2,4-DNT because of very fast and uniform evaporation of solvent on the surface of the AgNP/GO SERS substrate. The SERS spectra acquisition was started immediately after evaporation of the solvent.
Acknowledgments
The authors would like to thank DMSRDE, Kanpur, India, for their support for this work via their project TR/0569/DRM 557/CARS 106, P.K.D. and M.M.K. thank Nano Mission, DST, New Delhi, for supporting the ongoing work at the Center for Nanosciences. The authors thank Chandu Byram (ACRHEM) and Dr. Seema Sharma (CNS, IIT Kanpur) for supporting in laser ablation experiments and Raman experiments, respectively. S.V.R. thanks DRDO for financial support through ACRHEM. (Project sanction no. ERIP/ER/1501138/M/01/319/D(R&D) dated 27.02.2017.)
Supporting Information Available
The Supporting Information is available free of charge on the ACS Publications website at DOI: 10.1021/acsomega.9b01975.
AFM image of Ag–S, Raman mapping of AgNP/GO, thickness estimation of GO by AFM, variation of I/ID ratio with different concentrations of 2,4-DNT, Raman spectra of 2,4-DNT on Ag-NP/GO substrate, calculation of enhancement factors on Ag–S and Ag–S/GO hybrids, and comparison of enhancement factors of Ag–S/GO hybrids with different substrates (PDF)
The authors declare no competing financial interest.
Supplementary Material
References
- Wang F.; Cao S.; Yan R.; Wang Z.; Wang D.; Yang H. Selectivity/Specificity Improvement Strategies in Surface-Enhanced Raman Spectroscopy Analysis. Sensors 2017, 17, 2689. 10.3390/s17122719. [DOI] [PMC free article] [PubMed] [Google Scholar]
- Sree Satya Bharati M.; Byram C.; Soma V. R. Femtosecond Laser Fabricated Ag@ Au and Cu@ Au Alloy Nanoparticles for Surface Enhanced Raman Spectroscopy Based Trace Explosives Detection. Front. Phys. 2018, 6, 28. 10.3389/fphy.2018.00028. [DOI] [Google Scholar]
- Liu Z.; Yu S.; Xu S.; Zhao B.; Xu W. Ultrasensitive Detection of Capsaicin in Oil for Fast Identification of Illegal Cooking Oil by SERRS. ACS Omega 2017, 2, 8401–8406. 10.1021/acsomega.7b01457. [DOI] [PMC free article] [PubMed] [Google Scholar]
- Deng R.; Qu H.; Liang L.; Zhang J.; Zhang B.; Huang D.; Xu S.; Liang C.; Xu W. Tracing the Therapeutic Process of Targeted Aptamer/Drug Conjugate on Cancer Cells by Surface-Enhanced Raman Scattering Spectroscopy. Anal. Chem. 2017, 89, 2844–2851. 10.1021/acs.analchem.6b03971. [DOI] [PubMed] [Google Scholar]
- Ben-Jaber S.; Peveler W. J.; Quesada-Cabrera R.; Cortés E.; Sotelo-Vazquez C.; Abdul-Karim N.; Maier S. A.; Parkin I. P. Photo-induced enhanced Raman spectroscopy for universal ultra-trace detection of explosives, pollutants and biomolecules. Nat. Commun. 2016, 7, 12189. 10.1038/ncomms12189. [DOI] [PMC free article] [PubMed] [Google Scholar]
- Zhu S.; Fan C.; Wang J.; He J.; Liang E. Surface-enhanced Raman scattering of 4-mercaptobenzoic acid and hemoglobin adsorbed on self-assembled Ag monolayer films with different shapes. Appl. Phys. A 2014, 117, 1075–1083. 10.1007/s00339-014-8548-3. [DOI] [Google Scholar]
- Muehlethaler C.; Leona M.; Lombardi J. R. Review of Surface Enhanced Raman Scattering Applications in Forensic Science. Anal. Chem. 2016, 88, 152–169. 10.1021/acs.analchem.5b04131. [DOI] [PubMed] [Google Scholar]
- Moskovits M. Surface-enhanced spectroscopy. Rev. Mod. Phys. 1985, 57, 783–826. 10.1103/revmodphys.57.783. [DOI] [Google Scholar]
- Xu H.; Aizpurua J.; Käll M.; Apell P. Electromagnetic contributions tosingle-molecule sensitivity in surface-enhanced raman scattering. Phys. Rev. E: Stat. Phys., Plasmas, Fluids, Relat. Interdiscip. Top. 2000, 62, 4318–4324. 10.1103/physreve.62.4318. [DOI] [PubMed] [Google Scholar]
- Yu X.; Cai H.; Zhang W.; Li X.; Pan N.; Luo Y.; Wang X.; Hou J. G. Tuning chemicalenhancement of SERS by controlling the chemical reduction of grapheneoxide nanosheets. ACS Nano 2011, 5, 952–958. 10.1021/nn102291j. [DOI] [PubMed] [Google Scholar]
- Zhang X.; Xu S.; Jiang S.; Wang J.; Wei J.; Xu S.; Gao S.; Liu H.; Qiu H.; Li Z.; Liu H.; Li Z.; Li H. Growth graphene on silver-copper nanoparticles by chemical vapor deposition for high-performance surface-enhanced Raman scattering. Appl. Surf. Sci. 2015, 353, 63–70. 10.1016/j.apsusc.2015.06.084. [DOI] [Google Scholar]
- Zhang C.; Jiang S. Z.; Huo Y. Y.; Liu A. H.; Xu S. C.; Liu X. Y.; Sun Z. C.; Xu Y. Y.; Li Z.; Man B. Y. SERS detection of R6G based on a novel graphene oxide/silver nanoparticles/silicon pyramid arrays structure. Opt. Express 2015, 23, 24811–24821. 10.1364/oe.23.024811. [DOI] [PubMed] [Google Scholar]
- Qiu H. W.; Xu S. C.; Chen P. X.; Gao S. S.; Li Z.; Zhang C.; Jiang S. Z.; Liu M.; Li H. S.; Feng D. J. A novel surface-enhanced Raman spectroscopy substrate based on hybrid structure of monolayer graphene and Cu nanoparticles for adenosine detection. Appl. Surf. Sci. 2015, 332, 614–619. 10.1016/j.apsusc.2015.01.231. [DOI] [Google Scholar]
- Xu S.; Jiang S.; Wang J.; Wei J.; Yue W.; Ma Y. Graphene isolated Au nanoparticle arrays with high reproducibility for high-performance surface-enhanced Raman scattering. Sens. Actuators, B 2016, 222, 1175–1183. 10.1016/j.snb.2015.08.009. [DOI] [Google Scholar]
- Yang C.; Zhang C.; Huo Y.; Jiang S.; Qiu H.; Xu Y.; Li X.; Man B. Shell-isolated graphene@Cu nanoparticles on graphene@Cu substrates for the application in SERS. Carbon 2016, 98, 526–533. 10.1016/j.carbon.2015.11.042. [DOI] [Google Scholar]
- Xu S.; Man B.; Jiang S.; Wang J.; Wei J.; Xu S.; Liu H.; Gao S.; Liu H.; Li Z.; Li H.; Qiu H. Graphene/Cu nanoparticle hybrids fabricated by chemical vapor deposition as surface-enhanced Raman scattering substrate for label-free detection of adenosine. ACS Appl. Mater. Interfaces 2015, 7, 10977–10987. 10.1021/acsami.5b02303. [DOI] [PubMed] [Google Scholar]
- Xu S.; Zhan J.; Man B.; Jiang S.; Yue W.; Gao S.; Guo C.; Liu H.; Li Z.; Wang J. Real-time reliable determination of binding kinetics of DNA hybridization using a multi-channel graphene biosensor. Nat. Commun. 2017, 8, 14902. 10.1038/ncomms14902. [DOI] [PMC free article] [PubMed] [Google Scholar]
- Xu S.; Wang J.; Zou Y.; Liu H.; Wang G.; Zhang X.; Jiang S.; Li Z.; Cao D.; Tang R. High performance SERS active substrates fabricated by directly growing graphene on Ag nanoparticles. RSC Adv. 2015, 5, 90457–90465. 10.1039/c5ra18333b. [DOI] [Google Scholar]
- Yang W.; Li Z.; Lu H.; Yu J.; Huo Y.; Man B.; Pan J.; Si H.; Jiang S.; Zhang C. Graphene-Ag nanoparticles-cicada wings hybrid system for obvious SERS performance and DNA molecular detection. Opt. Express 2019, 27, 3000–3013. 10.1364/oe.27.003000. [DOI] [PubMed] [Google Scholar]
- Li Y.; Zhao X.; Zhang P.; Ning J.; Li J.; Su Z.; Wei G. A facile fabrication of large-scale reduced graphene oxide-silver nanoparticle hybrid film as a highly active surface-enhanced Raman scattering substrate. J. Mater. Chem. C 2015, 3, 4126–4133. 10.1039/c5tc00196j. [DOI] [Google Scholar]
- Hsu K.-C.; Chen D.-H. Microwave-assisted green synthesis of Ag/reduced graphene oxide nanocomposite as a surface-enhanced Raman scattering substrate with high uniformity. Nanoscale Res. Lett. 2014, 9, 193. 10.1186/1556-276x-9-193. [DOI] [PMC free article] [PubMed] [Google Scholar]
- Murphy S.; Huang L.; Kamat P. V. Reduced graphene oxide-silver nanoparticle composite as an active SERS material. J. Phys. Chem. C 2013, 117, 4740–4747. 10.1021/jp3108528. [DOI] [Google Scholar]
- Dutta S.; Ray C.; Sarkar S.; Pradhan M.; Negishi Y.; Pal T. Silver nanoparticle decorated reduced graphene oxide (rGO) nanosheet: a platform for SERS based low-level detection of uranyl ion. ACS Appl. Mater. Interfaces 2013, 5, 8724–8732. 10.1021/am4025017. [DOI] [PubMed] [Google Scholar]
- Lee B.-S.; Lin D.-Z.; Yen T.-J. A Low-cost, Highly-stable Surface Enhanced Raman Scattering Substrate by Si Nanowire Arrays Decorated with Au Nanoparticles and Au Backplate. Sci. Rep. 2017, 7, 4604. 10.1038/s41598-017-04062-4. [DOI] [PMC free article] [PubMed] [Google Scholar]
- Hostetler M. J.; Murray R. W. Colloids and self-assembled monolayers. Colloid Interface Sci. 1997, 2, 42–50. 10.1016/s1359-0294(97)80007-6. [DOI] [Google Scholar]
- Liu D.; Wang Q.; Hu J. Fabrication and characterization of highly ordered Au nanocone array-patterned glass with enhanced SERS and hydrophobicity. Appl. Surf. Sci. 2015, 356, 364–369. 10.1016/j.apsusc.2015.08.096. [DOI] [Google Scholar]
- Fan M.; Brolo A. G. Silver nanoparticles self assembly as SERS substrates with near single molecule detection limit. Phys. Chem. Chem. Phys. 2009, 11, 7381–7389. 10.1039/b904744a. [DOI] [PubMed] [Google Scholar]
- Li X.; Hu H.; Li D.; Shen Z.; Xiong Q.; Li S.; Fan H. J. Ordered array of gold semishells on TiO2spheres: an ultrasensitive and recyclable SERS substrate. ACS Appl. Mater. Interfaces 2012, 4, 2180–2185. 10.1021/am300189n. [DOI] [PubMed] [Google Scholar]
- Abu Hatab N. A.; Oran J. M.; Sepaniak M. J. Surface-enhanced Raman spectroscopy substrates created via electron beam lithography and nanotransfer printing. ACS Nano 2008, 2, 377–385. 10.1021/nn7003487. [DOI] [PubMed] [Google Scholar]
- Wu H.-Y.; Choi C. J.; Cunningham B. T. Plasmonic nanogap-enhanced Raman scattering using a resonant nanodome array. Small 2012, 8, 2878–2885. 10.1002/smll.201200712. [DOI] [PubMed] [Google Scholar]
- Dinish U. S.; Yaw F. C.; Agarwal A.; Olivo M. Development of highly reproducible nanogap SERS substrates: comparative performance analysis and its application for glucose sensing. Biosens. Bioelectron. 2011, 26, 1987–1992. 10.1016/j.bios.2010.08.069. [DOI] [PubMed] [Google Scholar]
- Byram C.; Soma V. R. 2,4-dinitrotoluene detected using portable Raman spectrometer and femtosecond laser fabricated Au–Ag nanoparticles and nanostructures. Nano-Struct. Nano-Objects 2017, 12, 121–129. 10.1016/j.nanoso.2017.09.019. [DOI] [Google Scholar]
- Zhang C.; Lin K.; Huang Y.; Zhang J. Graphene-Ag Hybrids on Laser-Textured Si Surface for SERS Detection. Sensors 2017, 17, 1462. 10.3390/s17071462. [DOI] [PMC free article] [PubMed] [Google Scholar]
- Han B.; Zhang Y.-L.; Zhu L.; Chen X.-H.; Ma Z.-C.; Zhang X.-L.; Wang J.-N.; Wang W.; Liu Y.-Q.; Chen Q.-D.; Sun H.-B. Direct laser scribing of AgNps@ RGO biochip as a reusable SERS sensor for DNA detection. Sens. Actuators, B 2018, 270, 500–507. 10.1016/j.snb.2018.05.043. [DOI] [Google Scholar]
- Ma Z.-C.; Zhang Y.-L.; Han B.; Chen Q.-D.; Sun H.-B. Femtosecond-Laser Direct Writing of Metallic Micro/Nanostructures: From Fabrication Strategies to Future Applications. Small Methods 2018, 2, 1700413. 10.1002/smtd.201700413. [DOI] [Google Scholar]
- Yan Z.-X.; Zhang Y.-L.; Wang W.; Fu X.-Y.; Jiang H.-B.; Liu Y.-Q.; Verma P.; Kawata S.; Sun H.-B. Superhydrophobic SERS substrates based on silver-coated reduced graphene oxide gratings prepared by two-beam laser interference. ACS Appl. Mater. Interfaces 2015, 7, 27059–27065. 10.1021/acsami.5b09128. [DOI] [PubMed] [Google Scholar]
- Lu Z.; Si H.; Li Z.; Yu J.; Liu Y.; Feng D.; Zhang C.; Yang W.; Man B.; Jiang S. Sensitive, reproducible and stable 3D plasmonic hybridswith bilayer WS2 as nanospacer for SERS analysis. Opt. Express 2018, 26, 21626–21641. 10.1364/oe.26.021626. [DOI] [PubMed] [Google Scholar]
- Li Z.; Xu S. C.; Zhang C.; Liu X. Y.; Gao S. S.; Hu L. T.; Guo J.; Ma Y.; Jiang S. Z.; Si H. P. High-performance SERS substrate based on hybrid structure of graphene oxide/AgNPs/Cu film@pyramid Si. Sci. Rep. 2016, 6, 38539. 10.1038/srep38539. [DOI] [PMC free article] [PubMed] [Google Scholar]
- Byram C.; Moram S. S. B.; Shaik A. K.; Soma V. R. Versatile gold based SERS substrates fabricated by ultrafast laser ablation for sensing picric acid and ammonium nitrate. Chem. Phys. Lett. 2017, 685, 103–107. 10.1016/j.cplett.2017.07.043. [DOI] [Google Scholar]
- Bao H.; Wang Y.; Zhang H.; Zhao Q.; Liu G.; Cai W. Ultrathin tin oxide layer-wrapped gold nanoparticles induced by laser ablation in solutions and their enhanced performances. J. Colloid Interface Sci. 2017, 489, 92–99. 10.1016/j.jcis.2016.08.065. [DOI] [PubMed] [Google Scholar]
- Dell’Aglio M.; Gaudiuso R.; De Pascale O.; De Giacomo A. Mechanisms and processes of pulsed laser ablation in liquids during nanoparticle production. Appl. Surf. Sci. 2015, 348, 4–9. 10.1016/j.apsusc.2015.01.082. [DOI] [Google Scholar]
- Byram C.; Moram S. S. B.; Soma V. R. SERS based detection of multiple analytes from dye/explosive mixtures using picosecond laser fabricated gold nanoparticles and nanostructuress. Analyst 2019, 144, 2327–2336. 10.1039/c8an01276h. [DOI] [PubMed] [Google Scholar]
- Naja G.; Bouvrette P.; Hrapovic S.; Luong J. H. T. Raman-based detection of bacteria using silver nanoparticles conjugated with antibodies. Analyst 2007, 132, 679–686. 10.1039/b701160a. [DOI] [PubMed] [Google Scholar]
- Fierro-Mercado P. M.; Hernández-Rivera S. P. Highly sensitive filter paper substrate for SERS trace explosives detection. Int. J. Spectrosc. 2012, 2012, 1–7. 10.1155/2012/716527. [DOI] [Google Scholar]
- Ben-Jaber S.; Peveler W. J.; Quesada-Cabrera R.; Sol C. W. O.; Papakonstantinou I.; Parkin I. P. Sensitive and specific detection of explosives in solution and vapour by surface – enhanced Raman spectroscopy on silver nanocubes. Nanoscale 2017, 9, 16459–16466. 10.1039/c7nr05057g. [DOI] [PubMed] [Google Scholar]
- Zhang C.-Y.; Hao R.; Zhao B.; Fu Y.; Zhang H.; Moeendarbari S.; Pickering C. S.; Hao Y.-W.; Liu Y.-Q. Graphene oxide-wrapped flower-like sliver particles for surface-enhanced Raman spectroscopy and their applications in polychlorinated biphenyls detection. Appl. Surf. Sci. 2017, 400, 49–56. 10.1016/j.apsusc.2016.12.161. [DOI] [Google Scholar]
- Dutta S.; Ray C.; Sarkar S.; Pradhan M.; Negishi Y.; Pal T. Silver nanoparticle decorated reduced graphene oxide (rGO) nanosheet: a platform for SERS based low-level detection of uranyl ion. ACS Appl. Mater. Interfaces 2013, 5, 8724–8732. 10.1021/am4025017. [DOI] [PubMed] [Google Scholar]
- Xu J. Y.; Wang J.; Kong L. T.; Zheng G. C.; Guo Z.; Liu J. H. SERS detection of explosive agent by macrocyclic compound functionalized triangular gold nanoprisms. J. Raman Spectrosc. 2011, 42, 1728–1735. 10.1002/jrs.2932. [DOI] [Google Scholar]
- Podagatlapalli G. K.; Hamad S.; Rao S. V. Trace-level detection of secondary explosives using hybrid silver–gold nanoparticles and nanostructures achieved with femtosecond laser ablation. J. Phys. Chem. C 2015, 119, 16972–16983. 10.1021/acs.jpcc.5b03958. [DOI] [Google Scholar]
- Naqvi T. K.; Srivastava A. K.; Kulkarni M. M.; Siddiqui A. M.; Dwivedi P. K. Silver nanoparticles decorated reduced graphene oxide (rGO) SERS sensor for multiple analytes. Appl. Surf. Sci. 2019, 478, 887–895. 10.1016/j.apsusc.2019.02.026. [DOI] [Google Scholar]
Associated Data
This section collects any data citations, data availability statements, or supplementary materials included in this article.


