

Abstract
Kallikrein‐related peptidase 6 (KLK6) is a serine protease normally expressed in mammary tissue and aberrantly regulated in breast cancer. At physiological levels, KLK6 functions as a suppressor of breast cancer, while its aberrant overexpression (> 50‐fold higher than normal) is characteristic of a subset of breast cancers and has been linked to accelerated growth of primary breast tumors in severe combined immunodeficiency mice (Pampalakis et al. Cancer Res 2009, 69, 3779). Here, we investigated the molecular mechanisms underlying the concentration‐dependent functions of KLK6 by comparing MDA‐MB‐231 stable transfectants expressing increasing levels of KLK6 in in vitro and in vivo tumorigenicity assays (soft agar, xenograft growth, tail vein metastasis). Quantitative proteomics was applied to identify proteins that are altered upon re‐expression of KLK6 in MDA‐MB‐231 at normal or constitutive levels. Overexpression of KLK6 is associated with increased metastatic ability of breast cancer cells into lungs, increased expression of certain S100 proteins (S100A4, S100A11) and keratins (KRT), and downregulation of the apoptosis‐related proteases CASP7 and CASP8, and RABs. On the other hand, KLK6 re‐expression at physiological levels leads to inhibition of lung metastases associated with suppression of S100 proteins (S100A4, S100A10, S100A13, S100A16) and induced CASP7 and CASP8 expression. As this is the first report that KLK6 expression is associated with S100 proteins, caspases, RABs, and KRTs, we validated this finding in clinical datasets. By integrating proteomics and microarray data from breast cancer patients, we generated two composite scores, KLK6 + S100B‐S100A7 and KLK6 + S100B‐S100A14‐S100A16, to predict long‐term survival of breast cancer patients. We present previously unknown pathways implicating KLK6 in breast cancer. The findings promise to aid our understanding of the functional roles of KLK6 in breast cancer and may yield new biomarkers for the cancer types in which KLK6 is known to be aberrantly upregulated.
Keywords: apoptosis, KLK6, proteomics, S100A, triple‐negative breast cancer
Abbreviations
- EMT
epithelial‐to‐mesenchymal transition
- IPA
Ingenuity Pathway Analysis
- KLK
kallikrein‐related peptidase
- KRT
keratin
- PBST
PBS with 0.05% Tween‐20
- SCID
severe combined immunodeficiency
- SFCM
serum‐free conditioned medium
- TCGA
The Cancer Genome Atlas
- TNBC
triple‐negative breast cancer
1. Introduction
Breast cancer is the most frequent cancer in women and second to all cancers worldwide. With an estimated 2.09 million cases diagnosed per year (data of year 2018), it ranks forth as cause of death from cancer (Bray et al., 2018). Based on microarray profiling data, breast tumors were classified into the following five distinct subtypes: triple‐negative basal‐like (TNBC), luminal A, luminal B, ErbB2‐overexpressing, and normal‐like (Perou et al., 2000; Sørlie et al., 2001). TNBCs are of poor prognosis; consequently, identification of new markers for early detection and/or monitoring is of great importance. Basal‐like breast cancers are further subdivided into basal A and B subtypes based on gene expression (Kao et al., 2009; Neve et al., 2006). The basal B subtype is recapitulated by several of the highly invasive cell lines, such as the MDA‐MB‐231, with manifested epithelial‐to‐mesenchymal transition (EMT) features (Kao et al., 2009). Since proteins are directly linked to functions and phenotypes, proteomic analysis of breast cancers could provide novel biomarkers and/or therapeutic targets (Kulasingam and Diamandis, 2007; Lawrence et al., 2015).
Kallikrein‐related peptidases (KLKs) constitute a family of 15 serine proteases with trypsin‐ or chymotrypsin‐like activity representing the largest cluster of serine proteases in the human genome. Certain KLKs are aberrantly expressed in various cancers, including breast cancer, and may have utility as biomarkers for diagnosis, prognosis, and response to therapy (Sotiropoulou et al., 2009; Stefanini et al., 2015). KLKs play instrumental roles in skin disorders, inflammation, and neurodegeneration; thus, they represent valuable druggable targets (Sotiropoulou and Pampalakis, 2012). Importantly, KLKs are emerging regulators of immune function (Sotiropoulou and Pampalakis, 2010). In particular, KLK6 was originally discovered as being highly upregulated in a primary breast tumor but inactivated in the corresponding lung metastases (Anisowicz et al., 1996). KLK6 is synthesized as an inactive zymogen that can autoactivate, and the active enzyme is capable to self‐inactivate by internal cleavage at arginine 80 (Bayés et al., 2004; Magklara et al., 2003), and its expression is regulated by multiple promoters and different alternatively spliced variants have been identified (Adamopoulos et al., 2017; Pampalakis et al., 2004). In human breast cancer cells, KLK6 expression is silenced via promoter methylation (Pampalakis and Sotiropoulou, 2006; Pampalakis et al., 2009). When KLK6 was re‐expressed in KLK6‐negative MDA‐MB‐231 cells at physiological levels (i.e., those produced in normal mammary tissue), it inhibited tumorigenicity in vitro and in vivo. Intriguingly, aberrant overexpression (at levels > 50‐fold higher than normal) of KLK6 resulted in accelerated growth of primary tumors in severe combined immunodeficiency (SCID) mice, indicating that overexpression of KLK6 promotes tumorigenesis. To delineate the molecular mechanisms underlying these concentration‐dependent effects of KLK6 on the malignant phenotype, we engineered MDA‐MB‐231 transfectant clones that stably express increasing levels of KLK6, including a clone that expresses intermediate levels (between normal and overexpression), and studied primary tumor growth following injection of these clones in SCID mice and their lung metastatic potential. We show that KLK6 inhibits both primary tumor growth and lung metastases only when re‐expressed at normal levels. The proteome of parental (PAR) and engineered MDA‐MB‐231 cells expressing low or high KLK6 levels was analyzed by HPLC‐MS/MS to identify putative molecular pathways underlying the observed, tumor suppression or promotion, respectively. The findings were validated in clinical samples, and two new combined scores for survival prediction are proposed.
2. Materials and methods
2.1. Materials
All chemicals were obtained from Sigma (St. Louis, MO, USA) or Merck (Darmstadt, Germany). Antibodies were as follows: anti‐α‐tubulin (T5168) and anti‐destrin (D8815) from Sigma; anti‐p65 (8242P), anti‐MMP2 (D8N9Y, 13132), and anti‐MMP9 (G657, 2270) from Cell Signaling (Danvers, MA, USA); and anti‐p53, kindly provided by Bořivoj Vojtěšek (Masaryk Memorial Cancer Institute, Czech Republic). Anti‐mouse and anti‐rabbit antibodies were obtained from Sigma and Millipore (Burlington, MA, USA), respectively.
2.2. Cell culture and transfection
MDA‐MB‐231 cells were maintained in RPMI supplemented with 10% FBS and antibiotics (penicillin/streptomycin). The pcDNA3.1(+)/preproKLK6 plasmid was transfected into MDA‐MB‐231 cells with PolyFect (Qiagen, Valencia, CA, USA). Cells were selected with G418 (0.5 mg·mL−1) in RPMI supplemented with 10% FBS. After 3 weeks, colonies were picked and grown individually in 96‐well plates in complete medium supplemented with G418 (0.5 mg·mL−1).
2.3. Soft agar assay
The assay was conducted as described previously (Pampalakis et al., 2009). Briefly, 105 cells per well (six‐well plate) were plated in 0.3% agar (top layer) on a bottom layer of 0.5% agar. After 2 weeks, colonies were stained with 3‐(4,5‐dimethyl‐2‐thiazolyl)‐2,5‐diphenyl‐2H‐tetrazolium bromide and photographed.
2.4. In vivo tumorigenicity
Cells were trypsinized and resuspended in PBS. A total of 2 × 10⁶ cells resuspended in 100 μL PBS were orthotopically implanted into the mammary fat pad of 6‐ to 8‐week‐old SCID mice. Mice were observed on alternate days for the appearance of tumors. All experiments involving mice were performed in accordance with EU and national legislation and with the guidelines of the National Hellenic Research Foundation for ethics of animal experimentation.
2.5. Tail vein model
Cells were trypsinized and resuspended in PBS. A total of 2 × 10⁶ cells in 100 μL PBS were injected via the tail vein. After 8 weeks, mice were sacrificed and their lungs were removed and examined for the presence of visible metastases.
2.6. Cell lysates
Cells were cultured in T175 flasks to 70% confluence, then the medium was removed, and cells were washed with PBS and serum‐free conditioned medium (SFCM) three times, respectively, and incubated with SFCM for 48 h. Cells were scraped on ice‐cold PBS, harvested by centrifugation, and lysed in 50 mm Tris/HCl (pH 7.5), 100 mm NaCl, and 10 mm EDTA containing 1% NP‐40 for 30 min on ice. The lysates were recovered by centrifugation at 14 000 g for 10 min and used immediately. Protein concentration was measured with the Bradford assay (Bio‐Rad, Hercules, CA, USA) using bovine serum albumin as standard.
2.7. SDS/PAGE
Nine hundred micrograms of total protein extracts was treated with loading buffer under reducing conditions (β‐mercaptoethanol) and resolved on a 35‐cm‐long 12% SDS/PAGE. Bands were visualized with Coomassie Brilliant Blue R250 staining. Stained lanes were excised in 23 pieces and stored in 0.1% CH3COOH until used for in‐gel trypsin digestion and mass spectrometry.
2.8. Trypsin digestion
Gels were washed and destained in acetonitrile. Proteins were reduced and alkylated as described (Planque et al., 2009). The gels were incubated with trypsin in 10 mm ammonium bicarbonate. Peptide fragments were extracted and dried. The peptides were resuspended in buffer A (95% water, 0.1% formic acid, 5% acetonitrile, 0.02% trifluoroacetic acid) before loaded onto the HPLC column.
2.9. Mass spectrometry
The HPLC system used a 5‐cm C18 column (inner diameter of 75 μm) with an 8‐μm tip and was coupled to an LTQ Orbitrap XL ThermoFisher (Waltham, MA, USA) mass spectrometer, using a nanoelectrospray ionization source in a data‐dependent mode. Samples were run on a gradient (buffer A: 95% water, 0.1% formic acid, 5% acetonitrile, 0.02% trifluoroacetic acid; buffer B: 90% acetonitrile, 0.1% formic acid, 10% water, 0.02% trifluoroacetic acid). The eluted peptides were subjected to one full MS1 scan in the Orbitrap at 60 000 resolution, followed by six MS2 scans in the linear ion trap. The charges states of + 1 and > 4 as well as unassigned charges states were not subjected to MS/MS fragmentation.
2.10. Protein identification
The RAW files were uploaded on mascot daemon 2.2, and extractmsn (Matrix Science Inc, Boston, MA, USA) was used to generate DAT and then Mascot files. The Mascot files were searched on Global Proteome Machine Manager (2006.06.01) against the concatenated nonredundant IPI. The parameters were as follows: minimum mass, 300 Da; maximum mass, 4000 Da; automatic precursor charge selection; minimum peaks, 10 per MS/MS scan for acquisition; and minimum scans per group, 1. The false discovery rate for peptides was 5.6% and for proteins 2.9%.
2.11. Bioinformatics
Proteomic analysis data were processed with scaffold (Proteome Software Inc, Portland, OR, USA). Average linkage hierarchical clustering of protein profile was performed with cluster, and the results were displayed with treeview (http://rana.lbl.gov/EisenSoftware.htm) (Eisen et al., 1998). For pathway analysis, ingenuity pathway analysis (ipa) software (Ingenuity Systems, Mountain View, CA, USA) was used. The set of proteins differentially expressed in C5 and C28 was imported to ipa for analysis using 70 proteins as default.
2.12. Western blot analysis
Cell lysates were separated by SDS/PAGE, transferred onto poly(vinylidene difluoride) membranes, blocked with 5% nonfat dried milk in PBS, and incubated with primary antibodies (1 : 1000) in 1% nonfat dried milk in PBS with 0.05% Tween‐20 (PBST) for 1 h at room temperature. Then, the membranes were washed with PBS and incubated with secondary antibody (1 : 2500) in 1% nonfat dried milk in PBST. Finally, the membranes were washed four times in PBST and antibody‐specific signals were detected with West Pico enhanced chemiluminescence Pierce (ThermoFisher).
2.13. Gel zymography
Serum‐free conditioned media were concentrated to 1/5 of the original volume with Amicon (Millipore) spin filters with a 10‐kDa cutoff membrane and separated on SDS/PAGE containing 0.1% gelatin under nondenaturing conditions. SDS was removed by washing the gel twice for 15 min each in 50 mm Tris/HCl and 5 mm CaCl2 with 2.5% Triton X‐100, followed by a single wash for another 15 min in the same buffer but with 0.1% Triton X‐100. Finally, gels were incubated at 37 °C for 16 h in buffer containing 0.1% Triton X‐100 and bands were visualized with Coomassie staining. For inhibition assays, 20 mm EDTA was added during the final incubation step.
2.14. Breast cancer clinical data validation
The results were validated on an independent set from The Cancer Genome Atlas (TCGA) databases (Cancer Genome Atlas Network, 2012). The breast cancer dataset was downloaded from TCGA and from cBio Cancer Genomics at the Memorial Sloan Kettering Cancer Center. Data were analyzed from 1106 breast cancer cases and processed as described earlier (Sidiropoulos et al., 2016).
3. Results
3.1. Experimental design
The experimental approach followed is depicted in Fig. 1A. MDA‐MB‐231 cells were stably transfected with the expression plasmid pcDNA3.1(+)/preproKLK6 cDNA that encodes the full‐length KLK6 protein. Stably transfected clones were selected and established in culture. KLK6 expression was measured in cell culture supernatants using a KLK6‐specific ELISA (Diamandis et al., 2000). Phenotypic characterization included the ability of cells to (a) form colonies on soft agar, (b) form tumors when orthotopically implanted in SCID mice, and (c) colonize the lungs. MDA‐MB‐231 cells were selected because they do not express any KLKs, and re‐expression of KLK6 did not induce the expression of any other KLKs (data not shown), which allowed us to dissect the function of KLK6 from potential overlap with functions from other KLKs.
Figure 1.
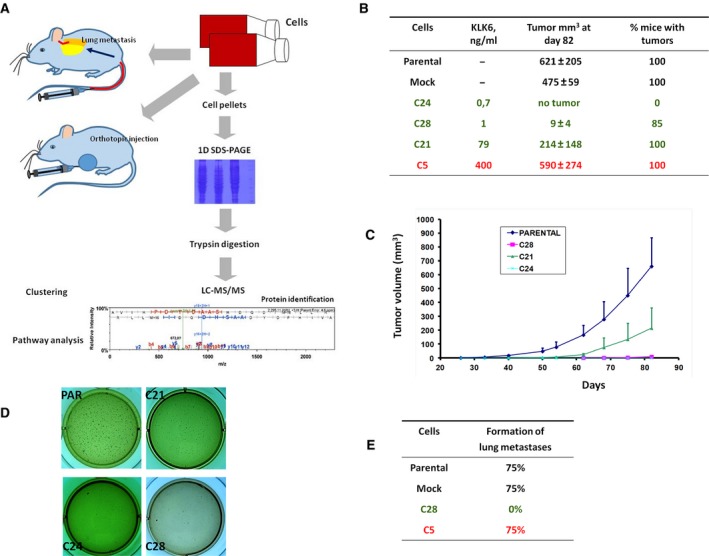
Restoration of KLK6 expression reduces the in vitro and in vivo tumorigenicity of MDA‐MB‐231 cells dose‐dependently. (A) Schematic representation of the experimental design followed in the present study. (B, C) In vivo growth rate and tumor volume of MDA‐MB‐231 cells injected into mouse mammary fat pad. Bars indicate SD. C5 clone has been described previously (Pampalakis et al., 2009). (D) Anchorage‐independent growth assay indicates that only PAR cells and to a lesser extent C21 cells have the ability to form colonies when grown on soft agar. (E) PAR, MOCK, and C5 cells can form tumors in mouse lungs when i.v. injected.
3.2. Dose‐dependent effect of KLK6 on the tumorigenic phenotype of MDA‐MB‐231 cells
The dose‐dependent effect of KLK6 has been documented previously (Pampalakis et al., 2009). Here, we included cells that express intermediate KLK6 levels (C21) and new cells that express physiological levels (C28 and C24). C5 cells, the KLK6‐overexpressing cells, have been described previously (Pampalakis et al., 2009). We verified that re‐expression of KLK6 inhibits the tumorigenicity of MDA‐MB‐231 cells. C21 cells are associated with relatively aggressive phenotype supporting the dose‐dependent effect of KLK6 on breast malignancy in a more detailed manner (Fig. 1B–D). The ability of KLK6‐expressing cells to metastasize was investigated with tail vein assay. C5 cells metastasize to lungs at similar efficiencies as PAR cells, while C28 cells do not metastasize (Fig. 1E). Therefore, KLK6 affects the ability of breast cancer cells to colonize the lungs dose‐dependently.
3.3. Proteomic profiling
Parental (KLK6 nonexpressing), C5 (KLK6 highly overexpressing), and C28 (KLK6 physiological‐expressing) MDA‐MD‐231 cells were selected for proteomic profiling to identify molecular pathways that determine their distinct tumor characteristics in relation to KLK6 levels. We collected 146 947 spectra from C28, 114 113 from C5, and 135 382 from PAR cells. The average spectral counts were 24.94 for C28, 16.54 for C5, and 20.56 for PAR. In total, 3639 proteins were identified, and 2449 were present in all three samples (Fig. 2A,B; Table S1). The number of proteins is distributed as follows: 3268 proteins in PAR, 3312 in C28, and 2731 in C5. With ≥ 95% probability, we found 2801 proteins: 2407 in PAR, 2553 in C28, and 1983 in C5. From this list, 1814 proteins were present in all cells (Fig. 2C), while 2341 were found to display at least twofold difference (up or down) in either C5 or C28 cells compared to PAR. The identified proteins show approximately the same distribution in terms of function and subcellular localization in all cells (PAR, C5, and C28; Fig. S1). The relative expression levels between proteins found in C5 or C28 compared to PAR are shown in Fig. 2D. Protein expression changes can be grouped in three categories: (a) proteins that remain almost unaffected upon KLK6 re‐expression independently from the levels of KLK6 expression, (b) proteins with expression that is decreased or increased in a KLK6 concentration‐dependent manner, and (c) proteins that display bell‐shaped expression. The last category could explain why KLK6 exerts different effects on the MDA‐MB‐231 phenotype when re‐expressed at physiological levels relative to overexpression. Proteomic profiling results were validated by western blot analysis of p53, p65, α‐tubulin, and destrin (Fig. 2E).
Figure 2.
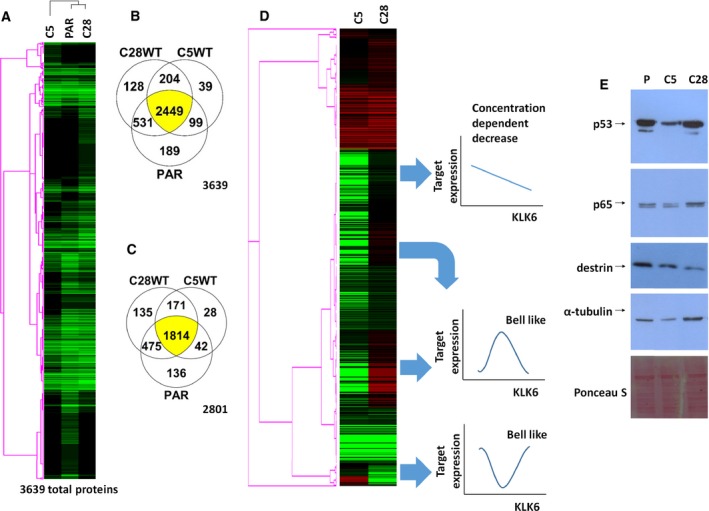
Proteomic profiling of MDA‐MB‐231 cells. (A) In total, 3639 proteins in PAR, C5, and C28 cells were identified. (B) Venn diagram shows the common proteins between the different clones. (C) Venn diagram shows the common proteins identified with ≥ 95% probability (total 2801 proteins) between the different clones. (D) Differential proteomic profiling. Black depicts no expression, green lower expression, and red higher expression compared to PAR cells. (E) Western blot analysis of selected proteins (p53, p65, destrin, and α‐tubulin) verifies the proteomic profiling.
We then searched for pathways that are differentially activated or inactivated between C5 and C28 cells. For the generation of pathways (Fig. 3), only proteins displaying ≥ 4‐fold changes between C5 and PAR, or C28 and PAR, were analyzed with ipa.
Figure 3.
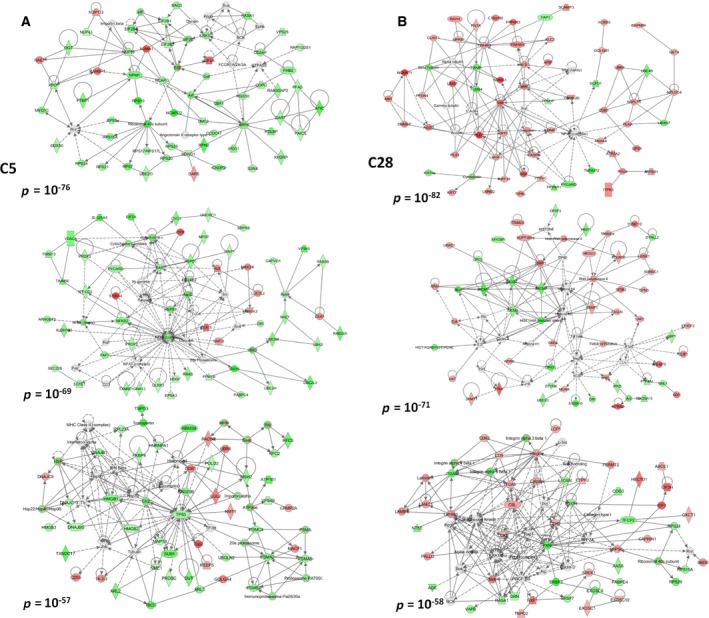
Molecular pathways. (A) Networks constructed based on the proteome of C5 cells or on the proteome of C28 cells. (B) The first three networks (lower P values) generated by ipa are depicted.
3.4. Re‐expression of KLK6 at physiological levels reduces the expression of S100 proteins
Multiple members of the S100 family are upregulated in cancer. Overexpression of S100A1, A4, A6, A7, A8, A9, A11, and A14 in breast cancer correlates with aggressive phenotype (Bresnick et al., 2015). S100A4 was studied extensively and correlated with metastatic disease and poor survival (Bresnick et al., 2015). S100A proteins were downregulated in C28 cells, while in C5, S100A4 and S100A11 were upregulated (Fig. 4A). This bell‐shaped expression pattern of S100 proteins relative to KLK6 expression could explain why C5 cells have the ability to metastasize to lungs in contrast to C28. The correlation of KLK6 expression with S100 proteins was further investigated in clinical datasets from breast cancer patients. Physiological KLK6 levels inversely correlated with S100A11 and S100A14 (Fig. 4B,C). In basal‐like cancer, there was a positive correlation of KLK6 and S100A11 and S100A2 (Fig. 4B,C), in accordance with our findings.
Figure 4.
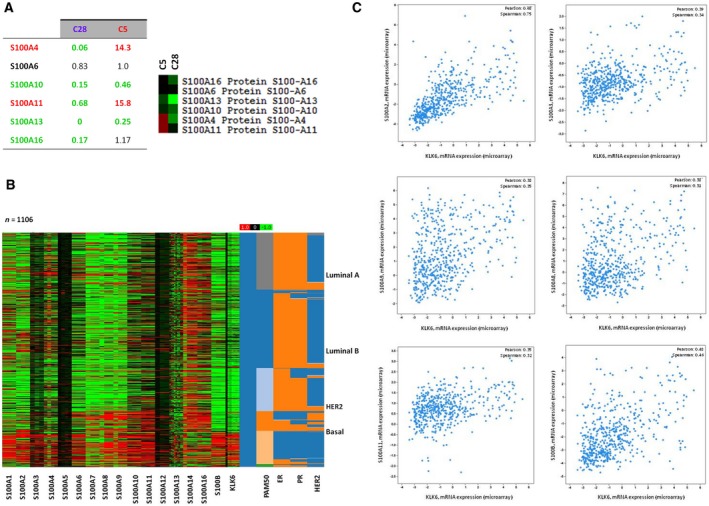
KLK6 affects the levels of S100A proteins. (A) Proteomic data indicate that in C28 cells, there is downregulation of S100A proteins, while in C5 cells, there is upregulation of S100A4 and S100A11. (B, C) In silico correlation of S100 expression with KLK6 expression in breast cancer clinical specimens.
3.5. Physiological levels of KLK6 induce the expression of apoptosis‐related proteins
Apoptosis‐related proteins were upregulated in C28 but downregulated in C5 cells (Fig. 5). The increased expression of apoptosis‐mediating proteins such as CASP8 and CASP7 in C28 cells may account for their reduced tumorigenicity. The association of KLK6 overexpression with apoptosis is also demonstrated by the fact that many members of the annexin family are reduced in C5 compared to C28 or PAR cells (Table S1). Consistently, it was previously reported that high levels of KLK6 promote resistance to apoptosis in A549 lung cancer cells (Michel et al., 2014). Analysis of breast cancer clinical datasets showed correlation of KLK6 expression with the expression of BCL members (Fig. 5).
Figure 5.
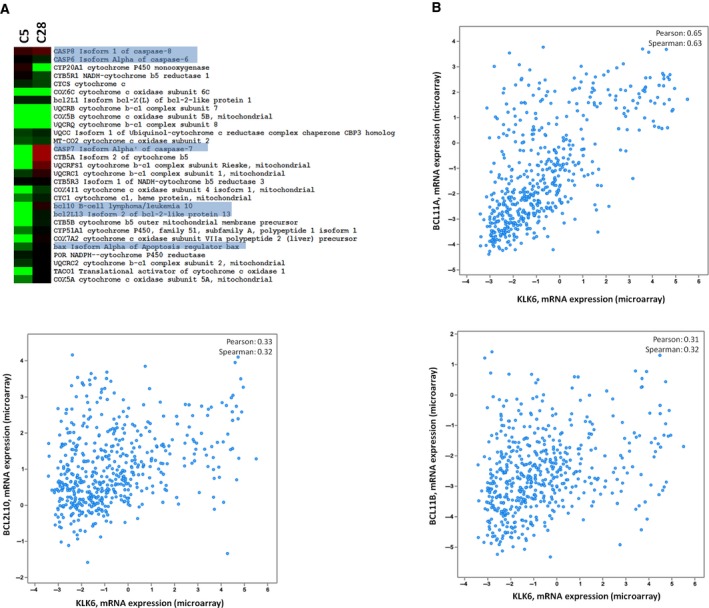
KLK6 affects the apoptosis‐related genes. (A) Expression of apoptosis‐related proteins in C28 cells and C5 cells (relative to PAR). (B) In silico correlation of apoptosis‐related genes with KLK6 expression in breast cancer clinical specimens.
3.6. Re‐expression of KLK6 reduces the expression of RAB proteins
RABs are intracellular transport proteins that regulate vesicle trafficking and intracellular communication. Vesicle trafficking is important to epithelial carcinogenesis since aberrant trafficking has been linked to loss of cell polarity, increased proliferation, cellular motility, and invasion. Altered expression of multiple members of RABs has been observed in various cancers (Goldenring, 2013). The expression of RABs in MDA‐MB‐231 showed high variability: Some members exhibited slight reduction in C28 but more pronounced in C5 cells, while others exhibited increased levels in both C5 and C28 cells (Fig. 6). Changes in RAB expression indicate reorganization of vesicle trafficking in C5 and C28 cells, and RABs that are severely downregulated in C5 but remain almost unchanged in C28 (shaded box in Fig. 6) could associate with increased metastatic ability and tumorigenicity. As shown in Fig. 6, RAB23 is upregulated in C28 but downregulated in C5 cells. Consistently, it has been shown that overexpression of RAB23 in MDA‐MB‐231 causes cell cycle arrest, inhibits growth and proliferation, and induces apoptosis (Liu et al., 2015). RAB35 that displays a similar pattern to RAB23 promotes cell–cell adhesion (Allaire et al., 2013). Integrin β1 reported to be suppressed by RAB35 (Allaire et al., 2013) was found slightly upregulated in C5 (spectral counts in C28: 51; C5: 109; and PAR: 73). In silico analysis of breast cancer clinical datasets showed that KLK6 expression inversely correlates with RAB26, RAB17, and RAB30 (Fig. 6). However, we could not associate RAB35 or RAB23 expression with KLK6 expression in clinical samples. This fact could indicate that this correlation is restricted to MDA‐MB‐231. Nonetheless, it should be noted that bioinformatic analysis was based on available transcriptomic data, which do not always overlap with proteomics.
Figure 6.
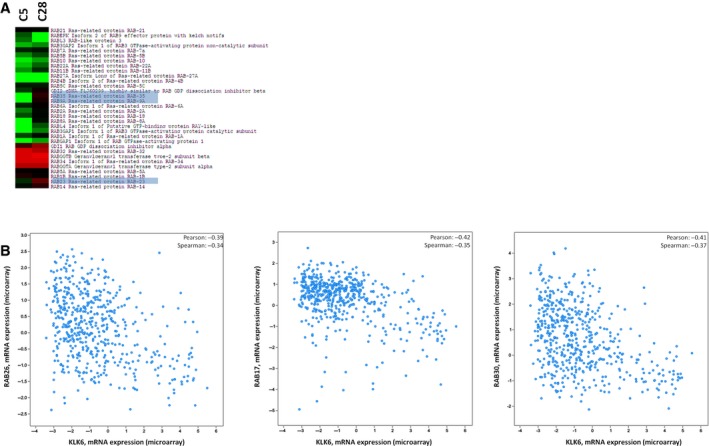
KLK6 affects the expression of RAB proteins. (A) Expression of RABs in C28 cells and C5 cells (relative to PAR). (B) In silico correlation of RAB gene expression with KLK6 expression in breast cancer clinical specimens.
Macropinocytosis is considered to drive the uptake of prion and SOD1 aggregates associated with neurodegenerative disorders (Creutzfeldt–Jakob disease and amyotrophic lateral sclerosis, respectively) by neuronal cells. The cellular proteins that regulate macropinocytosis were recently described and shown to be cofilin‐1, ROCK1, RAB5C, and RAB10 (Zhong et al., 2018). All these proteins were downregulated in KLK6‐expressing cells [cofilin‐1 is reduced in both C28 and C5 (spectral counts: C28: 282; C5: 127; PAR: 404), ROCK1 (C28: 0; C5: 0; PAR: 2), RAB5C (C28: 23; C5: 25; PAR: 44), and RAB10 (C28: 8; C5: 2; PAR: 59)]. Therefore, the KLK6‐expressing cells may have reduced ability for macropinocytosis. This could explain our recent finding that Klk6 −/− primary neuronal cells display increased ability to uptake α‐synuclein aggregates with prion‐like propagation properties compared to wild‐type neuronal cells (Pampalakis et al., 2017).
3.7. KLK6 is coordinately expressed with multiple keratins
Keratins (KRTs) participate in EMT and could be involved in cancer invasion and metastasis (Karantza, 2011). Figure S2A shows upregulation of KRT8 and KRT18 in both C5 and C28 cells in accordance with the mesenchymal‐to‐epithelial transition induced upon restoration of KLK6 expression in MDA‐MB‐231 (Pampalakis et al., 2009). We suggested that KLK6 upregulates KRT8 expression through the TGF‐β pathway (Pampalakis et al., 2008). KRT81 was upregulated in KLK6‐overexpressing C5 cells but downregulated in C28 cells expressing low KLK6. The physiological significance of this finding is not known but may indicate that KRT81 promotes tumorigenesis. Analysis of breast cancer clinical datasets showed correlation (direct or inverse) of KRT expression with KLK6 including an inverse correlation of KLK6 and KRT18 (Fig. S2B,C).
3.8. Re‐expression of KLK6 results in reduced levels of ribosomal proteins
The expression of ribosomal and mitochondrial ribosomal proteins (RPs) is reduced upon re‐expression of KLK6 in a dose‐dependent manner with higher KLK6 expression causing higher suppression of RPs (Fig. S3). RPs bind MDM2 and block p53 degradation (Zhang and Lu, 2009). Thus, lower levels of RPs lead to higher p53. C5 cells express low levels of RPs and low levels of p53. This discrepancy could be explained by the fact that MDA‐MB‐231 cells express mutant p53 that is not under control of MDM2 (Vijayakumaran et al., 2015). Analysis of RP expression in breast cancer clinical datasets did not show correlation with KLK6 expression, indicating that the described association could be restricted to MDA‐MB‐231 cells.
3.9. KLK6 re‐expression induces changes in secreted metalloprotease activities
Gel zymography and secretomics (Table S2) were used to analyze the expression of proteolytic enzymes in cell supernatants. As shown in Fig. S4, C28 cells expressed significantly lower amount of MMP2 and MMP9 compared to PAR and C5 cells. Therefore, re‐expression of KLK6 at physiological levels reduces the expression of gelatinases that strongly correlate with tumor metastasis and progression (Deryugina and Quigley, 2006). The higher band of MMP2 detected by western blot in C28 could be a MMP2/TIMP2 complex that is partially resistant to proteolysis. Recently, we showed that KLK6 cleaves and activates proMMP2 (Pampalakis et al., 2017), while another study showed that KLK6 activates proMMP9 (Bando et al., 2018). Therefore, in C5 cells expression and activation of proMMP2 and proMMP9 could occur and contribute to increased tumorigenicity.
3.10. Survival analysis
Two composite scores, KLK6 + S100B‐S100A7 and KLK6 + S100B‐S100A14‐S100A16, were generated to predict long‐term survival of breast cancer patients (Fig. 7A,B). The generation of these scores was based on our findings and used a trial‐and‐error approach. The composite scores were equally weighted. For the KLK6 + S100B‐S100A7, breast cancer patients with the lowest scores have longer long‐term survival as compared to patients with high scores. Therefore, this score could find diagnostic applications.
Figure 7.
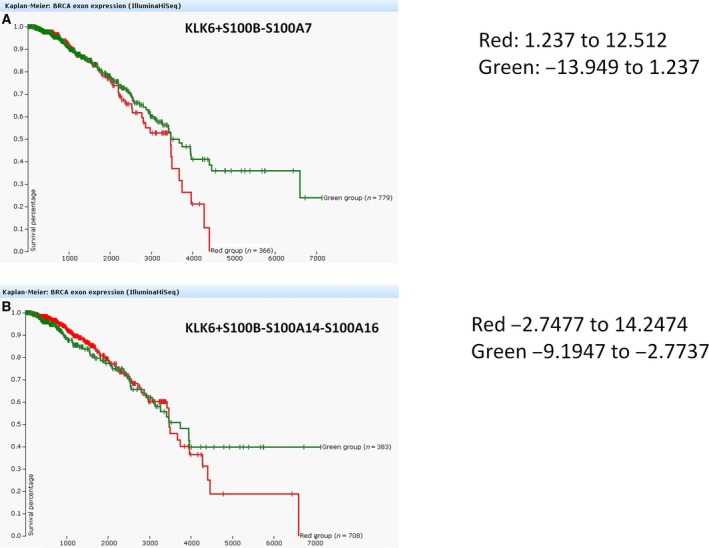
Overall survival (OS) scores. (A) KLK6 + S100B‐S100A7 scoring expression in breast cancer patients. Green indicates expression score −13.949 to 1.237; red indicates expression score 1.237–12.512. (B) KLK6 + S100B‐S100A14‐S100A16 scoring expression in breast cancer patients. Green indicates expression score −9.1947 to −2.7737; red indicates expression score −2.7477 to 14.2474.
4. Discussion
KLK6 displays aberrant expression in various types of cancer, including breast cancer (Anisowicz et al., 1996; Haritos et al., 2018; Wang et al., 2008), head and neck squamous cell cancer (Schrader et al., 2015), renal cancer (Tailor et al., 2018), and colon cancer (Kim et al., 2011; Petrak et al., 2012). Very recently, we showed that KLK6 accelerates nonmelanoma skin cancer formation in vivo by increasing tumor‐associated inflammation (Khoury et al., 2018). KLK6 expression in breast cancer either above or below the physiological levels has been associated with reduced overall survival of breast cancer patients (Sidiropoulos et al., 2016). In breast cancer, reduced KLK6 mRNA levels have been found relative to noncancerous tissue, but in TNBC and HER2‐positive cancer, there is an overexpression of KLK6 mRNA and KLK6 levels constitute an unfavorable marker for breast cancer (Haritos et al., 2018). Also, the expression of KLK6 is significantly higher in the serum of breast cancer patients compared to healthy individuals (Mangé et al., 2016).
Using proteomics, we show that physiological levels of KLK6 in C28 clone are associated with increased expression of apoptosis‐mediating proteins such as CASP8 and CASP7, while high levels of KLK6 are associated with high expression of S100 proteins. These differentially expressed proteins could explain why C28 cells have reduced tumorigenicity while C5 cells display a more aggressive phenotype and increased ability to form lung metastases. It is known that S100 proteins are upregulated in basal‐like breast carcinomas and increased expression of S100A11 and S100A14 was correlated with poor outcome in breast cancer (McKierman et al., 2011). S100A4 mediates breast cancer metastasis, and its expression is controlled via the β‐catenin pathway (Bresnick et al., 2015); therefore, high levels of KLK6 could activate the β‐catenin pathway as reported in keratinocytes (Klucky et al., 2007), to drive the expression of S100A4. S100A4, in turn, enhances the expression of MMP9 and TIMP1 at the transcriptional level thus increasing tumorigenicity (Saleem et al., 2006). S100A4 was also shown to increase MMP2 levels in MDA‐MB‐231 and MDA‐MB‐468 breast cancer cells (Xu et al., 2015). Consistently, we found increased expression of MMP9 in the secretome of C5 cells but reduced expression in C28 cells in which KLK6 is expressed at low levels.
Although C5 cells display increased tumorigenicity, they have reduced levels of mutant p53 (R280K). In MDA‐MB‐231, mutant p53 (R280K) regulates the expression of genes encoding enzymes of the mevalonate pathway. shRNA‐mediated knockdown of mutant p53 downregulates the mevalonate pathway and alters cellular morphology to more acinar‐like morphology reducing their tumorigenicity (Freed‐Pastor et al., 2012). Therefore, overexpression of KLK6 (clone C5) could reduce the expression of mutant p53 to increase tumorigenicity. In addition, mutant p53 downregulates Dicer expression (Muller et al., 2014). Since C5 cells express low levels of p53, this explains our recent observation that C5 cells express high levels of Dicer mRNA (Sidiropoulos et al., 2016).
Caspases have tumor suppressor functions, and in breast cancer cells, downregulation of CASP8 has been reported (Olsson and Zhivotovsky, 2011). Therefore, upregulation of CASP8 and CASP7 in C28 cells could account for their reduced tumorigenicity by inducing apoptosis. Loss of cell polarity is characteristic of epithelial carcinogenesis. RAB proteins are membrane trafficking regulators that are responsible for cellular polarity (Goldenring, 2013). Both C28 and C5 expressed reduced levels of the RABs, and this was more pronounced in C5 although we did not detect changes in RAB5A that has been linked to breast cancer metastasis (Goldenring, 2013).
KLK6 has been implicated in EMT in breast cancer (Pampalakis et al., 2009), in gastric cancer by reducing the expression of E‐cadherin at the transcriptional level (Kim et al., 2012), and in colon cancer (Kim et al., 2011). Finally, KLK6 may regulate the TGF‐β pathway (Pampalakis et al., 2008, 2017; Qin et al., 2012). How KLK6 expression is regulated in breast cancer is not fully elucidated. KLK6 silencing in breast cancer cells occurs through promoter methylation (Pampalakis et al., 2009). On the other hand, RhoA upregulates the expression of KLK6 at the transcriptional level (Teo et al., 2016). Since RhoA is expressed in MDA‐MB‐231 (Table S1), it could be that the endogenous KLK6 promoter methylation prevents its expression. KLK6 is regulated by mutant K‐RAS in colon cancer cells to enhance their migration and invasion (Henkhaus et al., 2008). Recently, KLK6 was shown to post‐transcriptionally process 6‐phosphofructo‐1‐kinase (PFK‐M) to produce shorter highly active fragments, while it increased the growth rate of Saccharomyces cerevisiae engineered to express human PFK‐M. Therefore, KLK6 could trigger glycolytic flux in cancer cells (Andreic and Legiša, 2018). Our data did not find the KLK6‐proteolytic fragments of PFK‐M, but this could be due to their very low expression compared to other peptide fragments.
5. Conclusion
In conclusion, we showed that KLK6 displays a concentration‐dependent effect on breast primary tumor growth and metastasis. Specifically, when KLK6 is expressed at levels comparable to the levels secreted by normal mammary cells, it inhibits primary tumor formation and lung metastasis in vivo. On the other hand, overexpression of KLK6 (> 50‐fold higher than normal), characteristic of a subset of breast cancers, promotes primary tumorigenesis and lung metastasis in vivo. For the first time, we correlated tumorigenicity of KLK6 with the expression of S100A and apoptosis‐mediated proteins. Based on these findings, we provided a combined score that could assist in the prognosis of breast cancer patients. Finally, as mentioned previously the regulation of RABs by KLK6 could be responsible for the enhanced uptake of α‐synuclein aggregates from the Klk6 −/− cells, a finding that merits further investigation in the future. Thus, whether the identified KLK6‐regulated proteins and corresponding pathways operate in other systems besides breast cancer remains to be investigated.
Conflict of interest
The authors declare no conflict of interest.
Author contributions
GP performed experiments and wrote the manuscript; EZ performed experiments; KGS and GMY analyzed the clinical data; EPD acquired MS data; VZ performed experiments with animals; and GS conceived, designed, and supervised the project, analyzed the data, acquired funding, and wrote the manuscript.
Supporting information
Fig. S1. Classification of the identified proteins according to Gene Ontology (GO). Pie chart shows the classification of proteins according to the biological processes (A) and cellular component (B). Bar chart shows the distribution of proteins according to the biological processes (C) and cellular component (D) for each clone (PAR, C5, and C28).
Fig. S2. Association of KLK6 and keratins. treeview (A) and list of KRTs (B) and their expression in C28 and C5 cells. Red color indicates higher expression than PAR and green color lower expression. C, In silico correlation of KRT expression with KLK6 expression in breast cancer clinical specimens.
Fig. S3. KLK6 affects the expression of ribosomal proteins. treeview of ribosomal and mitochondrial ribosomal proteins expressed in C28 and C5 cells. Red color indicates higher expression than PAR and green color lower.
Fig. S4. KLK6 expression affects the levels of metalloprotease expression. A, Gelatin zymography of SFCMs obtained from PAR (P), C5, and C28 cells. B, Western blot analysis of MMP9 and MMP2 expression in SFCMs from PAR (P), C5, and C28 cells. C, Expression of MMPs and their inhibitors in SFCMs identified by HPLC‐MS/MS analysis. The numbers on the left indicate the fold increase in C5 SFCM relative to PAR SFCM (P). Secretomics were conducted on SFCMs from C5 and PAR cells. For this, after carefully washing the cells (3 times with PBS and 3 times with SFCM), new SFCMs were added in cells for 48 h. The SFCMs were collected and centrifuged to remove cell debris and stored at −80 °C until the analysis. The detailed secretomic profiling is given in Table S2.
Table S1. Results from proteomic profiling.
Table S2. Results from secretomic profiling.
Acknowledgements
We would like to thank Prof Bořivoj Vojtěšek (Masaryk Memorial Cancer Institute, Czech Republic) for providing the anti‐p53 antibody and Christopher Smith for assistance in the proteomic analysis (Mount Sinai Hospital, Toronto, Ontario, Canada). The work was funded by K. Karatheodoris (C.186) provided by the Research Committee of the University of Patras and PENED2003 (03EΔ430) cofunded by the EU European Social Fund (75%) and the Greek Ministry of Development‐GSRT (25%).
References
- Adamopoulos PG, Kontos CK and Scorilas A (2017) Molecular cloning of novel transcripts of human kallikrein‐related peptidases 5, 6, 7, 8 and 9 (KLK5‐KLK9), using Next‐generation sequencing. Sci Rep 7, 17299. [DOI] [PMC free article] [PubMed] [Google Scholar]
- Allaire PD, Seyed Sadr M, Chaineau M, Seyed Sadr E, Konefal S, Fotouhi M, Maret D, Ritter B, Del Maestro RF and McPherson PS (2013) Interplay between Rab35 and Arf6 controls cargo recycling to coordinate cell adhesion and migration. J Cell Sci 126, 722–731. [DOI] [PubMed] [Google Scholar]
- Andreic D and Legiša M (2018) Kallikrein‐related peptidase 6 can cleave human‐muscle‐type 6‐phosphofructo‐1‐kinase into highly shorter fragments. Biochim Biophys Acta 1866, 602–607. [DOI] [PubMed] [Google Scholar]
- Anisowicz A, Sotiropoulou G, Stenman G, Mok SC and Sager R (1996) A novel protease homolog differentially expressed in breast and ovarian cancer. Mol Med 2, 624–636. [PMC free article] [PubMed] [Google Scholar]
- Bando Y, Hagiwara Y, Suzuki Y, Yoshida K, Aburakawa Y, Kimura T, Murakami C, Ono M, Tanaka T, Jiang YP et al (2018) Kallikrein 6 secreted by oligodendrocytes regulates the progression of experimental autoimmune encephalomyelitis. Glia 66, 359–378. [DOI] [PubMed] [Google Scholar]
- Bayés A, Tsetsenis T, Ventura S, Avilés FX, Vendrell J and Sotiropoulou G (2004) Human kallikrein 6 activity is regulated via an autoproteolytic mechanism of activation/inactivation. Biol Chem 385, 517–524. [DOI] [PubMed] [Google Scholar]
- Bray F, Ferlay J, Soerjomataram I, Siegel RL, Torre LA and Jemal A (2018) Global cancer statistics 2018, GLOBOCAN estimates of incidence and mortality worldwide for 36 cancers in 185 countries. CA Cancer J Clin 68, 394–424. [DOI] [PubMed] [Google Scholar]
- Bresnick AR, Weber DJ and Zimmer DB (2015) S100 proteins in cancer. Nat Rev Cancer 15, 96–109. [DOI] [PMC free article] [PubMed] [Google Scholar]
- Cancer Genome Atlas Network (2012) Comprehensive molecular portraits of human breast tumours. Nature 490, 61–70. [DOI] [PMC free article] [PubMed] [Google Scholar]
- Deryugina EI and Quigley JP (2006) Matrix metalloproteinases and tumor metastasis. Cancer Metastasis Rev 25, 9–34. [DOI] [PubMed] [Google Scholar]
- Diamandis EP, Yousef GM, Soosaipillai AR, Grass L, Porter A, Little S and Sotiropoulou G (2000) Immunofluorometric assay of human kallikrein 6 (zyme/protease M/neurosin) and preliminary clinical applications. Clin Biochem 33, 369–375. [DOI] [PubMed] [Google Scholar]
- Eisen MB, Spellman PT, Brown PO and Botstein D (1998) Cluster analysis and display of genome‐wide expression patterns. Proc Natl Acad Sci USA 95, 14863–14868. [DOI] [PMC free article] [PubMed] [Google Scholar]
- Freed‐Pastor WA, Mizuno H, Zhao X, Langerød A, Moon SH, Rodriguez‐Barrueco R, Barsotti A, Chicas A, Li W, Polotskaia A et al (2012) Mutant p53 disrupts mammary tissue architecture via the mevalonate pathway. Cell 148, 244–258. [DOI] [PMC free article] [PubMed] [Google Scholar]
- Goldenring JR (2013) A central role for vesicle trafficking in epithelial neoplasia: intracellular highways to carcinogenesis. Nat Rev Cancer 13, 813–820. [DOI] [PMC free article] [PubMed] [Google Scholar]
- Haritos C, Michaelidou K, Mavridis K, Missitzis I, Ardavanis A, Griniatsos J and Scorilas A (2018) Kallikrein‐related peptidase 6 (KLK6) expression differentiates tumor subtypes and predicts clinical outcome in breast cancer patients. Clin Exp Med 18, 203–213. [DOI] [PubMed] [Google Scholar]
- Henkhaus RS, Gerner EW and Ignatenko NA (2008) Kallikrein 6 is a mediator of K‐RAS‐dependent migration of colon carcinoma cells. Biol Chem 389, 757–764. [DOI] [PMC free article] [PubMed] [Google Scholar]
- Kao J, Salari K, Bocanegra M, Choi YL, Girard L, Gandhi J, Kwei KA, Hernandez‐Boussard T, Wang P, Gazdar AF et al (2009) Molecular profiling of breast cancer cell lines defines relevant tumor models and provides a resource for cancer gene discovery. PLoS ONE 4, e6146. [DOI] [PMC free article] [PubMed] [Google Scholar]
- Karantza V (2011) Keratins in health and cancer: more than mere epithelial cell markers. Oncogene 30, 127–138. [DOI] [PMC free article] [PubMed] [Google Scholar]
- Khoury N, Zingkou E, Pampalakis G, Sofopoulos M, Zoumpourlis V and Sotiropoulou G (2018) KLK6 protease accelerates skin tumor formation and progression. Carcinogenesis 39, 1529–1536. [DOI] [PubMed] [Google Scholar]
- Kim JJ, Kim JT, Yoon HR, Kang MA, Kim JH, Lee YH, Kim JW, Lee SJ, Song EY, Myung PK et al (2012) Upregulation and secretion of kallikrein‐related peptidase 6 (KLK6) in gastric cancer. Tumour Biol 33, 731–738. [DOI] [PubMed] [Google Scholar]
- Kim JT, Song EY, Chung KS, Kang MA, Kim JW, Kim SJ, Yeom YI, Kim JH, Kim KH and Lee HG (2011) Up‐regulation and clinical significance of serine protease kallikrein 6 in colon cancer. Cancer 117, 2608–2619. [DOI] [PubMed] [Google Scholar]
- Klucky B, Mueller R, Vogt I, Teurich S, Hartenstein B, Breuhahn K, Flechtenmacher C, Angel P and Hess J (2007) Kallikrein 6 induces E‐cadherin shedding and promotes cell proliferation, migration, and invasion. Cancer Res 67, 8198–8206. [DOI] [PubMed] [Google Scholar]
- Kulasingam V and Diamandis EP (2007) Proteomics analysis of conditioned media from three breast cancer cell lines: a mine for biomarkers and therapeutic targets. Mol Cell Proteomics 6, 1997–2011. [DOI] [PubMed] [Google Scholar]
- Lawrence RT, Perez EM, Hernández D, Miller CP, Haas KM, Irie HY, Lee SI, Blau CA and Villén J (2015) The proteomic landscape of triple‐negative breast cancer. Cell Rep 11, 630–644. [DOI] [PMC free article] [PubMed] [Google Scholar]
- Liu Y, Zeng C, Bao N, Zhao J, Hu Y, Li C and Chi S (2015) Effect of Rab23 on the proliferation and apoptosis in breast cancer. Oncol Rep 34, 1835–1844. [DOI] [PubMed] [Google Scholar]
- Magklara A, Mellati AA, Wasney GA, Little SP, Sotiropoulou G, Becker GW and Diamandis EP (2003) Characterization of the enzymatic activity of human kallikrein 6: autoactivation, substrate specificity, and regulation by inhibitors. Biochem Biophys Res Commun 307, 948–955. [DOI] [PubMed] [Google Scholar]
- Mangé A, Dimitrakopoulos L, Soosaipillai A, Coopman P, Diamandis EP and Solassol J (2016) An integrated cell line‐based discovery strategy identified follistatin and kallikrein 6 as serum biomarker candidates of breast carcinoma. J Proteomics 142, 114–121. [DOI] [PubMed] [Google Scholar]
- McKierman E, McDermott EW, Evoy D, Crown J and Duffy MJ (2011) The role of S100 genes in breast cancer progression. Tumour Biol 32, 441–450. [DOI] [PubMed] [Google Scholar]
- Michel N, Heuzé‐Vourc'h N, Lavergne E, Parent C, Jourdan ML, Vallet A, Iochmann S, Musso O, Reverdiau P and Courty Y (2014) Growth and survival of lung cancer cells: regulation by kallikrein‐related peptidase 6 via activation of proteinase‐activated receptor 2 and the epidermal growth factor receptor. Biol Chem 395, 1015–1025. [DOI] [PubMed] [Google Scholar]
- Muller PA, Trinidad AG, Caswell PT, Norman JC and Vousden KH (2014) Mutant p53 regulates dicer through p63‐dependent and independent mechanisms to promote an invasive phenotype. J Biol Chem 289, 122–132. [DOI] [PMC free article] [PubMed] [Google Scholar]
- Neve RM, Chin K, Fridlyand J, Yeh J, Baehner FL, Fevr T, Clark L, Bayani N, Coppe JP, Tong F et al (2006) A collection of breast cancer cell lines for the study of functionally distinct cancer subtypes. Cancer Cell 10, 515–527. [DOI] [PMC free article] [PubMed] [Google Scholar]
- Olsson M and Zhivotovsky B (2011) Caspases and cancer. Cell Death Differ 18, 1441–1449. [DOI] [PMC free article] [PubMed] [Google Scholar]
- Pampalakis G, Arampatzidou M, Amoutzias G, Kossida S and Sotiropoulou G (2008) Identification and analysis of mammalian KLK6 orthologue genes for prediction of physiological substrates. Comput Biol Chem 32, 111–121. [DOI] [PubMed] [Google Scholar]
- Pampalakis G, Kurlender L, Diamandis EP and Sotiropoulou G (2004) Cloning and characterization of novel isoforms of the human kallikrein 6 gene. Biochem Biophys Res Commun 320, 54–61. [DOI] [PubMed] [Google Scholar]
- Pampalakis G, Prosnikli E, Agalioti T, Vlahou A, Zoumpourlis V and Sotiropoulou G (2009) A tumor‐protective role for human kallikrein‐related peptidase 6 in breast cancer mediated by inhibition of epithelial‐to‐mesenchymal transition. Cancer Res 69, 3779–3787. [DOI] [PubMed] [Google Scholar]
- Pampalakis G and Sotiropoulou G (2006) Multiple mechanisms underlie the aberrant expression of the human kallikrein 6 gene in breast cancer. Biol Chem 387, 773–782. [DOI] [PubMed] [Google Scholar]
- Pampalakis G, Sykioti VS, Ximerakis M, Stefanakou‐Kalakou I, Melki R, Vekrellis K and Sotiropoulou G (2017) KLK6 proteolysis is implicated in the turnover and uptake of extracellular alpha‐synuclein species. Oncotarget 8, 14502–14515. [DOI] [PMC free article] [PubMed] [Google Scholar]
- Perou CM, Sørlie T, Eisen MB, van de Rijn M, Jeffrey SS, Rees CA, Pollack JR, Ross DT, Johnsen H, Akslen LA et al (2000) Molecular portraits of human breast tumours. Nature 406, 747–752. [DOI] [PubMed] [Google Scholar]
- Petrak C, Dubinski W, Scorilas A, Saleh C, Pasic MD, Komborozos V, Khalil B, Gabril MY, Streutker C, Diamandis EP et al (2012) Evaluation and prognostic significance of human tissue kallikrein‐related peptidase 6 (KLK6) in colorectal cancer. Pathol Res Pract 208, 104–108. [DOI] [PubMed] [Google Scholar]
- Planque C, Kulasingam V, Smith CR, Reckamp K, Goodglick L and Diamandis EP (2009) Identification of five candidate lung cancer biomarkers by proteomics analysis of conditioned media of four lung cancer cell lines. Mol Cell Proteomics 8, 2746–2758. [DOI] [PMC free article] [PubMed] [Google Scholar]
- Qin W, Zhang K, Kliethermes B, Ruhlen RL, Browne EP, Arcaro KF and Sauter ER (2012) Differential expression of cancer associated proteins in breast milk based on age at first full term pregnancy. BMC Cancer 12, 100. [DOI] [PMC free article] [PubMed] [Google Scholar]
- Saleem M, Kweon MH, Johnson JJ, Adhami VM, Elcheva I, Khan N, Bin Hafeez B, Bhat KM, Sarfaraz S, Reagan‐Shaw S et al (2006) S100A4 accelerates tumorigenesis and invasion of human prostate cancer through the transcriptional regulation of matrix metalloproteinase 9. Proc Natl Acad Sci USA 1033, 14825–14830. [DOI] [PMC free article] [PubMed] [Google Scholar]
- Schrader CH, Kolb M, Zaoui K, Flechtenmacher C, Grabe N, Weber KJ, Hielscher T, Plinkert PK and Hess J (2015) Kallikrein‐related peptidase 6 regulates epithelial‐to‐mesenchymal transition and serves as prognostic biomarker for head and neck squamous cell carcinoma patients. Mol Cancer 14, 107. [DOI] [PMC free article] [PubMed] [Google Scholar]
- Sidiropoulos KG, Ding Q, Pampalakis G, White NM, Boulos P, Sotiropoulou G and Yousef GM (2016) KLK6‐regulated miRNA networks activate oncogenic pathways in breast cancer subtypes. Mol Oncol 10, 993–1007. [DOI] [PMC free article] [PubMed] [Google Scholar]
- Sørlie T, Perou CM, Tibshirani R, Aas T, Geisler S, Johnsen H, Hastie T, Eisen MB, van de Rijn M, Jeffrey SS et al (2001) Gene expression patterns of breast carcinomas distinguish tumor subclasses with clinical implications. Proc Natl Acad Sci USA 98, 10869–10874. [DOI] [PMC free article] [PubMed] [Google Scholar]
- Sotiropoulou G and Pampalakis G (2010) Kallikrein‐related peptidases: bridges between immune functions and extracellular matrix degradation. Biol Chem 391, 321–331. [DOI] [PubMed] [Google Scholar]
- Sotiropoulou G and Pampalakis G (2012) Targeting the kallikrein‐related peptidases for drug development. Trends Pharmacol Sci 33, 623–634. [DOI] [PubMed] [Google Scholar]
- Sotiropoulou G, Pampalakis G and Diamandis EP (2009) Functional roles of human kallikrein‐related peptidases. J Biol Chem 284, 32989–32994. [DOI] [PMC free article] [PubMed] [Google Scholar]
- Stefanini AC, da Cunha BR, Henrique T and Tajara EH (2015) Involvement of kallikrein‐related peptidases in normal and pathological processes. Dis Markers 2015, 946572. [DOI] [PMC free article] [PubMed] [Google Scholar]
- Tailor PD, Kodebovina SK, Bai S, Patel N, Sharma S, Ratnani A, Copland JA, She J‐X and Sharma A (2018) Diagnostic and prognostic biomarker potential of kallikrein family genes in different cancer types. Oncotarget 9, 17876–17888. [DOI] [PMC free article] [PubMed] [Google Scholar]
- Teo CR, Casey PJ and Rasheed SA (2016) The GNA13‐RhoA signaling axis suppresses expression of tumor protective kallikreins. Cell Signal 28, 1479–1488. [DOI] [PubMed] [Google Scholar]
- Vijayakumaran R, Tan KH, Miranda PJ, Haupt S and Haupt Y (2015) Regulation of mutant p53 protein expression. Front Oncol 5, 284. [DOI] [PMC free article] [PubMed] [Google Scholar]
- Wang SM, Mao J, Li B, Wu W and Tang LL (2008) Expression of KLK6 protein and mRNA in primary breast cancer and its clinical significance. Xi Bao Yu Fen Zi Mian Yi Xue Za Zhi 24, 1087–1089. [PubMed] [Google Scholar]
- Xu H, Li M, Zhou Y, Wang F, Li X, Wang L and Fan Q (2015) S100A4 participates in epithelial‐mesenchymal transition in breast cancer via targeting MMP2. Tumour Biol 37, 2925–2932. [DOI] [PubMed] [Google Scholar]
- Zhang Y and Lu H (2009) Signaling to p53: ribosomal proteins find their way. Cancer Cell 16, 369–377. [DOI] [PMC free article] [PubMed] [Google Scholar]
- Zhong Z, Grasso L, Sibilla C, Stevens TJ, Barry N and Bertolotti A (2018) Prion‐like protein aggregates exploit the RHO GTPase to cofilin‐1 signaling pathway to enter cells. EMBO J, 37, pii: e97822. [DOI] [PMC free article] [PubMed] [Google Scholar]
Associated Data
This section collects any data citations, data availability statements, or supplementary materials included in this article.
Supplementary Materials
Fig. S1. Classification of the identified proteins according to Gene Ontology (GO). Pie chart shows the classification of proteins according to the biological processes (A) and cellular component (B). Bar chart shows the distribution of proteins according to the biological processes (C) and cellular component (D) for each clone (PAR, C5, and C28).
Fig. S2. Association of KLK6 and keratins. treeview (A) and list of KRTs (B) and their expression in C28 and C5 cells. Red color indicates higher expression than PAR and green color lower expression. C, In silico correlation of KRT expression with KLK6 expression in breast cancer clinical specimens.
Fig. S3. KLK6 affects the expression of ribosomal proteins. treeview of ribosomal and mitochondrial ribosomal proteins expressed in C28 and C5 cells. Red color indicates higher expression than PAR and green color lower.
Fig. S4. KLK6 expression affects the levels of metalloprotease expression. A, Gelatin zymography of SFCMs obtained from PAR (P), C5, and C28 cells. B, Western blot analysis of MMP9 and MMP2 expression in SFCMs from PAR (P), C5, and C28 cells. C, Expression of MMPs and their inhibitors in SFCMs identified by HPLC‐MS/MS analysis. The numbers on the left indicate the fold increase in C5 SFCM relative to PAR SFCM (P). Secretomics were conducted on SFCMs from C5 and PAR cells. For this, after carefully washing the cells (3 times with PBS and 3 times with SFCM), new SFCMs were added in cells for 48 h. The SFCMs were collected and centrifuged to remove cell debris and stored at −80 °C until the analysis. The detailed secretomic profiling is given in Table S2.
Table S1. Results from proteomic profiling.
Table S2. Results from secretomic profiling.