

Abstract
Background
Primary tumor maximum standardized uptake value is a prognostic marker for non–small cell lung cancer. In the setting of malignancy, bone marrow activity from fluorine 18–fluorodeoxyglucose (FDG) PET may be informative for clinical risk stratification.
Purpose
To determine whether integrating FDG PET radiomic features of the primary tumor, tumor penumbra, and bone marrow identifies lung cancer disease-free survival more accurately than clinical features alone.
Materials and Methods
Patients were retrospectively analyzed from two distinct cohorts collected between 2008 and 2016. Each tumor, its surrounding penumbra, and bone marrow from the L3–L5 vertebral bodies was contoured on pretreatment FDG PET/CT images. There were 156 bone marrow and 512 tumor and penumbra radiomic features computed from the PET series. Randomized sparse Cox regression by least absolute shrinkage and selection operator identified features that predicted disease-free survival in the training cohort. Cox proportional hazards models were built and locked in the training cohort, then evaluated in an independent cohort for temporal validation.
Results
There were 227 patients analyzed; 136 for training (mean age, 69 years ± 9 [standard deviation]; 101 men) and 91 for temporal validation (mean age, 72 years ± 10; 91 men). The top clinical model included stage; adding tumor region features alone improved outcome prediction (log likelihood, −158 vs −152; P = .007). Adding bone marrow features continued to improve performance (log likelihood, −158 vs −145; P = .001). The top model integrated stage, two bone marrow texture features, one tumor with penumbra texture feature, and two penumbra texture features (concordance, 0.78; 95% confidence interval: 0.70, 0.85; P < .001). This fully integrated model was a predictor of poor outcome in the independent cohort (concordance, 0.72; 95% confidence interval: 0.64, 0.80; P < .001) and a binary score stratified patients into high and low risk of poor outcome (P < .001).
Conclusion
A model that includes pretreatment fluorine 18–fluorodeoxyglucose PET texture features from the primary tumor, tumor penumbra, and bone marrow predicts disease-free survival of patients with non–small cell lung cancer more accurately than clinical features alone.
© RSNA, 2019

Summary
A model based on radiomic features extracted from fluorine 18–fluorodeoxyglucose PET/CT images in primary non–small cell lung cancer tumor, tumor penumbra, and bone marrow identified disease-free survival more accurately than clinical features alone.
Key Results
■ A bone marrow and tumor region fluorine 18–fluorodeoxyglucose PET/CT radiomics model was better than the top-performing clinical model of stage for outcome prediction in non–small cell lung cancer (NSCLC; log likelihood, −158 vs −145; P = .001).
■ A fully integrated clinical and radiomics model was a predictor of poor outcome in an independent data set for NSCLC (concordance, 0.72; P < .001).
■ A validated dichotomous score stratified patients into high and low risk for poor outcome in NSCLC (5-year disease-free survival rates in the training and validation cohorts of 88.5% and 60.3%, respectively, in the low-risk group and 44.3% and 0%, respectively, in the high-risk group; P < .001).
Introduction
Fluorine 18–fluorodeoxyglucose (FDG) PET imaging is traditionally used for clinical staging, and tumor uptake has been shown to help predict recurrence in many solid cancers across a diverse set of studies (1–3). Other studies (4–7) investigated the clinical use of quantifying nontumor regions at FDG PET/CT to help predict cancer outcome. For example, bone marrow hypermetabolism is associated with a higher risk of mortality in lung cancer (6–8), and organs of the reticuloendothelial system (eg, spleen and liver) are associated with a higher risk of recurrence in breast cancer (4). To our knowledge, the underlying biologic mechanisms for these associations are not currently well defined, but putatively studied areas identify a systemic response to cancer where glucose metabolism plays a role.
Numerous studies (5,9–11) have shown that the development and maintenance of a systemic inflammatory response is associated with poorer outcomes in patients with cancer. Not surprisingly, blood correlates of this response, as measured by a complete blood cell count in the clinic, including platelets, white blood cells, and lymphocyte ratios, are also associated with cancer outcomes (12).
Conventional radiomic analysis aims to extract quantitative imaging markers and associate them with clinical outcomes (13). Radiomic features such as size, shape, intensity, and texture can describe an imaging phenotype that may indicate underlying biologic characteristics. Because bone marrow uptake at FDG PET/CT has been previously associated (6,7,14) with cancer outcome, we hypothesized that a radiomic analysis of the FDG PET activity in the bone marrow could identify a systemic response and thereby improve the prediction of lung cancer disease-free survival.
Radiomic studies (15) of lung cancer have focused on analyzing the tumor region with FDG PET and CT. Some studies have investigated the integration of basic clinical features such as type of non–small cell lung cancer (NSCLC), stage, or age for improving outcome prediction (16–18). We hypothesized that integrating primary tumor with tumor penumbra and bone marrow PET signal could define a more precise model for identifying poor lung cancer outcome. This could assist clinicians in stratifying patients at a higher risk of recurrence that may benefit from more aggressive adjuvant and personalized treatment options. The purpose of our study was to determine whether integrating FDG PET radiomic features of the primary tumor, tumor penumbra, and bone marrow identifies lung cancer disease-free survival more accurately than clinical features alone.
Materials and Methods
Patient Selection
This study was approved by our institutional review board and was Health Insurance Portability and Accountability Act compliant. Written informed consent was signed by all study participants before participation. No industry partners provided support for this study.
We retrospectively analyzed 291 patients with NSCLC from two prospectively acquired data sets (n = 145 and n = 146) (19). The first data set (training) consisted of consecutive patients with NSCLC referred for surgical resection from 2008 to 2012. This data set is publicly available in the Cancer Imaging Archive (20,21) and FDG PET in a subset of this population was previously investigated for tumor radiomics (n = 145), mutation status (n = 95), and oncogenomic alteration (n = 25) (19,22,23). The second data set (temporal validation) consisted of consecutive patients undergoing definitive therapy as part of an observational imaging marker study from 2010 to 2016. A subgroup of this data has evaluated FDG PET uptake for tumor radiomics (n = 146), genomic alterations (n = 59), and circulating tumor cells (n = 30) (24,25).
For inclusion in our study, we required patients to have undergone an FDG PET/CT examination and had a complete blood cell count performed before treatment. Exclusion criteria resulted in 227 patients for analysis (Fig 1; training, 136 patients; validation, 91 patients).
Figure 1:

Study flowchart shows all patients who were enrolled and all exclusions for the training and validation sets. The outcome was defined as recurrence for curable lung cancer (stage I–IIIA) and progression for incurable lung cancer (stage IIIB or IV). Patients who did not recur or progress were classified as disease free at the time of analysis. CBC = complete blood cell count.
We staged patients by using the American Joint Committee on Cancer seventh edition staging system (26). We used pathologic staging in the training data set and a combination of clinical and pathologic staging in the validation data set. Following treatment, patients were followed with standard clinical protocol. We evaluated disease-free survival to identify poor outcome, and time to event or last known follow-up was determined from the date of pretreatment FDG PET/CT imaging.
FDG PET/CT
FDG PET/CT was performed before definitive treatment by using one of four scanners (Allegro/Gemini TF PET/CT, Phillips Healthcare, Cleveland, Ohio; Biograph mCT, Siemens Healthcare, Erlangen, Germany; Discovery VCT, GE Healthcare, Waukesha, Wis; or Discovery LS PET/CT, GE Healthcare) at one of three local medical centers (Appendix E1 [online]). Glucose levels were checked before the patient underwent PET/CT, and if they were elevated (>200 mg/dL) the patients were rescheduled.
Region-of-Interest Segmentation
All image postprocessing was performed by using commercially available software (MIM version 6.6; MIM Software, Cleveland, Ohio). All segmentations were performed by a postdoctoral scholar (S.A.M., with 7 years of image analysis experience after training) and verification was made by a board-certified physician in nuclear medicine (G.A.D., with 9 years of experience). All investigators were blinded to all clinical data and other imaging test results.
We used the manual three-dimensional spherical threshold tool to segment vertebral bodies with the CT portion of the PET/CT and transferred them onto the FDG PET image by using software (MIM version 6.6; MIM Software). We selected the L3–L5 vertebral bodies because they are the largest, are less sensitive to motion, and were previously explored to assess bone marrow uptake (6–8). To determine the impact of segmentation on radiomic features, we performed an automated two-dimensional dilation and erosion of 2 mm on each of the contours in the training data set to stimulate variability in segmentation (Fig 2).
Figure 2:

Mapping the bone marrow in patients with non–small cell lung cancer for radiomics features. Axial, sagittal, and coronal cross-sections of L3, L4, and L5 vertebral body segmentations from a CT (top row), PET (middle row), and fused PET/CT (bottom row). Regions of interest on each image show the original manual threshold-based segmentation (magenta), the 2-mm erosion (blue), and the 2-mm dilation (yellow). A = anterior, L = left, P = posterior, R = right.
The metabolic tumor volume (MTV) was segmented on the FDG PET images by using MIM (MIM Software) with the PET edge gradient-based semiautomatic segmentation tool (19). We defined and extracted the three-dimensional penumbra region, which bordered the MTV segmentation and extended 1 cm beyond it. Thus, three tumor regions were investigated: the MTV, the penumbra only, and the union of the MTV and penumbra regions. A previous study (19) reported the variability in MTV and penumbra segmentations.
Feature Extraction
We extracted radiomic features from the FDG PET images by using the Quantitative Image Feature Engine, implemented in the commercially available software (Matlab R2016Bl Mathworks, Natick, Mass) and available online (https://github.com/riipl/3d_qifp, commit 94c3d12) (27). Additional details on feature extraction are provided in Appendix E1 (online).
Feature Model Building and Selection
To determine the optimal features for predicting disease-free survival in the training data set, we built a generalized linear model with the least absolute shrinkage and selection operator (LASSO) by using the glmnet package on clinical features only (Appendix E1 [online]). We then added radiomic features to the baseline clinical model to assess model improvement by using LASSO. From these identified features, we built and compared univariable and multivariable Cox proportional hazard models in the training data set to identify the best-performing model. We locked and independently evaluated the top multivariable model in the temporal validation data set.
Statistical Analysis
We assessed demographic differences by using a Wilcoxon rank-sum test for continuous variables and χ2 test for categorical variables. We applied z score transformation to all radiomic features before building the model. To determine robust features, we calculated intraclass correlation coefficients for each radiomic feature in the training cohort, and robust features with an intraclass correlation coefficient greater than 0.8 were selected for further analysis (28,29).
We used open-source software (R, version 3.4.3; R Project for Statistical Computing, Vienna, Austria) for feature selection, model building, and evaluation (30). The likelihood ratio P value was assessed to indicate a statistically significant result. We tabulated the Akaike information criterion and performed the likelihood ratio test to compare nested models. We used the concordance index to assess prognostic value and the Noether test to determine statistical significance. We also performed Kaplan-Meier analysis on the basis of risk scores generated from the locked multivariable model by dichotomizing groups into high and low risk on the basis of median risk prediction score determined in the training data set. Statistical significance was indicated by a P value less than .05.
Results
Patient Demographics
We analyzed a total of 227 patients, including 136 patients in the training cohort (mean age, 69 years ± 9 [standard deviation]; 101 men) and 91 patients in the validation cohort (mean age, 72 years ± 10; 91 men). Patients in the training and validation cohorts were well matched for type of NSCLC (P = .49), smoking status (P = .14), and tumor location (P = .33) (Table 1). The training cohort was slightly younger (P = .03) and had a higher percentage of men (P = .01). There was also a difference in stage distribution across the data sets (P = .007), however, there was no difference in the proportion of patients who recurred or progressed (P = .10).
Table 1:
Baseline Patient and Lesion Characteristics
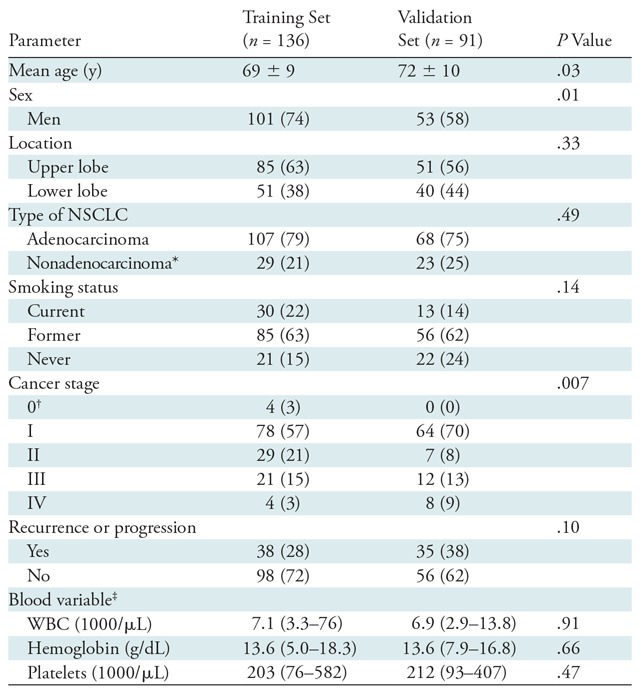
Note.—Unless otherwise indicated, data are number of patients and data in parentheses are percentages. Mean data are ± standard deviation. NSCLC = non–small cell lung cancer, WBC = white blood cells.
*Includes squamous cell or non–small cell cancer not otherwise specified.
†Pathologic stage 0 disease is defined as a carcinoma in situ (TisN0M0) as per the American Joint Committee on Cancer seventh edition staging system.
‡Data are median and data in parentheses are range.
The median disease-free survival was 15 months (range, 1–95 months): 13 months (range, 2–95 months) in the training cohort and 15 months (range, 1–58 months) in the validation cohort. The median follow-up time for censored patients without an event was 41 months (range, 1–113 months): 49 months (range, 1–113 months) in the training and 33 months (range, 1–74 months) in the validation cohort.
Imaging Feature Robustness
Despite the relatively large differences in bone segmentations with the expansion and contraction (Fig 2), bone marrow radiomic features were highly robust, and 96.8% (151 of 156) of features had an intraclass correlation coefficient greater than 0.8 (Table 2). The robustness of the MTV, penumbra, and MTV with penumbra features are shown in Table 2 (19).
Table 2:
Number of Extracted and Robust Features within each Region of Interest
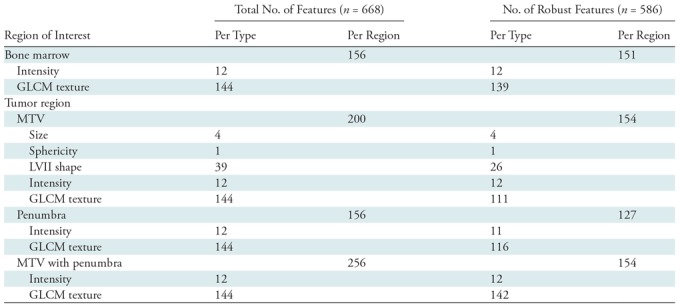
Note.—Data are number of features. Robust features refer to those with an intraclass correlation coefficient > 0.8. GCLM = gray-level co-occurrence matrix, MTV = metabolic tumor volume, LVII = local volume invariant integral.
Clinical Model for Identifying Outcome in NSCLC
From 11 clinical features analyzed (Table 3), stage was the only univariable predictor of poor outcome in the training data set (hazard ratio, 1.93 [95% confidence interval: 1.47, 2.53]; Akaike information criterion, 318.1; likelihood ratio, 20.2 [P < .001]). No other clinical variables or blood parameters were univariable predictors (Table 3; P > .05). When LASSO was used to select the best multivariable model, only one clinical feature (stage) was chosen (λ = 0.0831; cross-validation error rate, 10.3%).
Table 3:
Cox Proportional Hazards Model Statistics for Univariable Features in the Training Cohort
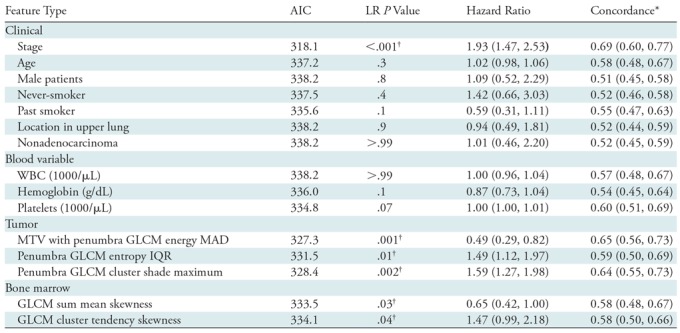
Note.—Data in parentheses are 95% confidence intervals. AIC = Akaike information criterion, GLCM = gray-level co-occurrence matrix, IQR = interquartile range, LR = likelihood ratio, MAD = mean absolute deviation, MTV = metabolic tumor volume, WBC = white blood cell.
*The probability that for a pair of randomly chosen samples the sample with the higher risk prediction will experience an event before the other sample.
†Statistically significant (P < .05).
Addition of FDG PET Tumor Region Radiomic Features
LASSO identified four features when tumor region radiomic features were integrated with clinical features (λ = 0.0955; cross-validation error rate, 10.4%): stage, one MTV with penumbra gray-level co-occurrence matrix (GLCM) texture feature (energy mean absolute deviation), and two penumbra GLCM texture features (entropy interquartile range and cluster shade maximum). All three imaging features were univariable predictors (all P < .01), and the MTV with penumbra texture feature was the best predictor with the lowest Akaike information criterion value of 327.3 (Table 3). Figure 3 demonstrates the qualitative meaning behind this GLCM energy texture feature with a hazard ratio less than 1. Adding tumor region features to the clinical model of stage improved model performance (log likelihood, −152 vs −158, respectively; P = .007).
Figure 3:

Clinical interpretation of texture features at fluorodeoxyglucose (FDG) PET. A, A homogeneous image and, B, a heterogeneous image are shown with their corresponding gray-level co-occurrence matrices (GLCMs) and texture values for an FDG PET image. GLCM examines the co-occurrence of intensity pairs between all neighboring pixels in an image. For example, A, there are many light pixels neighboring likewise light pixels, therefore there is a peak in the GLCM at lower pixel intensities. The energy radiomics feature calculates the sum of squares of the GLCM. Thus, because the texture in the image is more heterogeneous, the energy texture value is lower, B. This feature in the tumor with penumbra had a hazard ratio less than 1, indicating that greater heterogeneity at FDG PET imaging indicates a higher risk of poor outcome.
Addition of FDG PET Bone Marrow Radiomic Features
When integrating bone marrow features with tumor, penumbra, and clinical features in the LASSO, it selected six features (λ = 0.0955; cross-validation error rate, 10.4%): cancer stage, two bone marrow texture features, one MTV with penumbra texture feature, and two penumbra texture features. Both bone marrow features were univariable predictors (P < .04). The multivariable model that incorporated features selected by LASSO was a predictor of poor outcome (likelihood ratio, 45.8 [P < .001]; Akaike information criterion, 302.4) with a concordance of 0.78 (95% confidence interval: 0.70, 0.85). To account for any abnormal blood counts, we added blood parameters as covariates when building the multivariable model and found no difference in model performance (likelihood ratio test P = .99; concordance, 078 [95% confidence interval: 0.70, 0.85]; likelihood ratio, 45.9 [P < .001]; Akaike information criterion, 308.4). Both before and after adjustment for blood parameters, stage (P < .001) and the two bone marrow radiomic features (P < .05) were significant variables in identifying outcome (Table 4).
Table 4:
Cox Proportional Hazards Model Statistics for the Top-performing Multivariable Model in the Training Cohort
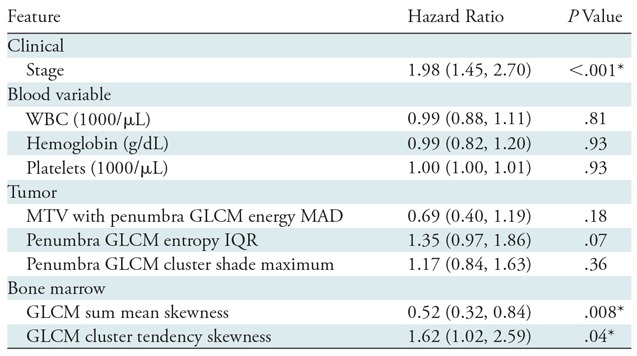
Note.—Data in parentheses are 95% confidence intervals. GLCM = gray-level co-occurrence matrix, IQR = interquartile range, MAD = mean absolute deviation, MTV = metabolic tumor volume, WBC = white blood cells.
*Statistically significant (P < .05).
Bone marrow imaging features demonstrated modest correlation with tumor imaging features, clinical variables, and blood parameters (Fig 4, all Pearson correlation < |0.35|; P > .04), suggesting that imaging features provide complementary information for outcome prediction. To confirm that this model performance was not an age-related phenomenon, we examined age as a covariate and found there was no impact on the model performance (log likelihood, −144 vs −145, respectively; P = .12).
Figure 4:

Radiomic imaging and clinical features are not well correlated. Pearson correlation coefficient heatmap for all features in the final radiomic model, including stage, blood variables, bone marrow, and tumor region radiomics. The color scheme that shows the degree of correlation is displayed on the right axis. GLCM = gray-level co-occurrence matrix, MTV = metabolic tumor volume, WBC = white blood cells.
We found that the fully integrated model outperformed the tumor features and clinical stage model (log likelihood, −145 vs −152, respectively; P = .02). This model also outperformed the model of stage alone (log likelihood, −145 vs −158, respectively; P = .001) and shows the added prognostic value of combining multiple regions of pretreatment FDG PET radiomic information for refining prognosis.
Fully Integrated Model Validation for Identifying Outcome in NSCLC
Next, we locked the coefficients and variables in the fully integrated model and evaluated the model by using our validation data set. We found that the model validated as a predictor of poor outcome (concordance, 0.72; 95% confidence interval: 0.64, 0.80; Noether P < .001). The fully integrated radiomic model separated patients into high and low risk of poor outcome (P < .001; Fig 5). The 5-year disease-free survival rates in the training and validations cohorts were, respectively, 88.5% and 60.3% in the low-risk group and 44.3% and 0% in the high-risk group. When comparing 5-year disease-free survival rates of stage to the fully integrated radiomic model (Fig E1 [online]) we see lower disease-free survival rates in the training and validation cohorts in the low-risk group (78.2% and 42.6%, respectively). Figure 6 is an example of two patients from the validation data set whose outcomes were correctly predicted and had visibly different bone marrow uptake. We noticed that study participants with greater heterogeneous texture in the tumor, surrounding region, and bone marrow were likely to have a poor outcome.
Figure 5:

A radiomics risk score stratifies patients with good versus poor outcome into two data sets. Kaplan-Meier curves for the fully integrated multivariable model that included stage, bone marrow radiomics, tumor radiomics, and blood variables in the, A, training cohort (n = 136; P < .001) and, B, validation cohort (n = 91; P < .001). Patients were stratified on the basis of the median risk value in the training cohort. The shaded regions represent the 95% confidence intervals. The 5-year disease-free survival in the training and validation cohorts were 88.5% and 60.3%, respectively, in the low-risk group and 44.3% and 0%, respectively, in the high-risk group. + = censored data.
Figure 6:

A visual example of the value of bone marrow radiomics. A, B, Example sagittal CT (left), corresponding PET (middle), and fused PET/CT images (right) for two patients, on which the L3–L5 vertebral bodies are circled (magenta). The fully integrated model correctly predicted, A, the patient who was high risk and stage I with recurrence at 12-month follow-up and, B, the patient who was low risk and stage III without recurrence at 2.5-year follow-up. Qualitatively, patients who were high risk tended to have higher heterogeneous uptake in the bone marrow. Both PET images are shown with a window of 10 standardized uptake value units and level of 5 standardized uptake value units.
Discussion
Bone marrow uptake at fluorine 18–fluorodeoxyglucose (FDG) PET/CT was previously associated with cancer outcome (6,7,14). We proposed that a radiomic analysis of the FDG PET activity in the bone marrow could identify a systemic response and thereby improve the prediction of lung cancer outcome. We demonstrated that combining bone marrow features with cancer stage, tumor, and tumor penumbra radiomic features improves prognostic accuracy over stage alone (log likelihood, −145 vs −158; P = .001). This model was a predictor of poor outcome in an independent data set of patients with non–small cell lung cancer (NSCLC) (concordance, 0.72; P < .001) and demonstrated the ability to stratify patients into high and low risk for poor outcome (Kaplan-Meier P < .001).
In our study, we analyzed radiomic features within the bone marrow, integrated these features with clinically relevant data, adjusted for hematologic confounding variables (eg, anemia), and harnessed additional imaging data from the tumor and its penumbra to improve prognosis for patients with NSCLC. We also demonstrated that bone marrow radiomic features remain stable after expansion and contraction of the contours with high intraclass correlation coefficient values. This supports continued inquiries into semiautomatic or fully automatic segmentations of the vertebral body that would be beneficial to reduce the amount of processing time.
Textural analysis on FDG PET images identified GLCM features in the MTV with penumbra region to predict poor outcome. This suggests the importance of investigating features outside the tumor for improved prognostic models. Our findings are consistent with other radiomic studies that demonstrate the importance of peritumoral radiomic features at PET or CT for outcome prediction (19,31–33). These results are also consistent with previous studies (7,8) showing that a higher mean standardized uptake value in the bone marrow at diagnosis indicates poorer outcomes.
Previous work (34–36) has shown that FDG uptake in the bone marrow is associated with altered serum cytokine, C-reactive protein, and hematologic parameters. On the basis of our results and biologic plausibility, whole-body radiomics or deep learning with FDG PET examinations, which are performed routinely in the clinic from thigh to skull as so-called off-the-shelf PET/CT imaging data, may improve prognosis in NSCLC (4). Additionally, a next step of inquiry would be to integrate markers of systemic inflammation with this type of analysis.
Another strength of our study was including hematologic parameters for analysis. Because other studies have shown that hematologic parameters are associated with outcomes in cancer (12) and because hematologic derangements can affect bone marrow metabolism, we restricted our analysis to patients who had complete blood cell count counts available within 90 days of our study. Although none of these parameters were statistically significant univariable predictors of poor outcome, we were able to demonstrate that they did not affect the results of our analysis.
Our study had several limitations. We included patients enrolled largely from one medical center. The model was only investigated in a temporal validation cohort, and we did not perform any additional model tuning by using an external testing cohort. We also did not analyze patient diabetic status, body mass index, genetic markers, and specific pack-years of smoking history, which may impact bone marrow metabolism and outcome prediction. Future studies validating these results on larger and more diverse data sets is therefore warranted.
Investigation of these radiomic features by using other scanners and with additional external cohorts from other institutions is needed to assess the generalizability of our classifier in a real-world setting. We only evaluated first and second order GLCM texture features, but higher order features, such as wavelet, Law features, or deep learning, may improve predictive performance (15). Although we investigated three lumbar vertebrae per previous literature reports (6–8), the use of more or fewer vertebrae and/or other hematopoietic structures in the body may be useful. Also, because standardized uptake value quantitation can vary on the basis of a number of factors, normalization of standardized uptake value units to the blood pool may also be needed.
We found that a radiomics model that includes the clinical stage and image features from the bone marrow, tumor, and its surrounding region at pretreatment fluorine 18–fluorodeoxyglucose PET/CT identified patient outcome in non–small cell lung cancer better than stage alone. This model uses clinical and imaging data that can be collected for these patients and is ready for further validation. However, additional studies investigating the underlying biology responsible for these imaging phenotypes are needed.
APPENDIX
SUPPLEMENTAL FIGURES
Acknowledgments
Acknowledgments
The authors acknowledge MIM Software for their assistance with software.
Current address: Clinical Research Division, Fred Hutchinson Cancer Research Center; Division of Pulmonary, Critical Care & Sleep Medicine, University of Washington School of Medicine, Seattle, Wash.
Disclosures of Conflicts of Interest: S.A.M. disclosed no relevant relationships. G.A.D. disclosed no relevant relationships. J.B. disclosed no relevant relationships. A.N.C.L. disclosed no relevant relationships. M.V. disclosed no relevant relationships. G.H. disclosed no relevant relationships. J.B.S. Activities related to the present article: disclosed no relevant relationships. Activities not related to the present article: disclosed money paid to author for consultancy from Benton Dickinson; disclosed money paid to author for expert testimony from various law firms; disclosed grants/grants pending from Benton Dickinson; disclosed two patents for prevention of muscle atrophy and a potential treatment for lung cancer. Other relationships: disclosed no relevant relationships. S.N. Activities related to the present article: disclosed no relevant relationships. Activities not related to the present article: disclosed money paid to author for membership on the scientific advisory boards of Fovia and Radlogics; disclosed money paid to author for consultancy from Carestream. Other relationships: disclosed no relevant relationships. V.S.N. disclosed no relevant relationships.
Abbreviations:
- FDG
- fluorodeoxyglucose
- GLCM
- gray-level co-occurrence matrix
- LASSO
- least absolute shrinkage and selection operator
- MTV
- metabolic tumor volume
- NSCLC
- non–small cell lung cancer
References
- 1.Nair VS, Barnett PG, Ananth L, Gould MK; Veterans Affairs Solitary Nodule Accuracy Project Cooperative Studies Group. PET scan 18F-fluorodeoxyglucose uptake and prognosis in patients with resected clinical stage IA non-small cell lung cancer. Chest 2010;137(5):1150–1156. [DOI] [PubMed] [Google Scholar]
- 2.Berghmans T, Dusart M, Paesmans M, et al. Primary tumor standardized uptake value (SUVmax) measured on fluorodeoxyglucose positron emission tomography (FDG-PET) is of prognostic value for survival in non-small cell lung cancer (NSCLC): a systematic review and meta-analysis (MA) by the European Lung Cancer Working Party for the IASLC Lung Cancer Staging Project. J Thorac Oncol 2008;3(1):6–12. [DOI] [PubMed] [Google Scholar]
- 3.Liu J, Dong M, Sun X, Li W, Xing L, Yu J. Prognostic value of 18F-FDG PET/CT in surgical non-small cell lung cancer: a meta-analysis. PLoS One 2016;11(1):e0146195. [DOI] [PMC free article] [PubMed] [Google Scholar]
- 4.Bang JI, Yoon HJ, Kim BS. Clinical utility of FDG uptake within reticuloendothelial system on F-18 FDG PET/CT for prediction of tumor recurrence in breast cancer. PLoS One 2018;13(12):e0208861. [DOI] [PMC free article] [PubMed] [Google Scholar]
- 5.Bural GG, Torigian DA, Chen W, Houseni M, Basu S, Alavi A. Increased 18F-FDG uptake within the reticuloendothelial system in patients with active lung cancer on PET imaging may indicate activation of the systemic immune response. Hell J Nucl Med 2010;13(1):23–25. [PubMed] [Google Scholar]
- 6.Lee JW, Na JO, Kang DY, Lee SY, Lee SM. Prognostic Significance of FDG Uptake of Bone Marrow on PET/CT in Patients With Non-Small-Cell Lung Cancer After Curative Surgical Resection. Clin Lung Cancer 2017;18(2):198–206. [DOI] [PubMed] [Google Scholar]
- 7.Prévost S, Boucher L, Larivée P, Boileau R, Bénard F. Bone marrow hypermetabolism on 18F-FDG PET as a survival prognostic factor in non-small cell lung cancer. J Nucl Med 2006;47(4):559–565. [PubMed] [Google Scholar]
- 8.Lee JW, Seo KH, Kim ES, Lee SM. The role of 18F-fluorodeoxyglucose uptake of bone marrow on PET/CT in predicting clinical outcomes in non-small cell lung cancer patients treated with chemoradiotherapy. Eur Radiol 2017;27(5):1912–1921. [DOI] [PubMed] [Google Scholar]
- 9.Roxburgh CS, McMillan DC. Cancer and systemic inflammation: treat the tumour and treat the host. Br J Cancer 2014;110(6):1409–1412. [DOI] [PMC free article] [PubMed] [Google Scholar]
- 10.Roxburgh CS, McMillan DC. Role of systemic inflammatory response in predicting survival in patients with primary operable cancer. Future Oncol 2010;6(1):149–163. [DOI] [PubMed] [Google Scholar]
- 11.Forrest LM, McMillan DC, McArdle CS, Angerson WJ, Dunlop DJ. Evaluation of cumulative prognostic scores based on the systemic inflammatory response in patients with inoperable non-small-cell lung cancer. Br J Cancer 2003;89(6):1028–1030. [DOI] [PMC free article] [PubMed] [Google Scholar]
- 12.Jeong E, Hyun SH, Moon SH, Cho YS, Kim BT, Lee KH. Relation between tumor FDG uptake and hematologic prognostic indicators in stage I lung cancer patients following curative resection. Medicine (Baltimore) 2017;96(5):e5935. [DOI] [PMC free article] [PubMed] [Google Scholar]
- 13.Gillies RJ, Kinahan PE, Hricak H. Radiomics: images are more than pictures, they are data. Radiology 2016;278(2):563–577. [DOI] [PMC free article] [PubMed] [Google Scholar]
- 14.Jeong SY, Kim SJ, Pak K, Lee SW, Ahn BC, Lee J. Prognostic value of 18F-fluorodeoxyglucose bone marrow uptake in patients with solid tumors: A meta-analysis. Medicine (Baltimore) 2018;97(43):e12859. [DOI] [PMC free article] [PubMed] [Google Scholar]
- 15.Shi L, He Y, Yuan Z, et al. Radiomics for Response and Outcome Assessment for Non-Small Cell Lung Cancer. Technol Cancer Res Treat 2018;17:1533033818782788. [DOI] [PMC free article] [PubMed] [Google Scholar]
- 16.Pyka T, Bundschuh RA, Andratschke N, et al. Textural features in pre-treatment [F18]-FDG-PET/CT are correlated with risk of local recurrence and disease-specific survival in early stage NSCLC patients receiving primary stereotactic radiation therapy. Radiat Oncol 2015;10(1):100. [DOI] [PMC free article] [PubMed] [Google Scholar]
- 17.Wu J, Aguilera T, Shultz D, et al. Early-Stage Non-Small Cell Lung Cancer: Quantitative Imaging Characteristics of (18)F Fluorodeoxyglucose PET/CT Allow Prediction of Distant Metastasis. Radiology 2016;281(1):270–278. [DOI] [PMC free article] [PubMed] [Google Scholar]
- 18.Fried DV, Mawlawi O, Zhang L, et al. Stage III non–small cell lung cancer: prognostic value of FDG PET quantitative imaging features combined with clinical prognostic factors. Radiology 2016;278(1):214–222. [DOI] [PMC free article] [PubMed] [Google Scholar]
- 19.Mattonen SA, Davidzon GA, Bakr S, et al. [18F] FDG Positron Emission Tomography (PET) Tumor and Penumbra Imaging Features Predict Recurrence in Non-Small Cell Lung Cancer. Tomography 2019;5(1):145–153. [DOI] [PMC free article] [PubMed] [Google Scholar]
- 20.Bakr S, Gevaert O, Echegaray S, et al. A radiogenomic dataset of non-small cell lung cancer. Sci Data 2018;5(1):180202. [DOI] [PMC free article] [PubMed] [Google Scholar]
- 21.Clark K, Vendt B, Smith K, et al. The Cancer Imaging Archive (TCIA): maintaining and operating a public information repository. J Digit Imaging 2013;26(6):1045–1057. [DOI] [PMC free article] [PubMed] [Google Scholar]
- 22.Minamimoto R, Jamali M, Gevaert O, et al. Prediction of EGFR and KRAS mutation in non-small cell lung cancer using quantitative 18F FDG-PET/CT metrics. Oncotarget 2017;8(32):52792–52801. [DOI] [PMC free article] [PubMed] [Google Scholar]
- 23.Nair VS, Gevaert O, Davidzon G, et al. Prognostic PET 18F-FDG uptake imaging features are associated with major oncogenomic alterations in patients with resected non-small cell lung cancer. Cancer Res 2012;72(15):3725–3734. [DOI] [PMC free article] [PubMed] [Google Scholar]
- 24.Nair VS, Keu KV, Luttgen MS, et al. An observational study of circulating tumor cells and (18)F-FDG PET uptake in patients with treatment-naive non-small cell lung cancer. PLoS One 2013;8(7):e67733. [DOI] [PMC free article] [PubMed] [Google Scholar]
- 25.Carlsson A, Nair VS, Luttgen MS, et al. Circulating tumor microemboli diagnostics for patients with non-small-cell lung cancer. J Thorac Oncol 2014;9(8):1111–1119. [DOI] [PMC free article] [PubMed] [Google Scholar]
- 26.Edge SB, Compton CC. The American Joint Committee on Cancer: the 7th edition of the AJCC cancer staging manual and the future of TNM. Ann Surg Oncol 2010;17(6):1471–1474. [DOI] [PubMed] [Google Scholar]
- 27.Echegaray S, Bakr S, Rubin DL, Napel S. Quantitative Image Feature Engine (QIFE): an open-source, modular engine for 3D quantitative feature extraction from volumetric medical images. J Digit Imaging 2018;31(4):403–414. [DOI] [PMC free article] [PubMed] [Google Scholar]
- 28.Parmar C, Rios Velazquez E, Leijenaar R, et al. Robust Radiomics feature quantification using semiautomatic volumetric segmentation. PLoS One 2014;9(7):e102107. [DOI] [PMC free article] [PubMed] [Google Scholar]
- 29.Pavic M, Bogowicz M, Würms X, et al. Influence of inter-observer delineation variability on radiomics stability in different tumor sites. Acta Oncol 2018;57(8):1070–1074. [DOI] [PubMed] [Google Scholar]
- 30.R Core Team. R : A language and environment for statistical computing. Vienna, Austria: R Foundation for Statistical Computing, 2013. [Google Scholar]
- 31.Hao H, Zhou Z, Li S, et al. Shell feature: a new radiomics descriptor for predicting distant failure after radiotherapy in non-small cell lung cancer and cervix cancer. Phys Med Biol 2018;63(9):095007. [DOI] [PMC free article] [PubMed] [Google Scholar]
- 32.Dou TH, Coroller TP, van Griethuysen JJM, Mak RH, Aerts HJWL. Peritumoral radiomics features predict distant metastasis in locally advanced NSCLC. PLoS One 2018;13(11):e0206108. [DOI] [PMC free article] [PubMed] [Google Scholar]
- 33.Tunali I, Stringfield O, Guvenis A, et al. Radial gradient and radial deviation radiomic features from pre-surgical CT scans are associated with survival among lung adenocarcinoma patients. Oncotarget 2017;8(56):96013–96026. [DOI] [PMC free article] [PubMed] [Google Scholar]
- 34.Inoue K, Goto R, Okada K, Kinomura S, Fukuda H. A bone marrow F-18 FDG uptake exceeding the liver uptake may indicate bone marrow hyperactivity. Ann Nucl Med 2009;23(7):643–649. [DOI] [PubMed] [Google Scholar]
- 35.Van de Wiele C, VandeVyver F, Debruyne C, Philippé J, van Meerbeeck JP. FDG uptake by the bone marrow in NSCLC patients is related to TGF-β but not to VEGF or G-CSF serum levels. Eur J Nucl Med Mol Imaging 2008;35(3):519–522. [DOI] [PubMed] [Google Scholar]
- 36.Núñez R, Rini JN, Tronco GG, Tomas MB, Nichols K, Palestro CJ. Correlation of hematologic parameters with bone marrow and spleen uptake in FDG PET [in Spanish]. Rev Esp Med Nucl 2005;24(2):107–112. [DOI] [PubMed] [Google Scholar]
Associated Data
This section collects any data citations, data availability statements, or supplementary materials included in this article.