

Abstract
Protein posttranslational modifications (PTMs) have typically been studied independently, yet many proteins are modified by more than one PTM type, and cell signaling pathways somehow integrate this information. We coupled immunoprecipitation using PTM-specific antibodies with Tandem Mass Tag (TMT) mass spectrometry to simultaneously examine phosphorylation, methylation, and acetylation in 45 lung cancer cell lines compared to normal lung tissue and to cell lines treated with anti-cancer drugs. This simultaneous, large-scale, integrative analysis of these PTMs using a cluster-filtered network (CFN) approach revealed that cell signaling pathways were outlined by clustering patterns in PTMs. We used the t-distributed stochastic neighbor embedding (t-SNE) method to identify PTM clusters and then integrated each with known protein-protein interactions (PPIs) to elucidate functional cell signaling pathways. The CFN identified known and previously unknown cell signaling pathways in lung cancer cells that were not present in normal lung epithelial tissue. In various proteins modified by more than one type of PTM, the incidence of those PTMs exhibited inverse relationships, suggesting that molecular exclusive “OR” gates determine a large number of signal transduction events. We also showed that the acetyltransferase EP300 appears to be a hub in the network of pathways involving different PTMs. In addition, the data shed light on the mechanism of action of geldanamycin, a HSP90 inhibitor. Together the findings reveal that cell signaling pathways mediated by acetylation, methylation, and phosphorylation regulate the cytoskeleton, membrane traffic, and RNA-binding protein-mediated control of gene expression.
Introduction
Proteins covalently attach moieties such as phosphate, methyl and acetyl groups to other proteins to regulate cell signaling events crucial for all cellular physiological functions, including differentiation, proliferation, cell movement, and cell death. In many human diseases, these cell signaling mechanisms go awry (1). Much progress has been made in identifying proteins that attach (writers), recognize (readers), and remove (erasers) different posttranslational modifications (PTMs) (2), and our understanding of these mechanisms has led to the development of targeted therapeutics, such as cancer treatments that target kinases (3), histone deacetylases (4), and bromodomains, which are the associated structures of readers of acetylation (5, 6).
The canonical view of PTMs is that protein acetylation and methylation are mainly involved in epigenetic chromatin modifications, while signal transduction pathways are mainly regulated via phosphorylation. This view dominated the field mainly because different modification types have been typically studied independently. However, there is now increasing appreciation that histones are not the only class of proteins affected by acetylation and methylation (4, 7). This means that drugs targeting enzymes responsible for regulating methylation and acetylation of histones may have a much broader effect. It is therefore important to understand in detail molecular signaling pathways that involve these PTMs. In addition, further understanding of cell signaling pathways will provide new opportunities for therapeutic intervention. For example, multiple PTMs are involved in signaling cascades that are linked to neurological disorders (8) and the innate immune response (9).
Here, we sought to understand molecular signaling pathways that are active in lung tumor-derived cell lines by simultaneously examining patterns of protein phosphorylation, methylation, and acetylation on a large scale. The data we collected provide a unique opportunity for an integrated study of cell signaling networks involving these three different PTMs. Our goal is to define the relationship between kinases, phosphatases, acetyltransferases, deacetylases, methyltransferases, and demethylases. Our approach was to integrate two different kinds of information: clustering based on statistical relationships among various types of PTMs, and protein-protein interactions data from public databases (10).
The sequencing of the human genome provided a parts list of many of the molecular constituents that make up the human cell, but we still have a limited understanding about how these parts interact and are organized into functional complexes to regulate the cell signaling pathways that govern molecular biological processes. Protein-protein interaction (PPI) databases attempt to catalog how proteins interact with one another, and how these interactions are organized into networks (11–16). Networks are useful to model signal transduction pathways (17–22), but these models are difficult to understand and validate because such models are complex, they integrate information from a variety of sources, and commonly are not specific to a particular tissue or cell type in the proper context. They also suffer from biases, such as literature focus biases or experimental platform biases. Here, we hypothesized that empirical information about PTMs may be used to constrain the complexity of cell signaling models to better understand the system under study (10, 23). We reasoned that clustering of PTMs under different conditions reveals patterns specific to the system, in this case, lung cancer cell lines. Clusters identified by statistical relationships that contain proteins known to interact likely represent functional cell signaling pathways. This data-driven modeling approach (24) is somewhat analogous to using gene co-expression data to identify cell signaling pathways in yeast (25). However, PTMs are much closer to cell signaling events than mRNA co-expression, which makes our approach more likely to identify cell signaling events upstream of gene expression changes (10).
We used immunoprecipitation with antibodies specific for tyrosine and serine/threonine phosphorylation, lysine acetylation, and lysine and arginine methylation, coupled with mass spectrometry. This technique was originally described to study only phosphorylated proteins (10, 26–28). Mass spectrometry determines the identity of peptides with modified residues, and the relative amounts of these peptides. This method has a low false positive rate, but a high false negative rate. This is mainly due to stochastic sampling of peptides for detection and subsequent fragmentation (29–33). This limitation of mass spectrometry introduces two challenges: (i) the resulting data has a large number of missing values; and (ii) comparing experimental conditions is difficult when peptides are stochastically detected. Tandem Mass Tag (TMT) experiments surmount the latter issue by labelling samples with different isotopic mass tags, and mixing them, so that when a peptide is selected by the mass spectrometer, different tags are resolved upon subsequent fragmentation (34). This allows direct comparison of peptide amounts in multiplexed samples and accurate calculation of treatment-to-control ratios within a TMT multiplex. When comparing two or more TMT runs, however, there are still a large fraction of missing values because of the stochastic nature of detection. Therefore, the TMT data are different from gene expression data derived from microarray or RNA-seq experiments, and thus require special considerations for data analysis (Text S1). Building on previous work (10, 23), we evaluated different methods for handling these data, which can be grouped into three approaches: imputing missing values, pairwise-complete, and penalized matrix decomposition. Statistical relationships (Spearman correlation; Euclidean distance) were embedded into a reduced dimension representation using t-distributed stochastic neighbor embedding (t-SNE), which is effective in identifying clusters in a wide variety of non-linear real-world and biological data (10, 23, 35–38). Penalized matrix decomposition followed by an additional t-SNE step further resolved large clusters to produce a co-clustered correlation network (CCCN) for strongly associated modifications. This clustering method was used to decipher cell signaling pathways by filtering PPI edges to retain only interactions between proteins whose modifications co-clustered, creating a cluster-filtered network (CFN). The CFN and CCCN data structures were further evaluated in a number of ways, and then used to outline cell signaling pathways, starting from the target proteins that are affected by drugs. The analysis highlights molecular pathways defined by highly correlated clusters of PTMs, and revealed antagonistic relationships among PTMs that were negatively correlated. Signaling pathways that are regulated by multiple PTMs involve heat shock, RNA binding, cytoskeletal, and membrane trafficking proteins that are linked to canonical tyrosine kinase pathways.
Results
Clustering PTMs
Our goal was to use large scale mass spectrometry data to integrate cell signaling pathways that involve protein phosphorylation, methylation, and acetylation. We hypothesized that proteins that interact with one another and are posttranslationally modified in patterns identified by close statistical relationships likely represent functional cell signaling pathways. We therefore combined PTM clustering information with PPI databases to create the CFN. The CFN only retains PPIs whose modifications co-cluster (Figure 1A). The resulting network only retained interactions between proteins that are also supported by protein modification data (10).
Figure 1. Data acquisition and analysis.

(A) A cluster-filtered network (CFN) was created by using a machine learning, pattern recognition algorithm (t-SNE) to identify which posttranslational modifications (PTMs) clustered together, filtering protein-protein interactions (PPIs; red edges) to retain only those between proteins whose PTMs co-clustered. (B) Outline of TMT mass spectrometry coupled with immunoprecipitation using modification-specific antibodies. Phospho-Ser/Thr (S/T) peptide immunoprecipitation was accomplished in multiple steps with AGC/PSD-family kinase substrate, AKT substrate, AMP kinase substrate, and ATM/ATR substrate antibodies (see Materials and Methods). Phosphopeptides were also further purified on a TiO2 column (82). (C) Bird’s-eye view of the co-cluster correlation network (CCCN) derived from posttranslational modifications from 15 independent experiments, each with 6 multiplex samples, from comparison of 45 lung cancer cell lines (12 derived from SCLC and 33 from NSCLC) to normal lung tissue, and selected cell lines treated with anti-cancer drugs. This disconnected network includes threshold-filtered Spearman correlations among t-SNE-clustered PTMs (yellow edges are positive correlations; blue are negative correlations). Also shown are negative correlations among different modification types within the same protein, which are useful for revealing antagonistic relationships among PTMs. Node size and color reflects total of all PTM ratios in the data set (fold change key). This network is available for download as Supplementary File 1, and on the NDEx repository (https://doi.org/10.18119/N9F59Z). This network combined with the CFN that contains filtered PPI edges may be explored at https://cynetworkbrowser.umt.edu/.
PTM data were obtained using immunoprecipitation with antibodies that are non-specific to individual proteins but specific to PTMs and combined with Tandem Mass Tag (TMT) mass spectrometry (Figure 1B). 45 lung cancer cell lines were compared to normal lung tissue in nine multiplex runs. In addition, selected lung cancer cell lines were treated with the anti-cancer drugs crizotinib, gefitinib, gleevec, and geldanamycin in six multiplex runs. Because each experiment represents a different state of the lung cancer cell line signaling system, and because combining data from different cell lines improves the quality of clustering (10), we combined comparison of cell lines to normal lung tissue (8729 modifications) and drug-treated cell lines (9321 modifications) into one data matrix containing 13798 unique modifications; 90 samples from 15 independent experiments (6 samples in each experiment). The combined data matrix contained 78% missing values because there are a large number of PTMs that were not detected across different multiplex runs. Missing values may represent either the absence of PTMs in samples or simply the lack of data, so we developed approaches to reduce their influence on data analysis (10, 23).
Because identification of groups of statistically-related PTMs from sparse datasets is challenging, we evaluated different methods to derive clusters from the statistical relationships between the identified PTMs (described in detail in text S1). We found that the t-SNE method when used with dissimilarity representations was the most effective at resolving meaningful clusters based on the uniformity and density of each cluster, and the number of prior knowledge PPIs found among the proteins within the identified clusters (figs. S1 and S2) (10, 23). To utilize the PTM data to filter edges in PPI databases (Figure 1A), we evaluated analytical methods that identify PTM clusters whose proteins tend to interact (figs. S3 and S4). We found that breaking up large clusters (>80 PTMs) by applying penalized matrix decomposition (PMD), and another round of t-SNE, worked best for defining clusters that were most justifiable by several criteria (fig. S4).
Well-studied proteins have more interactions within PPI databases. Hence, filtering edges using PTM clustering enriched for interactions specific to the lung cancer cell line data, and mitigated the bias in PPI databases towards well-studied proteins (figs. S5 and S6). There was a weak correlation between CFN “betweenness”, a measure that indicates how frequently proteins are found on shortest paths through the network, and the number of PTMs found on each protein (fig. S7). However, the most highly modified proteins were not the proteins that were common to many paths, i.e. had high betweenness. The number of modifications did not always correlate with serving as a hub within cell signaling pathways, though some highly modified proteins may act as hubs. We defined the minimum Spearman correlation to be used to delineate edges that represent correlations between PTMs (Figure 1A), by examining the effect on network size and density (figs. S8 and S9). Finally, using drug responses that affect known kinase pathways, we determined that binning large ratio values and using log2-transformed data for clustering produced the best results (fig. S10). This is likely because TMT ratio data contains extreme values, which may skew correlation analyses, and it can be argued that PTM ratios beyond 100-fold are not functionally different.
Having established an effective method to cluster PTM data derived from TMT mass spectrometry, and having then used these PTM clusters to filter PPI in a CFN that outlines cell signaling pathways in lung cancer cell lines (Figure 1A), we then defined a threshold for Spearman correlations between PTMs to display edges in a CCCN (Figure 1C). The CFN and CCCN networks are available for further exploration at https://cynetworkbrowser.umt.edu/.
Pathways in cluster-filtered networks based on drug-affected PTMs
We next used these networks to examine pathways from drug targets to proteins whose PTMs were affected by drug treatment, to outline cell signaling pathways active in lung cancer cell lines. We began with drugs that directly inhibit receptor tyrosine kinases (RTKs). We reasoned that RTK inhibitors will affect kinase pathways and therefore phosphorylation and other PTMs of substrates and downstream pathway effectors. We traced pathways by identifying shortest paths in the CFN from known RTK drug targets to other proteins whose PTMs changed at least two-fold after drug treatment. Crizotinib, which inhibits the RTKs MET [also called c-MET or hepatocyte growth factor receptor (HGFR)] and ALK (anaplastic lymphoma kinase), inhibited the modification of a number of proteins that are involved in cytoskeletal rearrangements and adhesion (Figure 2A; blue indicates a decrease in PTMs), consistent with the oncogenic role MET is playing in metastasis (39). EGFR phosphorylation was also decreased by crizotinib (Figure 2A), and the EGFR inhibitor gefitinib decreased MET phosphorylation (Figure 2B), indicating crosstalk between these RTKs or possibly off-target effects. The CFN connections downstream of MET, ALK, and EGFR linked to the tyrosine kinase LYN, the tyrosine phosphatase PTPN11 (also known as SHP2), and the adaptor/scaffolding proteins IRS1 and CRK (40). These connections indicate known interactions supported by the statistical clustering of PTMs.
Figure 2. Networks derived from composite shortest paths from drug targets to drug-affected proteins.

(A to C) Graphs showing the sum of shortest paths from each target to each protein whose PTMs were more than 2-fold affected by the MET and ALK inhibitor crizotinib (A) and the EGFR, ERBB2, and ERBB3 inhibitor gefitinib (Iressa) (B) in H3255 cells treated for 1–24 hours. A key defining node shape and border colors and edge colors is shown bottom right. Directed edges are shown with arrowheads; these indicate one protein acting on another protein (for example kinases phosphorylating substrates). Undirected edges without arrowheads indicate various other types of interactions. Edge line thickness is proportional to the strength of interactions as defined in PPI databases. Node size and color are proportional to the changes in PTMs for each protein in response to indicated drug treatments (see scale bar; yellow indicates positive change; blue, negative; green; no change). Many yellow nodes represent overall increases in acetylation in these graphs (C). Fold change for individual PTMs in response to indicated drugs is plotted using heatmaps on a blue-yellow scale (see scale bar). Several proteins exhibited phosphorylation decreases (represented by blue on the heatmap) and concomitant acetylation increases (represented by yellow) in response to gefitinib.
In addition to decreases in phosphorylation of downstream targets, we noted an increase in acetylation of many proteins (Figure 2B, yellow nodes). In a group of proteins that were both phosphorylated and acetylated, phosphorylation decreased and acetylation increased with gefitinib treatment (Figure 2C). The acetyltransferase EP300 itself showed increased acetylation with gefitinib treatment, and was linked to HSP90 in the CFN (Figure 2B). Also present was fatty acid synthase (FASN), whose activity and expression is controlled by EP300 (41). EP300 and HSP90 had many links in the CFN to proteins dually modified by both phosphorylation and acetylation (Figure 2B). Thus, examination of several PTMs in the same experiment revealed an unexpected relationship between phosphorylation and acetylation. Filtering PPIs by PTM modification clustering highlighted links between cytoskeletal proteins, RNA-binding proteins, and heat shock proteins in lung cancer cell lines.
HSP90 proteins, together with CDC37, act as chaperones for a large number of kinases, including RTKs, and are required for regulation of activity as well as their initial folding (42). The mechanisms of action of the HSP90 inhibitor geldanamycin are not well understood compared with the other anti-cancer drugs employed in this study. Heat maps showing PTMs affected by more than 2-fold by geldanamycin revealed that, in addition to HSPs (Figure 3A), many proteins involved in regulating endocytosis (Figure 3B) and cytoskeletal dynamics (Figure 3C) were affected by geldanamycin. This is consistent with reports that geldanamycin affects endocytic membrane trafficking and cytoskeletal dynamics (43–45). Examination of the shortest paths between HSP90 proteins, the known targets of geldanamycin, and proteins whose PTMs were affected by geldanamycin included acetyltransferase EP300 interacting with HSP90AA1 (Figure 3D). As mentioned above, proteins that have high betweenness are likely to be hubs in the network, that is, connect many cell signaling pathways (fig. S7). These included HSP90AA1 and several other proteins linked to it in the geldanamycin subnetwork (Figure 3D), including the 14–3-3 proteins YWHAQ and YWHAZ; the RNA-binding protein, NPM1; and the heat shock proteins HSPA8, HSPA1B; and β-actin (ACTB). Geldanamycin treatment also affected phosphorylation of the RTKs ALK, AXL, EGFR, ERBB3, and IGF1R, of which phosphorylation was decreased for all but AXL and ERBB3 (Figure 3D).
Figure 3. Heat maps and network showing PTMs affected more than 2-fold by geldanamycin.

(A to C) Heatmaps of PTMs of HSPs (A), proteins involved in endocytosis (B), and proteins involved with the cytoskeleton (C) in each of two lung cancer cell lines cultured with serum and either untreated or treated with geldanamycin (100 μM for 15 or 24 hours) relative to serum-starved, untreated cultures. Scale bar (B) indicates fold change on a blue-yellow scale. (D) Network graph plotted as in Figure 2 showing the sum of shortest paths from HSP90AA1 and HSP90AB1 (center) to each protein whose PTMs were more than 2-fold affected by geldanamycin in H2228 or H3122 cells. Node size and color indicates the sum of PTM changes in response to geldanamycin in both cell types (refer to the key in Fig. 2).
These results suggest that geldanamycin may affect the balance between phosphorylation and acetylation by influencing EP300 through interaction with HSP90 proteins. This in turn affects endocytosis (as indicated by phosphorylation changes in DYNC1I2, EPS8, CAV1, and clathrin heavy chain, CLTC) as well as microtubules, actin, other cytoskeletal elements (as indicated by several PTM changes in spectrin, SPTAN1; keratins, KRT7, KRT8) (Figure 3). Protein methylation may also be involved. Changes in methylation were also observed in response to geldanamycin, and phosphorylation of the histone lysine methyltransferases WHSC1/NSD2 and NSD1 were reduced (Figure 3). In fact, there were CFN links between EP300 and kinases, phosphatases, another acetyltransferase (CLOCK), methyltransferases (PRMT1, ASH1L) and the actin-regulating proteins RAC1 and CDC42 (Figure 4A).
Figure 4. EP300 interactions with PTM-modifying enzymes.

(A) Shown are links in the CFN between EP300 and kinases, phosphatases, acetyl- and methyltransferases, and the actin-polymerization-governing GTPases RAC1 and CDC42. In cases where there were more than one type of interaction between two proteins in PPI databases (see key in Fig. 2), to simplify graphs white edges represent the composite of these interactions with the edge weight summed. (B) EP300 interactions with clathrin heavy chain (CLTC) and enzymes that modify clathrin and govern EGFR endocytosis. The graph shows PTMs linked by black edges to the parent protein, and correlation edges (yellow, positive; blue, negative) between PTMs in the PTM CCCN, which depicts PTMs that co-cluster with edges representing Spearman correlation greater than the threshold of |0.543| as defined in fig. S9. Node size and color (refer to the key in Fig. 2) indicates ratios of PTM changes in lung cancer cell lines to those in normal lung tissue; see fig. S11 for responses to drugs. The combined CFN/CCCN graphs show the individual PTM response as well as the sum of all PTMs represented in the parent (gene) node.
Specific PTM relationships in the pathways that connect EGFR to EP300 can be visualized by showing PTMs and their correlation edges on the CFN graph (Figure 4B). In the graphs in Figure 4, node size and color indicate comparison of individual PTMs, or the sum of all PTMs for a protein, in cell lines compared to normal lung tissue. The same graphs indicating fold change in response to drug treatments are shown in fig. S11. Individual PTMs on EP300 changed in response to different conditions, and these changes occurred concomitantly with PTMs on other proteins that co-clustered with EP300 PTMs (fig. S12). For example, EP300 phospho-S1897 was down-regulated in lung cancer cells compared to normal lung tissue along with two phosphorylation sites on BCAR3 (fig. S12A, bottom), while EP300 acetylation sites K1674 and K1760, along with RAC1 and CDC42 acetylation sites, were increased by gefitinib treatment (fig. S12C, top and middle left, respectively). These data indicate that EP300 likely plays a central role in cytoplasmic signaling in addition to its previously described role as a histone acetyltransferase. The inverse relationship between phosphorylation and acetylation on EP300 (fig. S12) and other proteins (Figure 2) gives rise to the hypothesis that there is an antagonistic relationship between particular sites of acetylation and phosphorylation on cell signaling proteins. These sites may be indicators of mutually opposing mechanisms or pathways.
Evidence for antagonistic relationships among PTMs
The hypothesis that there is an antagonistic or dueling relationship between phosphorylation and acetylation sites leads to two predictions. First, we should expect to find negative correlations between a subset of phosphorylation and acetylation sites for proteins modified with both PTMs. The distribution of correlations between phosphorylation and acetylation sites on the same protein was significantly different than that of dual phosphorylation or acetylation (Figure 5A). We found 269 such phosphorylation and acetylation modifications with Spearman correlation lower than –0.5 in 112 proteins in the lung cancer cell line PTM data (highlighted in blue in Figure 5A). Both tyrosine phosphorylation and serine/threonine phosphorylation exhibited negative correlations with acetylation (fig. S13). Negative correlations can be visualized as blue edges on a combined CFN-CCCN (Figure 5B), which revealed proteins that are involved with endocytosis and the actin cytoskeleton that are affected by geldanamycin. Cortactin (CTTN), for example, had a large number of phosphorylation sites negatively correlated with its acetylation sites that are affected in opposite ways by geldanamycin (Figure 5B, upper right; Figure 5C). Clathrin is another example where phosphorylation and acetylation sites were negatively correlated, though not all sites were affected by geldanamycin, or detected in the drug treatment experiments. Cliques of highly correlated co-clustered PTMs were also revealed in the CCCN (Figure 5D, identified by yellow edges). For example, EGFR pTyr869 clustered with MET pTyr1003 in one clique, while different EGFR phosphorylation sites clustered with proteins involved with endocytosis (EPS8, CLTC) in the other clique (Figure 5D).
Figure 5. Dually acetylated and phosphorylated proteins: Interactions with bromodomain proteins and kinases.

(A) Correlation between different PTM sites on the same protein: different phosphorylation sites (p p); phosphorylation and acetylation (p ac); and different acetylation sites (ac ac). Homo-PTM correlations (p p; ac ac) are compared to heterologous (p ac) PTMs (both p < 2.2 × 10⁻¹⁶, Welch two-sample t-test). Individual PTM-PTM correlations are plotted in grey under boxplots (top). Correlation density between phosphorylation and acetylation sites on the same proteins is also shown (bottom). Similar plots in which tyrosine and serine/threonine phosphorylation are compared to each other and each to acetylation individually are shown in fig. S13. Negative correlations selected for display as edges are highlighted in blue. (B) Combined CFN and PTM CCCN for selected proteins modified by both phosphorylation and acetylation. In addition to correlation edges, negative Spearman correlations less than −0.5 are shown as blue edges (plotted as in Fig. 4B except edges connecting proteins to their PTMs are light grey). (C and D) Selected regions of (B) expanded for clarity. (E) CFN interactions between tyrosine kinases, geldanamycin-affected dually acetylated and phosphorylated endocytic and cytoskeletal proteins, and bromodomain proteins (colored light red). Node size and color (refer to the key in Fig. 2) is in response to geldanamycin for (B–D). (F) Comparison of the number of interactions of bromodomain-containing proteins with: dually modified proteins both phosphorylated and acetylated (p ac); those with negative correlations less than −0.5 (p ac neg); all acetylated proteins (all ac); all proteins not acetylated (all except ac); all proteins except those both phosphorylated and acetylated (all except p ac); and proteins only modified by phosphorylation (p only) or methylation (me only). CFN interactions between bromodomain-containing proteins and these groups of proteins were retrieved and the number of edges was divided by the number of proteins in each group to obtain bromodomain interactions per gene.
The second prediction of the hypothesized dueling relationship between certain phosphorylation and acetylation sites is that there should be interactions between acetyl-binding proteins containing bromo (or BET) domains, which bind to acetylated lysine moieties, and kinase signaling pathways (5). Such interactions were observed in the CFN among dually phosphorylated and acetylated proteins, kinases and bromodomain proteins (Figure 5E; bromodomain proteins are colored light red). Bromodomain-containing proteins were more likely to interact with dually phosphorylated/acetylated proteins than acetylated proteins in general, or proteins modified by phosphorylation or methylation (Figure 5F). That there were more CFN interactions between bromodomain-containing proteins and dually phosphorylated and acetylated proteins compared to all other groups of proteins (Figure 5F), combined with the fact that gefitinib (Figure 2B, C) and geldanamycin (Figure 3) caused decreases in phosphorylation and concomitant increases in acetylation for a large number of proteins, strongly support the hypothesis that certain phosphorylation and acetylation sites play antagonistic or mutually opposing roles for proteins identified in this study.
The data suggest the hypothesis that the intracellular location of proteins may change when their phosphorylation and acetylation rates go in opposite directions. To test this hypothesis, we performed cell fractionation experiments that effectively separate organelles including endosomes and lysosomes, and membrane compartments distinguished by resistance to non-ionic detergents (lipid rafts; Figure 6A) (10, 46, 47). Geldanamycin treatment caused changes in the intracellular location of proteins with negative correlations between phosphorylation and acetylation, determined by mass spectrometry (Figure 6B, C), and western blotting (Figure 6D, E, and fig. S14). Many dually modified proteins increased in detergent-resistant lipid raft fractions (rafts2–4), including HSPs and chaperones (HSP90AA1, HSPA4, HSPB1, CCT2); 14–3-3 phosphoserine-binding proteins (YWHAZ, YWHAE, YWHAQ, YWHAH); cytoskeletal proteins (ACTB, CTTN, TUBB4A, MTPN); membrane traffic-associated proteins (CLTC, NDRG1), and signaling adaptor proteins (GIPC1, LASP1, PEA15, CRK, CRKL, GRB2) (Figure 6, and fig. S14). Clathrin heavy chain (CLTC) also decreased in endosome fractions (org2) in response to geldanamycin, while other proteins increased, including MAPK1, MAPK12, and KRAS (Figure 6C, D, E). While there was a geldanamycin-induced increase in phosphorylated MAPK3/MAPK1 in raft fractions, phosphorylated CTTN decreased in the same fractions (p-ERK1/2 and p-CTTN, Figure 6E, and fig. S14). Concomitantly, several bromodomain-containing proteins (PBRM1, ATAD2, BAZ1A, BAZ1B, and SMARCA4) decreased in the same lipid raft fractions (raft2–4; Figure 6B, C). These data are consistent with previous work showing that geldanamycin influences the intracellular localization of signaling proteins (43–45) and support the hypothesis that the changes in modification state that we observed in response to geldanamycin (Figure 3) have functional consequences for intracellular localization.
Figure 6. Geldanamycin induces changes in lipid raft localization of dually phosphorylated/acetylated proteins.

(A) Outline of cell fractionation experiments that separate organelles including different populations of endosomes (org1–4, top) and detergent-sensitive and -resistant membranes including lipid rafts (raft1–4, bottom). Org1–3 contain lysosomes and endosomes with different sedimentation velocity, respectively; org4 contains soluble, cytoplasmic proteins; raft1 contains detergent-sensitive proteins; raft2–4 are detergent-resistant fractions of decreasing equilibrium density (10, 46, 47). (B-E) H3122 and H3255 cells treated with geldanamycin (“geld.”) or not treated (“C.”) were fractionated and total protein amounts in each fraction [4 organellar fractions (“org.”) and 4 raft fractions (“raft.”) were determined in 3 separate experiments by mass spectrometry (B and C, H3122 cells) and, for a select few, by Western blotting (D, H3255 cells; E; cell type indicated). Mass spectrometry data (expressed as heat maps in B) and Western blot data (D, and fig. S14) were used to calculate the amount of each protein in each cell fraction as a proportion of the total in the whole cell, which is the sum of protein amounts in all cell fractions. The heat maps in (C) and (E) show fold change abundance in treated cells relative to control cells for each fraction for mass spectrometry and Western blot data, respectively. 168/218 dually phosphorylated and acetylated proteins with negative correlations between these PTMs were detected in this experiment. Many exhibited changes in the raft2 fraction (p = 0.05394, Welch two sample t-test). 45/108 proteins whose PTMs changed significantly in response to geldanamycin (Fig. 3) were detected by mass spectrometry in this experiment; collectively their amounts increased in the raft2 fraction (p = 0.01457). Of the six bromodomain-containing proteins detected, most decreased in the raft2 fraction (p-value = 0.04832 for all the bromodomain-containing proteins). Mass spectrometry data expressed as the amount of proteins in cell fractions are in table S2.
A total of 295 proteins were identified that had negative correlations between different types of PTMs on the same protein (table S1). Examination of relationships between protein methylation and other PTMs revealed that the distribution of correlations between methylation and acetylation sites on the same protein was significantly different than correlations of the same PTMs (Figure 7A). There were 50 proteins with 95 dual acetylation and methylation PTMs that had negative correlation less than –0.5 (highlighted in blue in Figure 7A). These include RNA-binding, cytoskeletal, heat shock proteins, transcription factors, and acetyltransferases, including EP300 and NCOR2 (table S1). Note that none of this group were histones, which were dually modified, but correlations were mostly positive or not significant. There were also groups of methylated and acetylated proteins whose PTMs clustered together and were all highly correlated with one another. An example clique of these highly correlated co-clustered PTMs (Figure 7B, identified by multiple yellow edges) revealed several RNA binding proteins and transcription factors, including the methyltransferase EZH1, acetyltransferase CREBP, deacetylase SIRT9 (which was phosphorylated), and proteins whose methylation and acetylation sites were inversely correlated. These data suggest that there are molecular interactions governed both synergistically and antagonistically by methylation and acetylation in proteins to regulate RNA processing and transcription.
Figure 7. Clusters of proteins dually modified by different PTMs.

(A and C) Correlations between different PTM sites on the same protein plotted as in Fig. 5A. Homo-PTM correlations (me me; ac ac; p p) are significantly different from heterologous PTM correlations (me ac; p me; p < 2.2 × 10⁻¹⁶ in all cases). (B and D) Selected proteins modified by (B) acetylation and methylation, and (D) phosphorylation and methylation are shown with CFN links to PTM modifying enzymes as described in Fig. 4B. These figures highlight two cliques of PTM CCCN edges that co-clustered and had a high Spearman correlation. Negative correlations between different PTMs on the same protein are indicated by blue edges. Node size and color (refer to the key in Fig. 2) reflects total of all PTM ratios in the data set.
Similar to other dual modifications on the same proteins, the distribution of PTM correlations among 96 dually phosphorylated/methylated proteins were distinct from homologous PTM correlations, with 211 modifications having negative correlation between phosphorylation and methylation less than –0.5 (Figure 7C). Many of these co-clustered PTMs were found on RNA-binding and RNA-processing proteins. We also identified a clique of PTMs among phosphorylated and methylated RNA-binding proteins that included links to methyltransferases and kinases (Figure 7D). The core clique of proteins whose PTMs all clustered and correlated included proteins involved in RNA splicing and processing, similar to the clique of methylated and acetylated proteins above (Figure 7B) (48). The extended group contained other proteins involved in RNA binding, cytoskeleton, chaperone activity, and transcription regulation. HNRNPA2B1 displayed multiple negative correlations between its tyrosine phosphorylation and arginine methylation sites. Note that the methyltransferase EZH1, the RNA processing protein XRN2, and the RNA binding protein RBMX were linked to both clusters (Figure 7).
Connections to aberrantly regulated genes in lung cancer
Lastly, to assess the functional significance of upstream signaling events’ influence on global mRNA gene expression by posttranslational modifications, we examined how cell signaling pathways inferred from the CFN analysis may regulate basal gene expression patterns in lung cancer cell lines. Among the most commonly differentially regulated genes from the gene expression data we obtained from lung cancer cell lines from the Cancer Cell Line Encyclopedia (CCLE) (49), SMARCA4 and NKX2–1 were also detected in the protein modification data (Figure 8A; ref. (50)). SMARCA4 is the most down-regulated gene and its inactivation is thought to promote NSCLC aggressiveness (51). NKX2–1 is one of the top 10 differentially regulated gene in this set of cell lines. NKX2–1 plays a key role in lung development; its loss causes a failure of lung cell differentiation and leads to malignant transformation in lung adenocarcinoma (52–54). SMARCA4 and NKX2–1 exhibited CFN/CCCN interactions with the RNA binding proteins DDX5, DHX9, HNRNPAB, and lysine acetyltransferase NCOA2 (Figure 8B). These links from DDX5 to NCOA2, NKX2–1, and SMARCA4 were preserved in a highly curated network focused on direct binding interactions (Figure 8C). This is consistent with a mechanism to control NKX2–1 expression through long non-coding RNAs (54). The acetyltransferase EP300, the methyltransferase PRMT1, and the kinases PKN2, CHEK2, YES1, and the bromodomain-containing kinase BAZ1A also had cluster-filtered interactions with this group (Figure 8B), indicating that the interplay of phosphorylation, acetylation, and methylation is likely to play a role in controlling expression and activity of SMARCA4 and NKX2–1.
Figure 8. Pathways to SMARCA4 and NKX2–1.

(A) Gene expression data from 29 NSCLC cell lines from the Cancer Cell Line Encyclopedia (CCLE; ref. 49) plotted on a blue-red scale (key; ref. 50). NKX2–1 and SMARCA4 (highlighted) are among the most dysregulated genes in lung cancer. (B) CFN and CCCN path from EP300 to NKX2–1 and SMARCA4, where node size and color (refer to the key in Fig. 2) indicates total ratio data for all experiments where lung cancer cell lines were compared to normal lung tissue. (C) Shortest paths from EGFR and MET to transcription factors in a CFN derived from PPI dataset with highly curated molecular interactions with a focus on direct interactions for which there is strong evidence (20, 55). Note that DDX5 and NCOA2 bind to NKX2–1 and SMARCA4 as in (B). Node size is CFN betweenness and node color is normalized betweenness defined as CFN betweenness divided by the betweenness from all PPI datasets before filtering.
In sum, we detected a large number of proteins that were modified by more than one type of PTM; in this study we detected more than 700 proteins that were phosphorylated, acetylated, and methylated (Fig. 9A and fig. S15A). Correlation was poor (R-squared 0.03368) comparing relative abundance of proteins detected by their PTMs in our data to total protein abundance estimates for human proteins in paxDB (fig. S15B) (56). This suggests that the amount of detectable PTMs was governed largely by signaling events rather than by total protein amounts. Elucidation of clusters of positively correlated PTMs, when combined with PPI information, identified cell signaling pathways that are active in lung cancer cell lines. In addition, our observations suggest that proteins that function as signal integrating hubs may have one or more exclusive OR (XOR) switches governed by a subset of antagonistic relationships among phosphorylation, acetylation, and methylation sites (Figure 9B). Since different PTMs govern interactions among proteins with PTM-specific binding domains (Figure 9B), proteins modified by more than one PTM type may thus function as hubs for signal integration or pathway control switches. Identification of these cell signaling hubs, and the enzymes that modify them, provides insight into the complex signal transduction mechanisms that regulate lung cancer cell lines.
Figure 9. Dual PTMs may function as dueling PTMs.
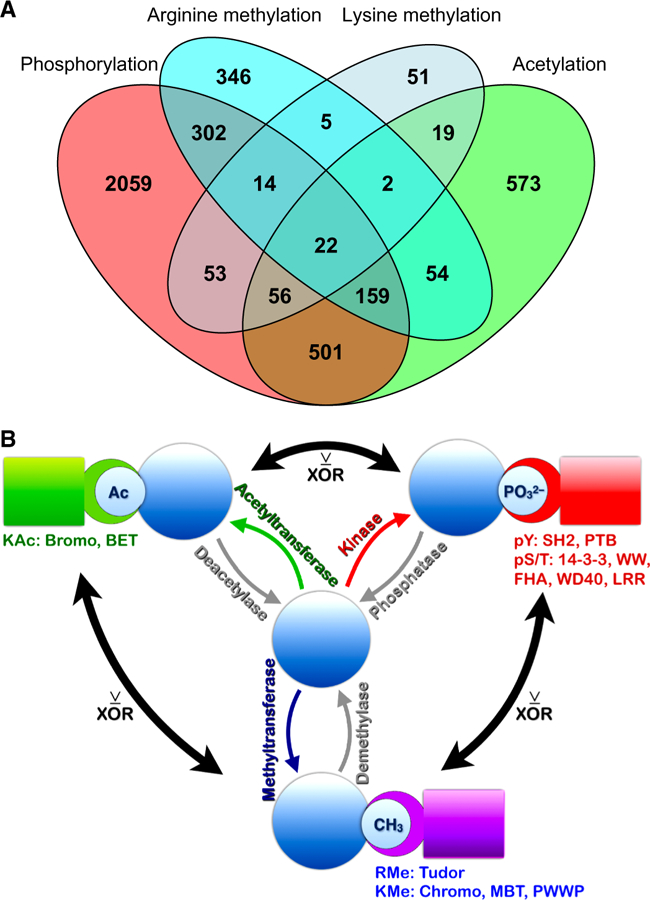
(A) Venn diagram showing the overlap among proteins modified by more than one type of PTM. A similar Venn diagram in which tyrosine and serine/threonine phosphorylation are separated is shown in fig. S15A. (B) Schematic of the findings. Proteins in molecular signaling pathways modified by more than one PTM have different sets of interacting proteins (5, 6). PTM-driven interactions occur through recognition of specifically modified amino acid residues by protein domains listed under the PTM type in the figure. Acetylated (Ac) proteins interact with bromodomain and BET (Bromodomain and extraterminal domain) proteins (green); methylated proteins interact with proteins containing Tudor domains if methylated on arginine (RMe); or Chromo, PWWP (‘Pro-Trp-Trp-Pro’), and MBT (malignant brain tumor) domains if methylated on lysine (KMe) (purple). Phosphorylated proteins interact with several protein families (red): tyrosine phosphorylated proteins (pY) interact with SH2 (SRC-homology domain 2) and PTB (phosphotyrosine binding) domains; serine/threonine phosphorylated proteins (pS/T) interact with a variety of proteins including 14–3-3 protein family members, and proteins containing the domains WW (domain with 2 conserved Trp residues), FHA (forkhead-associated domain), WD40 (WD or beta-transducin repeats), and LRR (leucine-rich repeats). Our data suggest that where inverse correlations exist between different PTMs, these may function as exclusive “OR” (XOR) switches to direct alternative cellular outcomes. This principle applies to phosphorylation vs. acetylation; phosphorylation vs. methylation; and methylation vs. acetylation.
Discussion
The data generated for this study presented a unique opportunity to simultaneously examine, on a large scale, proteins modified by tyrosine and serine/threonine phosphorylation, lysine acetylation and lysine and arginine methylation (Figure 1B). This allowed definition of relationships between kinases, phosphatases, and enzymes known to affect other posttranslational modifications, including acetyltransferases, deacetylases, methyltransferases, and demethylases. Our computational data analysis approach was to integrate two different kinds of information: clustering based on statistical relationships among various PTMs, and PPI data from public databases, to outline signal transduction pathways (Figure 1A). We started with PPI networks retrieved from Pathway Commons, String, GeneMANIA (15, 16), BioPlex (12), and the kinase-substrate data from PhosphositePlus (13, 14), then filtered interactions based on PTM clustering. Clustering methods using t-SNE were previously used for analyzing lung cancer phosphoproteomic data (23) and the CFN approach we employed here was previously used on phosphoproteomic data from neuroblastoma cell lines (10). We further refined this approach with an additional step (PMD) to break up large clusters as described in Materials and Methods and Supplementary Information. We have shown that the CFN derived from these data effectively removes biases in PPI networks where well-studied proteins have more links (fig. S6) and that the number of PTMs does not overly bias node betweenness (fig. S7), so that the two kinds of information were well balanced for construction of a CFN.
The cell signaling pathways within the CFN were based on known PPIs as well as clustering of PTMs in lung cancer cell lines, so for interactions between any two proteins to be retained in the CFN, they must be included in the same PTM cluster. Starting with drug targets (the proteins that bind to and are directly affected by drugs) we examined links, shortest paths in the CFN, to proteins whose PTMs were changed by drug treatment (Figures 2, 3). This effectively outlined signaling pathways in lung cancer cell lines between drug targets and downstream proteins whose PTMs were affected by the drug.
The hypothesis that certain PTMs may have a mutually opposing, antagonistic relationship to one another was first suggested in our results by drug treatments that caused protein acetylation to increase and phosphorylation to concomitantly decrease (Figures 2, 3). The links between the acetyltransferase EP300 and heat shock proteins including HSP90s, suggested that the HSP90 inhibitor, geldanamycin, affects the balance between the phosphorylation and acetylation of endocytic and cytoskeletal proteins. This in turn perturbs endocytosis and cytoskeletal dynamics, which influences membrane trafficking and activity of selected RTKs and other proteins involved in signal transduction (Figure 6). These results are consistent with previous work showing that geldanamycin affects membrane traffic and cytoskeletal dynamics to regulate activity and intracellular localization of many signaling proteins (43–45). EP300 had many CFN links to enzymes that regulate other PTMs, including kinases, phosphatases, and methyltransferases (Figure 4, and figs. S11, S12). EP300 has been previously reported to function in cytosol to regulate autophagy (57, 58). Our data suggest that EP300 (and possibly other acetyltransferases) may play a role in regulating other membrane traffic and cytoskeletal mechanisms. Consistent with this notion, HDAC6 acetyltrasferase regulates the acetylation status of microtubules and modulates EGFR trafficking (59). That geldanamycin affects the balance of different PTMs sheds new light on the elusive mechanisms of action of this class of drug, which is important to understand because HSP90 inhibitors are an emerging therapy for lung cancer (60–62).
Further support for an antagonistic relationship between certain phosphorylation and acetylation sites was provided by examining negative correlations between PTMs within the same protein, and visualizing them as edges (Figure 5A, B). In addition, cluster-filtered interactions existed between kinase signaling pathways and bromodomain-containing proteins that bind to acetylated lysine moieties (Figure 5E). These interactions were most frequent among proteins with negative correlations between phosphorylation and acetylation sites on the same protein (Figure 5F). In fact, negative correlations within proteins were also identified for acetylation vs. methylation sites (Figure 7A, B), and phosphorylation vs. methylation sites (Figure 7C, D). These data elucidated a family of different PTMs that potentially function as multiple XOR (exclusive OR) switches in signaling pathways (Figure 9B).
Our data are consistent with the notion that different PTMs on the same protein integrate multiple signals to generate combinatorial outputs (63). These interconnected, functionally-associated mechanisms co-evolved across eukaryotes (2, 64), and are associated with oncogenesis (40). Our study indicates that acetylation and methylation, together with phosphorylation, increase the interactome of hubs in the signal transduction network by conditionally altering the sets of interacting proteins with particular protein domains (Figure 9; refs. 65, 66). Proteins in the network may be classified as proteins that attach (writers), recognize (readers), and remove (erasers) PTMs (2). The readers of acetylation contain bromo and BET domains (5). Readers of methylation are proteins that have the tudor domain for arginine methylation; and chromo, MBD, and PWWP domains for lysine methylation (67). It is noteworthy that bromodomain-containing proteins include kinases (BAZ1A; TRIM33; BRD2; BRD4), acetyltransferases (EP300; CREBBP), and methyltransferases (ASH1L; KMT2A; Figure 5E). This emphasizes the interconnected nature of mechanisms involving different PTMs.
Signaling pathways outlined using cluster-filtered networks involve a large number of modified RNA binding, cytoskeletal, and membrane traffic proteins. The number of RNA-binding and cytoskeletal proteins in these networks makes sense in light of the number of mechanisms involved with RNA transport, sequestration, and regulatory RNA molecules (68–72). Cells evolved mechanisms to control protein expression by transcription, translation, and transport of RNA to different intracellular locations. Two RNA binding proteins were the most highly modified proteins in the data (AHNAK, SRRM2; fig. S7). Several such highly modified RNA binding proteins are dysregulated in cancer and move from cytoplasm to nucleus in response to phosphorylation (73). Our data suggest that methylation and acetylation also likely play a role in this process.
Signal transduction involves more than the three PTMs studied here, for example generation of second messengers, and covalent attachment of carbohydrates, lipids, or ubiquitin-family proteins, which cause additional changes in activity, intracellular location, and binding partners (63–65). Accurate models of signal transduction should attempt to integrate data about these processes for a complete picture. For example, MET ubiquitination and internalization is regulated by phosphorylation at Tyr1003, the c-CBL E3 ubiquitin ligase binding site (74). This PTM on MET clustered with phosphorylation of EGFR at Tyr869 and Tyr1197 but not at Tyr1045, EGFR’s c-CBL binding site (Figure 5C,D) (75).
It would also be useful to correlate gene expression patterns with PTMs. This remains challenging, however, because the correlation between protein and mRNA levels is poor, as shown for example during Xenopus embryogenesis, where large cells allow direct comparisons (76), though many differences may be resolved using simple model for expression kinetics (77). PTMs in cells are even more highly variable and dynamic than protein levels. For example, very different phosphorylation patterns in the anaphase promoting complex and mitotic spindle checkpoint proteins are observed in response to antimitotic drugs (78), and PTMs show much more dramatic changes than mRNA or protein during developmental progression (77). PTMs are more likely to be useful to inform us about cell signaling pathways than transcription because they are closer to signaling events, at least those that are upstream of transcription (25, 77).
Our study integrating three different PTMs contains a large amount of information that outlines signaling pathways when clustering is combined with known protein-protein interactions. These data elucidated clusters of highly-correlated PTMs among groups of proteins (yellow CCCN edges in Figs. 5B and 6, B and D). This means that if one or a few of these PTMs are detected, other members of the clique are likely to be found, which is useful for determining signatures of pathway activation or disease state. There are more synergistic relationships, as well as dueling or antagonistic relationships, among different PTMs in lung cancer signaling pathways than can be presented from our data; therefore, we have created a browser-accessible interface as a resource for further exploration by other investigators (https://cynetworkbrowser.umt.edu/). Networks are also available on the NDEx repository (https://doi.org/10.18119/N9F59Z) and in Data File S1. The data will be useful for prediction of pathways of drug resistance (79), and side effects from drugs that target writers, readers and erasers of acetylation and methylation (4–9).
Materials and Methods
Modification-specific antibody immunoprecipitation and Mass spectrometry.
PTMs of 45 lung cancer cell lines, 12 derived from SCLC and 33 from NSCLC, were compared to normal lung tissue (pooled from anonymous patients) using an established protocol (26, 27). In addition, several cell lines were treated with crizotinib, gefitinib, geldanamycin, or imatinib at 1 µM for 1–24 hours. In all, 15 six-plex TMT experiments were performed. Briefly, cells were washed and harvested in PBS and cell pellets frozen in liquid nitrogen. Cells were lysed in a 10:1 (vol/wt) volume of lysis buffer (4% SDS; 100 mM NaCl; 20mM HEPES pH 8.5, 5 mM DTT, 2.5 mM sodium pyrophosphate; 1 mM β-glycerophosphate; 1 mM Na3VO4; 1 μg/ml leupeptin), and proteins were reduced at 60°C for 45 min. Proteins were then alkylated by the addition of 10 mM iodoactamide (Sigma) for 15 min at room temperature in the dark, and methanol/chloroform precipitated. Protein pellets were resuspended in urea lysis buffer (8M urea; 20 mM HEPES pH 8.0; 1 mM sodium orthovanadate; 2.5 mM sodium pyrophosphate; 1 mM beta-glycerolphosphate) and sonicated. Insoluble material was removed by centrifugation 10,000 x g, 5 min, and the supernatant diluted fourfold in 20 mM HEPES pH 8.5, 1 mM CaCl2, for Lys-C digestion overnight at 37°C, then diluted two-fold and trypsin digestion 4–6 hours at 37°C. Samples were then acidified to pH 2–3 with formic acid, peptides purified on a Waters Sep-Pak column and dried in a speed-vac. Peptides were purified on a Waters Sep-Pak column, and quantified using a micro-BCA assay (Thermo). Mass tag (6-plex TMT reagents; Thermo) were crosslinked to peptides in 30% acetonitrile/200 mM HEPES pH 8.5 1 hour at room temperature and the reaction stopped by the addition of 0.3% (v/v) hydroxyamine. Combined samples were then sequentially immunoprecipitated with cocktails of modification-specific antibodies from Cell Signaling Technology in the order: anti-phosphotyrosine (P-Tyr-1000, #8954); anti-phosphoserine/threonine (AGC/PSD-family Kinase Substrate Antibody; CST in-house antibody validated for peptide immunoprecipitation), Phospho-Akt Substrate #9614, Phospho-AMPK Substrate Motif #5759, Phospho-ATM/ATR Substrate #9607 and #6966); anti-acetyllysine (acetylated-Lysine #9814(80)); anti-methyllysine (Mono-Methyl Lysine #14679(81)) and anti-methylarginine (Mono-Methyl Arginine #8015(81)) (see Figure 1B). After anti-phosphotyrosine and anti-phosphoserine/threonine immunoprecipitation phosphopeptides were further purified on a TiO2 column [Thermo Fisher (82)]. Samples are then mixed in equimolar ratios, and the ratios checked and samples run on an Orbitrap Q Exactive MS (Thermo Fisher). Identification of peptides and quantification of mass tags was obtained from the from the MS2 spectrum after fragmentation by MS/MS analysis as described (28, 81). Peptides with FDR < 1% were selected for further analysis. Modification sites with site localization scores of less that A-score 13 were excluded from analysis (83).The data were filtered to include single modification sites present in three or more experiments for the final analysis. For display of results in heat maps, treatment:control ratios were calculated as fold change (treatment/control if treatment>control; −1/treatment/control if treatment<control).
Final clustering for cluster-filtered networks.
A detailed discussion of data analysis considerations and network development is provided in Supplementary Text S1. TMT ratio data were used to calculate pairwise-complete Euclidean distance, Spearman and hybrid Spearman-Euclidean dissimilarity (SED) (10, 23). Clusters were identified using t-SNE as below. Clusters containing more than 80 modifications were subjected to PMD with dimensionality reduced to the number of experiments that contained modifications in the cluster and t-SNE was then performed on these PMD embeddings. Clusters were examined manually and those that were sparsely populated with data (meaning, that contained modifications mostly from one experiment) were discarded. An adjacency matrix was constructed by pairing co-clustered modifications to each other. To construct co-cluster correlation networks (CCCNs), the adjacency matrix was used to filter Spearman correlations at various values as shown in Figure S9, excluding values that were not between co-clustered modifications. Spearman correlation values were used to represent network edge weights in modification site CCCNs. This protein modification CCCN was used to construct a protein CCCN by merging all co-clustered correlation edges into the gene names of modified proteins. The final gene CCCN represents the sum of modification correlations among all proteins (genes) that clustered together, whose modifications were detected in two or more experiments, and whose Spearman correlation is greater than the absolute value of minimum densities shown in Figure S9B.
Pairwise complete Euclidean distance and Spearman correlation was performed in R using previously-described methods (10, 23). Embeddings were created from Euclidean distance; Spearman dissimilarity defined as 1 - abs(cor); and hybrid Spearman-Euclidean dissimilarity (SED) defined as the mean of normalized Euclidean and Spearman dissimilarity as 1 - cor.
Matrix decomposition was performed using the methods described in Witten, et al (88) using the R package, PMA. Parameter selection for PMD via cross-validation was first performed using the tuning function PMD.cv. The function, PMD, which applies an L1 penalty on the columns and rows, was used to obtain a matrix of 90 factors (equivalent in size to the original data) and 15 factors (the number of TMT runs). The original data were not centered for these calculations. Alternatively, the data were further standardized such that each column has zero mean and unit variance (normalized, centered or nc). Groups with greater than 3 sites were evaluated.
t-SNE embeddings were created using Rtsne, the Barnes-Hut implementation of t-Distributed Stochastic Neighbor Embedding. The pairwise complete method produced clusters that were more readily distinguished (Figure S1), with other methods tending to crowd many sites into one or two very large clusters. This was mitigated in two ways, by reducing the perplexity in t-SNE, and reducing vector length for inclusion of neighbors in clusters (the “too long” value) in the minimum spanning tree length to define clusters. These parameters were optimized as much as possible to avoid one large cluster and also many single-site clusters. The typical settings with Rtsne were dimensions = 3, perplexity = 15; theta = 0.25; and the initial PCA step turned off.
Random clusters were generated by sampling the total number of sites or genes from the data using a probability vector to obtain the average number of genes and sites similar to real clusters from all embeddings. The probability of random co-clustering of different modification sites from the same protein was weighted to the number of modification sites per protein; in other words proteins with many modification sites in the data were more likely to co-cluster in random clusters. The average %NA of random clusters was equal to that in the entire data set (Figure S2C).
Internal evaluations.
Index is defined as
Index = [(1 + realsamples) * (1 + clearsites) / (1 + percent.NA)] / no. sites
where
intensity = total signal - (total signal x percent NA/100)
clearsites = no: sites - sites culled by slope
realsamples = no: samples – (no: samples x percent single site samples x 100)
no. sites = number of modification sites in the cluster.
This formula is modified from that previously defined (23): ‘‘single site samples’’ is the number of cases where a sample in the cluster contains only one site, and ‘‘single sample sites’’ represents the number of cases where a site in the cluster is represented in only one sample. The ‘‘culled by slope’’ function sorts sites and samples from largest to smallest within each cluster and measures the slope of the regression line for each site in all the samples. If the slope is negative, the site follows the general pattern in the cluster. If the slope is positive, the site is more highly expressed in different samples than the rest of the group, and is culled.
External evaluation.
The Pathway Commons data set was extracted from publicly available resources (20). Interactions were filtered to include only ‘in-complex-with’, “controls-phosphorylation-of”, “controls-state-change-of”, “controls-expression-of”, and “controls-transport-of.” The gene names of modified proteins were used to retrieve interactions among proteins within all clusters and the number of edges were quantified.
Protein-proteins interaction edges were retrieved from Pathway Commons as described above, and from STRING, GeneMANIA (using the website or the Cytoscape plugin)(15, 16), BioPlex (12), and the kinase-substrate data from PhosphositePlus (13, 14). Text-mining, colocalization, and co-expression edges were excluded to focus on interactions that are likely part of cell signaling pathways. We found it most useful to limit interactions to those defined by direct physical interactions from curated pathways. For example, genetic interactions may be direct or indirect, so they were excluded in some cases to focus on direct physical interactions (84). A CFN was constructed from a PPI dataset with highly curated molecular interactions with a focus on direct interactions for which there is strong evidence (Figure 8C; refs. 20, 55).
Network analyses.
For the CCCN we used clustering to filter correlations between all sites. The resulting protein CCCN was used to create a cluster-filtered network (CFN) of PPI interactions that were filtered based on clustering by excluding all interactions save those from proteins with co-clustered modifications. To identify pathways that are likely to be active in lung cancer cell lines, shortest paths were determined using the R package, igraph (igraph.org). A composite of all shortest paths was assembled for Figures 2A, 2B, and 3D. Centrality was identified by node degree and betweenness, calculated using igraph functions. Networks were also graphed to show protein modifications with correlation edges from the CCCN. In the CCCN graphs, correlation edges depict PTMs that co-cluster with edges representing Spearman correlations greater than the threshold of |0.543| as defined in Figure S9. Additionally, for Figures 5B, 7B, and 7D, negative correlations less than –0.5 are shown between different modifications within the same protein.
Website construction.
To enable exploration of the networks in detail by other investigators, we developed a website for interactive visualization (https://cynetworkbrowser.umt.edu/). Our novel infrastructure allows a web client (browser) to interface to a server-based instance of Cytoscape. Networks and their underpinning data are stored on the server as R data files, and each web session corresponds to a instance of Cytoscape on the server. The web client presents a graph rendered by the Javascript library, cytoscape.js. Actions on the site initiate queries to the Python server which in turn employs the R-to-python interface (rpy2) to call the relevant R function. R communicates with the server-based instance of Cytoscape via the RCy3 library (bioconductor.org)(85). The cyREST interface (86) returns updated graph information to the client, in the form of JSON data, by connecting Cytoscape to a Python Flask-WSGI server.
Cell fractionation.
H3122 cells were treated with 1 nM geldanamycin for 15 hours or not treated, then mechanically permeabilized using a Balch homogenizer (10, 46, 47). Permeabilized cells were centrifuged at 1000 x g 10 min, and the organelles in the supernatant applied to velocity sedimentation gradients as described previously (10, 46). Four fractions were collected from organelle gradients as shown in Figure 9A. Lysosomes are found in fraction 1; endosomes in fractions 2–3 (10, 46). The 1000 x g pellet (cell ghosts) were solubilized 1.5 hours on ice in 1% Triton X-100 and subjected to floatation equilibrium gradients as described, except the 10,000 x g centrifugation step was omitted (10, 47). Four fractions from floatation equilibrium gradients were collected: fraction 1 is from the bottom of the gradient, fraction 2 contains the lipid rafts as previously characterized, and fractions 3 and 4 contain additional floating membranes at the top of the gradient as shown in Figure 9A. Samples were prepared for TMT mass spectrometry as described above except without immunoprecipitation with modification-specific antibodies, so total protein amounts were measured; ten mass tag labels were used (Thermo TMTplex); and samples were analyzed on an Orbitrap Fusion Lumos (ThermoFisher). The iBAQ method was used to normalize signals, where a protein’s total intensity is divided by the number of tryptic peptides between 6 and 30 amino acids in length (87). Western blots with lysates from H3122 and H3255 cells were then performed to verify results from select proteins in duplicate experiments. Antibodies to β-actin (#4970), phospho-CTTN Tyr421 (#4569), CTTN (#3503), phospho-ERK1/2 Thr202/Tyr204 (#4370), CCT2 (#3561), CLTC (#4796), CRKL (#3182), LASP1 (#8636), and YWHAZ (#7413) were from Cell Signaling Technology; antibody to ERK1/2 (sc-93) was from Santa Cruz Biotechnology. All antibodies were incubated at 1:1000 (except phospho-ERK1/2, 1:2000) overnight at 4°C according to the manufacturers’ protocol. Duplicate blots were used to probe phospho- and non-phospho-CTTN and ERK1/2. Western blot chemiluminescent signals were obtained on a Fuji LAS-3000 and quantified using ImageGauge software. The amount of each protein in each fraction as a percent in the whole cell was then calculated by dividing western blot or mass spectrometry signals by the total in all fractions (10, 47). Ratios were then calculated to compare geldanamycin-treated to control samples.
Supplementary Material
Data file S1: Cytoscape file: Complete co-cluster correlation network.
Text S1: Data analysis considerations and network development.
Figure S1. Example t-SNE embeddings.
Figure S2. Initial evaluation of clusters derived from t-SNE embeddings.
Figure S3. Correlation between replicates.
Figure S4. Number of edges per gene in clusters.
Figure S5. Correlation between degree and betweenness.
Figure S6. CFN betweenness is not biased by overrepresentation in PPI databases.
Figure S7. Number of modifications weakly correlates with CFN betweenness.
Figure S8. The effect of applying PTM correlation threshold on CFNs.
Figure S9. Network density as a function of PTM correlation threshold defines a minimum for construction of a PTM CCCN.
Figure S10. Relative network density of drug-affected proteins.
Figure S11. EP300 interactions with PTM-modifying enzymes.
Figure S12. Combined EP300 CCCN and CFN.
Figure S13. Comparison of tyrosine phosphorylation, serine/threonine phosphorylation, and acetylation.
Figure S14. Western blot data from cell fractionation experiments.
Figure S15. Separation of tyrosine and serine/threonine phosphorylation and relative abundance compared to paxDB.
Table S1: Proteins with PTMs that have negative correlations:
Table S2: Amount of proteins in cell fractions
Acknowledgements:
MG and MC dedicate this paper to the memory of Edward Herbert. We thank Sean Beausoleil for data wrangling and discussions, Ailan Guo for antibody information, Nicolas Fernandez for the gene expression clustergrammer visualization, and Jed Syrenne for comments on the manuscript.
Funding: This work was supported by the NIH grants BD2K LINCS Data Coordination and Integration Center (DCIC) (grant number U54HL127624) and Knowledge Management Center (KMC) for the Illuminating the Druggable Genome (IDG) project (grant number U24CA224260). Experimental data was obtained at Cell Signaling Technology.
Footnotes
Competing interests: The authors declare that they have no competing interests. M.C. is founder and CEO of Cell Signaling Technology and Bluefin Biomedicine.
Data and Materials Availability: There are patents on the generation of the motif antibodies and PTM scan technology used in this study. Data are available at https://www.phosphosite.org/, and networks may be explored at https://cynetworkbrowser.umt.edu/. All other data needed to evaluate the conclusions in the paper are present in the paper or the Supplementary Materials.
References and Notes
- 1.Wang Y-C, Peterson SE, Loring JF, Protein post-translational modifications and regulation of pluripotency in human stem cells. Cell Res 24, 143–160 (2014). [DOI] [PMC free article] [PubMed] [Google Scholar]
- 2.Liu BA, Nash PD, Evolution of SH2 domains and phosphotyrosine signalling networks. Philos Trans R Soc Lond, B, Biol Sci 367, 2556–2573 (2012). [DOI] [PMC free article] [PubMed] [Google Scholar]
- 3.Gross S, Rahal R, Stransky N, Lengauer C, Hoeflich KP, Targeting cancer with kinase inhibitors. J. Clin. Invest 125, 1780–1789 (2015). [DOI] [PMC free article] [PubMed] [Google Scholar]
- 4.Buuh ZY, Lyu Z, Wang RE, Interrogating the Roles of Post-Translational Modifications of Non-Histone Proteins. J. Med. Chem, acs.jmedchem.6b01817 (2017). [DOI] [PubMed]
- 5.Filippakopoulos P, Knapp S, Targeting bromodomains: epigenetic readers of lysine acetylation. Nat Rev Drug Discov 13, 337–356 (2014). [DOI] [PubMed] [Google Scholar]
- 6.Pérez-Salvia M, Esteller M, Bromodomain inhibitors and cancer therapy: From structures to applications. Epigenetics 12, 323–339 (2017). [DOI] [PMC free article] [PubMed] [Google Scholar]
- 7.Wu Z, Connolly J, Biggar KK, Beyond histones - the expanding roles of protein lysine methylation. FEBS J 284, 2732–2744 (2017). [DOI] [PubMed] [Google Scholar]
- 8.Sambataro F, Pennuto M, Post-translational Modifications and Protein Quality Control in Motor Neuron and Polyglutamine Diseases. Front Mol Neurosci 10, 82 (2017). [DOI] [PMC free article] [PubMed] [Google Scholar]
- 9.Liu J, Qian C, Cao X, Post-Translational Modification Control of Innate Immunity. Immunity 45, 15–30 (2016). [DOI] [PubMed] [Google Scholar]
- 10.Palacios-Moreno J et al. , Neuroblastoma Tyrosine Kinase Signaling Networks Involve FYN and LYN in Endosomes and Lipid Rafts. PLoS Comp Biol 11, e1004130–33 (2015). [DOI] [PMC free article] [PubMed] [Google Scholar]
- 11.Cerami EG et al. , Pathway Commons, a web resource for biological pathway data. Nucleic Acids Res 39, D685–90 (2011). [DOI] [PMC free article] [PubMed] [Google Scholar]
- 12.Huttlin EL et al. , The BioPlex Network: A Systematic Exploration of the Human Interactome 162, 425–440 (2015). [DOI] [PMC free article] [PubMed] [Google Scholar]
- 13.Hornbeck PV et al. , PhosphoSitePlus, 2014: mutations, PTMs and recalibrations. Nucleic Acids Res 43, D512–20 (2015). [DOI] [PMC free article] [PubMed] [Google Scholar]
- 14.Hornbeck PV et al. , PhosphoSitePlus: a comprehensive resource for investigating the structure and function of experimentally determined post-translational modifications in man and mouse. Nucleic Acids Res 40, D261–70 (2012). [DOI] [PMC free article] [PubMed] [Google Scholar]
- 15.Warde-Farley D et al. , The GeneMANIA prediction server: biological network integration for gene prioritization and predicting gene function. Nucleic Acids Res 38, W214–20 (2010). [DOI] [PMC free article] [PubMed] [Google Scholar]
- 16.Szklarczyk D et al. , The STRING database in 2017: quality-controlled protein-protein association networks, made broadly accessible. Nucleic Acids Res 45, D362–D368 (2017). [DOI] [PMC free article] [PubMed] [Google Scholar]
- 17.Vidal M, Cusick ME, Barabási A-L, Interactome networks and human disease 144, 986–998 (2011). [DOI] [PMC free article] [PubMed] [Google Scholar]
- 18.Bensimon A, Heck AJR, Aebersold R, Mass spectrometry-based proteomics and network biology. Annu Rev Biochem 81, 379–405 (2012). [DOI] [PubMed] [Google Scholar]
- 19.Ma’ayan A et al. , Formation of regulatory patterns during signal propagation in a Mammalian cellular network. Science 309, 1078–1083 (2005). [DOI] [PMC free article] [PubMed] [Google Scholar]
- 20.Rouillard AD et al. , The harmonizome: a collection of processed datasets gathered to serve and mine knowledge about genes and proteins. Database (Oxford) 2016, baw100 (2016). [DOI] [PMC free article] [PubMed]
- 21.Rezza A et al. , Signaling Networks among Stem Cell Precursors, Transit-Amplifying Progenitors, and their Niche in Developing Hair Follicles. Cell Rep 14, 3001–3018 (2016). [DOI] [PMC free article] [PubMed] [Google Scholar]
- 22.Kong D-S et al. , Integrative radiogenomic analysis for multicentric radiophenotype in glioblastoma. Oncotarget 7, 11526–11538 (2016). [DOI] [PMC free article] [PubMed] [Google Scholar]
- 23.Grimes ML, Lee W-J, van der Maaten L, Shannon P, Wrangling phosphoproteomic data to elucidate cancer signaling pathways 8, e52884 (2013). [DOI] [PMC free article] [PubMed] [Google Scholar]
- 24.Janes KA, Yaffe MB, Data-driven modelling of signal-transduction networks. Nature Publishing Group 7, 820–828 (2006). [DOI] [PubMed] [Google Scholar]
- 25.Steffen M, Petti A, Aach J, D’haeseleer P, Church G, Automated modelling of signal transduction networks. BMC Bioinformatics 3, 34 (2002). [DOI] [PMC free article] [PubMed] [Google Scholar]
- 26.Stokes MP, Gu H, Silva JC, in Apoptosis Methods in Toxicology (Springer New York, New York, NY, 2016), Methods in Pharmacology and Toxicology, pp. 163–178. [Google Scholar]
- 27.Gu H, Stokes MP, Silva JC, in Analysis of Post-Translational Modifications and Proteolysis in Neuroscience (Springer New York, New York, NY, 2015), vol. 114 of Neuromethods, pp. 1–29. [Google Scholar]
- 28.Stokes MP et al. , PTMScan direct: identification and quantification of peptides from critical signaling proteins by immunoaffinity enrichment coupled with LC-MS/MS. Mol Cell Proteomics 11, 187–201 (2012). [DOI] [PMC free article] [PubMed] [Google Scholar]
- 29.Engholm-Keller K et al. , TiSH — a robust and sensitive global phosphoproteomics strategy employing a combination of TiO2, SIMAC, and HILIC. Journal of proteomics 75, 5749–5761 (2012). [DOI] [PubMed] [Google Scholar]
- 30.Wiśniewski JR, Mann M, Consecutive Proteolytic Digestion in an Enzyme Reactor Increases Depth of Proteomic and Phosphoproteomic Analysis. Anal. Chem 84, 2631–2637 (2012). [DOI] [PubMed] [Google Scholar]
- 31.Gilmore JM, Kettenbach AN, Gerber SA, Increasing phosphoproteomic coverage through sequential digestion by complementary proteases. Anal Bioanal Chem 402, 711–720 (2011). [DOI] [PMC free article] [PubMed] [Google Scholar]
- 32.Olsen JV et al. , Quantitative Phosphoproteomics Reveals Widespread Full Phosphorylation Site Occupancy During Mitosis. Sci Signal 3, ra3–ra3 (2010). [DOI] [PubMed] [Google Scholar]
- 33.Michalski A et al. , Ultra High Resolution Linear Ion Trap Orbitrap Mass Spectrometer (Orbitrap Elite) Facilitates Top Down LC MS/MS and Versatile Peptide Fragmentation Modes. Mol Cell Proteomics 11, O111.013698–O111.013698 (2012). [DOI] [PMC free article] [PubMed] [Google Scholar]
- 34.Bai B et al. , Deep Profiling of Proteome and Phosphoproteome by Isobaric Labeling, Extensive Liquid Chromatography, and Mass Spectrometry. Meth. Enzymol 585, 377–395 (2017). [DOI] [PMC free article] [PubMed] [Google Scholar]
- 35.van der Maaten L, Hinton G, Visualizing Data using t-SNE. Journal of Machine Learning Research 9, 2579–2605 (2008). [Google Scholar]
- 36.Bushati N, Smith J, Briscoe J, Watkins C, An intuitive graphical visualization technique for the interrogation of transcriptome data. Nucleic Acids Res 39, 7380–7389 (2011). [DOI] [PMC free article] [PubMed] [Google Scholar]
- 37.Platzer A, Visualization of SNPs with t-SNE. PLoS ONE 8, e56883–6 (2013). [DOI] [PMC free article] [PubMed] [Google Scholar]
- 38.van der Maaten L, Accelerating t-SNE using Tree-Based Algorithms. Journal of Machine Learning Research 15, 3221–3245 (2014). [Google Scholar]
- 39.Met, metastasis, motility and more. Nat Rev Mol Cell Biol 4, 915–925 (2003). [DOI] [PubMed] [Google Scholar]
- 40.Koytiger G et al. , Phosphotyrosine signaling proteins that drive oncogenesis tend to be highly interconnected. Mol Cell Proteomics 12, 1204–1213 (2013). [DOI] [PMC free article] [PubMed] [Google Scholar]
- 41.Gang X et al. , P300 acetyltransferase regulates fatty acid synthase expression, lipid metabolism and prostate cancer growth. Oncotarget 7, 15135–15149 (2016). [DOI] [PMC free article] [PubMed] [Google Scholar]
- 42.Verba KA, Agard DA, How Hsp90 and Cdc37 Lubricate Kinase Molecular Switches. Trends in Biochemical Sciences 42, 799–811 (2017). [DOI] [PMC free article] [PubMed] [Google Scholar]
- 43.Barr DJ, Ostermeyer-Fay AG, Matundan RA, Brown DA, Clathrin-independent endocytosis of ErbB2 in geldanamycin-treated human breast cancer cells. Journal of Cell Science 121, 3155–3166 (2008). [DOI] [PMC free article] [PubMed] [Google Scholar]
- 44.Cortese K et al. , The HSP90 inhibitor geldanamycin perturbs endosomal structure and drives recycling ErbB2 and transferrin to modified MVBs/lysosomal compartments. Mol Biol Cell 24, 129–144 (2013). [DOI] [PMC free article] [PubMed] [Google Scholar]
- 45.Sorkin A, Goh LK, Endocytosis and intracellular trafficking of ErbBs. Exp Cell Res 315, 683–696 (2009). [DOI] [PubMed] [Google Scholar]
- 46.McCaffrey G, Welker J, Scott J, der Salm LV, Grimes ML, High-resolution fractionation of signaling endosomes containing different receptors 10, 938–950 (2009). [DOI] [PMC free article] [PubMed] [Google Scholar]
- 47.Pryor S, McCaffrey G, Young LR, Grimes ML, NGF Causes TrkA to Specifically Attract Microtubules to Lipid Rafts 7, e35163 (2012). [DOI] [PMC free article] [PubMed] [Google Scholar]
- 48.Chen EY et al. , Enrichr: interactive and collaborative HTML5 gene list enrichment analysis tool. BMC Bioinformatics 14, 128 (2013). [DOI] [PMC free article] [PubMed] [Google Scholar]
- 49.Cancer Genome Atlas Research Network et al. , The Cancer Genome Atlas Pan-Cancer analysis project. Nat. Genet 45, 1113–1120 (2013). [DOI] [PMC free article] [PubMed] [Google Scholar]
- 50.Fernandez NF et al. , Clustergrammer, a web-based heatmap visualization and analysis tool for high-dimensional biological data. Sci Data 4, 170151 (2017). [DOI] [PMC free article] [PubMed] [Google Scholar]
- 51.Orvis T et al. , BRG1/SMARCA4 inactivation promotes non-small cell lung cancer aggressiveness by altering chromatin organization. Cancer Res 74, 6486–6498 (2014). [DOI] [PMC free article] [PubMed] [Google Scholar]
- 52.Winslow MM et al. , Suppression of lung adenocarcinoma progression by Nkx2–1. Nature 473, 101–104 (2011). [DOI] [PMC free article] [PubMed] [Google Scholar]
- 53.Snyder EL et al. , Nkx2–1 Represses a Latent Gastric Differentiation Program in Lung Adenocarcinoma. Mol Cell 50, 185–199 (2013). [DOI] [PMC free article] [PubMed] [Google Scholar]
- 54.Herriges MJ et al. , The NANCI-Nkx2.1 gene duplex buffers Nkx2.1 expression to maintain lung development and homeostasis. Genes & Development 31, 889–903 (2017). [DOI] [PMC free article] [PubMed] [Google Scholar]
- 55.Berger SI, Posner JM, Ma’ayan A, Genes2Networks: connecting lists of gene symbols using mammalian protein interactions databases. BMC Bioinformatics 8, 372 (2007). [DOI] [PMC free article] [PubMed] [Google Scholar]
- 56.Wang M et al. , PaxDb, a database of protein abundance averages across all three domains of life. Mol Cell Proteomics 11, 492–500 (2012). [DOI] [PMC free article] [PubMed] [Google Scholar]
- 57.Sebti S et al. , BAG6/BAT3 modulates autophagy by affecting EP300/p300 intracellular localization. Autophagy 10, 1341–1342 (2014). [DOI] [PMC free article] [PubMed] [Google Scholar]
- 58.Mariño G et al. , Regulation of Autophagy by Cytosolic Acetyl-Coenzyme A. Mol Cell 53, 710–725 (2014). [DOI] [PubMed] [Google Scholar]
- 59.Deribe YL et al. , Regulation of Epidermal Growth Factor Receptor Trafficking by Lysine Deacetylase HDAC6. Sci. Signal 2, ra84–ra84 (2009). [DOI] [PubMed] [Google Scholar]
- 60.Katayama R et al. , Therapeutic strategies to overcome crizotinib resistance in non-small cell lung cancers harboring the fusion oncogene EML4-ALK. Proc Natl Acad Sci USA 108, 7535–7540 (2011). [DOI] [PMC free article] [PubMed] [Google Scholar]
- 61.Esfahani K, Cohen V, HSP90 as a novel molecular target in non-small-cell lung cancer. Lung Cancer (Auckl) 7, 11–17 (2016). [DOI] [PMC free article] [PubMed] [Google Scholar]
- 62.Shimamura T, Shapiro GI, Heat shock protein 90 inhibition in lung cancer. J Thorac Oncol 3, S152–9 (2008). [DOI] [PMC free article] [PubMed] [Google Scholar]
- 63.Woodsmith J, Kamburov A, Stelzl U, Dual coordination of post translational modifications in human protein networks. PLoS Comp Biol 9, e1002933 (2013). [DOI] [PMC free article] [PubMed] [Google Scholar]
- 64.Minguez P et al. , Deciphering a global network of functionally associated post-translational modifications. Mol. Syst. Biol 8, 599 (2012). [DOI] [PMC free article] [PubMed] [Google Scholar]
- 65.Duan G, Walther D, The roles of post-translational modifications in the context of protein interaction networks. PLoS Comp Biol 11, e1004049 (2015). [DOI] [PMC free article] [PubMed] [Google Scholar]
- 66.Tay AP, Pang CNI, Winter DL, Wilkins MR, PTMOracle: A Cytoscape App for Covisualizing and Coanalyzing Post-Translational Modifications in Protein Interaction Networks. J Proteome Res 16, 1988–2003 (2017). [DOI] [PubMed] [Google Scholar]
- 67.Maurer-Stroh S et al. , The Tudor domain “Royal Family”: Tudor, plant Agenet, Chromo, PWWP and MBT domains. Trends in Biochemical Sciences 28, 69–74 (2003). [DOI] [PubMed] [Google Scholar]
- 68.Parton RM, Davidson A, Davis I, Weil TT, Subcellular mRNA localisation at a glance. Journal of Cell Science 127, 2127–2133 (2014). [DOI] [PMC free article] [PubMed] [Google Scholar]
- 69.Decker CJ, Parker R, P-bodies and stress granules: possible roles in the control of translation and mRNA degradation. Cold Spring Harbor Perspectives in Biology 4, a012286–a012286 (2012). [DOI] [PMC free article] [PubMed] [Google Scholar]
- 70.Morris KV, Mattick JS, The rise of regulatory RNA. Nat Rev Genet 15, 423–437 (2014). [DOI] [PMC free article] [PubMed] [Google Scholar]
- 71.Engreitz JM, Ollikainen N, Guttman M, Long non-coding RNAs: spatial amplifiers that control nuclear structure and gene expression. Nat Rev Mol Cell Biol 17, 756–770 (2016). [DOI] [PubMed] [Google Scholar]
- 72.Shively CA et al. , Large-Scale Analysis of Kinase Signaling in Yeast Pseudohyphal Development Identifies Regulation of Ribonucleoprotein Granules. PLoS Genet 11, e1005564 (2015). [DOI] [PMC free article] [PubMed] [Google Scholar]
- 73.Corkery DP, Holly AC, Lahsaee S, Dellaire G, Connecting the speckles: Splicing kinases and their role in tumorigenesis and treatment response. Nucleus, 1–10 (2015). [DOI] [PMC free article] [PubMed]
- 74.Peschard P et al. , Mutation of the c-Cbl TKB Domain Binding Site on the Met Receptor Tyrosine Kinase Converts It into a Transforming Protein. Mol Cell 8, 995–1004 (2001). [DOI] [PubMed] [Google Scholar]
- 75.Sigismund S et al. , Threshold-controlled ubiquitination of the EGFR directs receptor fate. EMBO J 32, 2140–2157 (2013). [DOI] [PMC free article] [PubMed] [Google Scholar]
- 76.Smits AH et al. , Global absolute quantification reveals tight regulation of protein expression in single Xenopus eggs. Nucleic Acids Res 42, 9880–9891 (2014). [DOI] [PMC free article] [PubMed] [Google Scholar]
- 77.Peshkin L et al. , On the Relationship of Protein and mRNA Dynamics in Vertebrate Embryonic Development. Dev Cell 35, 383–394 (2015). [DOI] [PMC free article] [PubMed] [Google Scholar]
- 78.Steen JAJ et al. , Different phosphorylation states of the anaphase promoting complex in response to antimitotic drugs: a quantitative proteomic analysis. Proc Natl Acad Sci USA 105, 6069–6074 (2008). [DOI] [PMC free article] [PubMed] [Google Scholar]
- 79.Martz CA et al. , Systematic identification of signaling pathways with potential to confer anticancer drug resistance. Sci Signal 7, ra121–ra121 (2014). [DOI] [PMC free article] [PubMed] [Google Scholar]
- 80.Svinkina T et al. , Deep, Quantitative Coverage of the Lysine Acetylome Using Novel Anti-acetyl-lysine Antibodies and an Optimized Proteomic Workflow. Mol Cell Proteomics 14, 2429–2440 (2015). [DOI] [PMC free article] [PubMed] [Google Scholar]
- 81.Guo A et al. , Immunoaffinity enrichment and mass spectrometry analysis of protein methylation. Mol Cell Proteomics 13, 372–387 (2014). [DOI] [PMC free article] [PubMed] [Google Scholar]
- 82.Possemato AP et al. , Multiplexed Phosphoproteomic Profiling Using Titanium Dioxide and Immunoaffinity Enrichments Reveals Complementary Phosphorylation Events. J Proteome Res 16, 1506–1514 (2017). [DOI] [PMC free article] [PubMed] [Google Scholar]
- 83.Beausoleil SA, Villén J, Gerber SA, Rush J, Gygi SP, A probability-based approach for high-throughput protein phosphorylation analysis and site localization. Nat Biotechnol 24, 1285–1292 (2006). [DOI] [PubMed] [Google Scholar]
- 84.Lin A, Wang RT, Ahn S, Park CC, Smith DJ, A genome-wide map of human genetic interactions inferred from radiation hybrid genotypes. Genome Research 20, 1122–1132 (2010). [DOI] [PMC free article] [PubMed] [Google Scholar]
- 85.Shannon PT, Grimes M, Kutlu B, Bot JJ, Galas DJ, RCytoscape: tools for exploratory network analysis. BMC Bioinformatics 14, 217 (2013). [DOI] [PMC free article] [PubMed] [Google Scholar]
- 86.Ono K, Muetze T, Kolishovski G, Shannon P, Demchak B, CyREST: Turbocharging Cytoscape Access for External Tools via a RESTful API. F1000Res 4, 478 (2015). [DOI] [PMC free article] [PubMed] [Google Scholar]
- 87.Arike L et al. , Comparison and applications of label-free absolute proteome quantification methods on Escherichia coli. Journal of proteomics 75, 5437–5448 (2012). [DOI] [PubMed] [Google Scholar]
- 88.Witten DM, Tibshirani R, Hastie T, A penalized matrix decomposition, with applications to sparse principal components and canonical correlation analysis. Biostatistics 10, 515–534 (2009). [DOI] [PMC free article] [PubMed] [Google Scholar]
- 89.Raddatz BB et al. , Microarray-Based Gene Expression Analysis for Veterinary Pathologists: A Review. Vet. Pathol 54, 300985817709887–755 (2017). [DOI] [PubMed] [Google Scholar]
- 90.Mostafavi S, Morris Q, Combining many interaction networks to predict gene function and analyze gene lists. Proteomics 12, 1687–1696 (2012). [DOI] [PubMed] [Google Scholar]
- 91.Khatri P, Sirota M, Butte AJ, Ten years of pathway analysis: current approaches and outstanding challenges. PLoS Comp Biol 8, e1002375 (2012). [DOI] [PMC free article] [PubMed] [Google Scholar]
Associated Data
This section collects any data citations, data availability statements, or supplementary materials included in this article.
Supplementary Materials
Data file S1: Cytoscape file: Complete co-cluster correlation network.
Text S1: Data analysis considerations and network development.
Figure S1. Example t-SNE embeddings.
Figure S2. Initial evaluation of clusters derived from t-SNE embeddings.
Figure S3. Correlation between replicates.
Figure S4. Number of edges per gene in clusters.
Figure S5. Correlation between degree and betweenness.
Figure S6. CFN betweenness is not biased by overrepresentation in PPI databases.
Figure S7. Number of modifications weakly correlates with CFN betweenness.
Figure S8. The effect of applying PTM correlation threshold on CFNs.
Figure S9. Network density as a function of PTM correlation threshold defines a minimum for construction of a PTM CCCN.
Figure S10. Relative network density of drug-affected proteins.
Figure S11. EP300 interactions with PTM-modifying enzymes.
Figure S12. Combined EP300 CCCN and CFN.
Figure S13. Comparison of tyrosine phosphorylation, serine/threonine phosphorylation, and acetylation.
Figure S14. Western blot data from cell fractionation experiments.
Figure S15. Separation of tyrosine and serine/threonine phosphorylation and relative abundance compared to paxDB.
Table S1: Proteins with PTMs that have negative correlations:
Table S2: Amount of proteins in cell fractions