Abstract
Background
Subsolid pulmonary nodules, comprising pure ground-glass nodules (GGNs) and part-solid nodules (PSNs), have a high risk of indolent malignancy. Lung Imaging Reporting and Data System (Lung-RADS) nodule management guidelines are based on expert opinion and lack independent validation.
Purpose
To evaluate Lung-RADS estimates of the malignancy rates of subsolid nodules, using nodules from the National Lung Screening Trial (NLST), and to compare Lung-RADS to the NELSON trial classification as well as the Brock University calculator.
Materials and Methods
Subsets of GGNs and PSNs were selected from the NLST for this retrospective study. A thoracic radiologist reviewed the baseline and follow-up CT images, confirmed that they were true subsolid nodules, and measured the nodules. The primary outcome for each nodule was the development of malignancy within the follow-up period (median, 6.5 years). Nodules were stratified according to Lung-RADS, NELSON trial criteria, and the Brock model. For analyses, nodule subsets were weighted on the basis of frequency in the NLST data set. Nodule stratification models were tested by using receiver operating characteristic curves.
Results
A total of 622 nodules were evaluated, of which 434 nodules were subsolid. At baseline, 304 nodules were classified as Lung-RADS category 2, with a malignancy rate of 3%, which is greater than the 1% in Lung-RADS (P = .004). The malignancy rate for GGNs smaller than 10 mm (two of 129, 1.3%) was smaller than that for GGNs measuring 10–19 mm (11 of 153, 6%) (P = .01). The malignancy rate for Lung-RADS category 3 was 14% (13 of 67), which is greater than the reported 2% in Lung-RADS (P < .001). The Brock model predicted malignancy better than Lung-RADS and the NELSON trial scheme (area under the receiver operating characteristic curve = 0.78, 0.70, and 0.67, respectively; P = .02 for Brock model vs NELSON trial scheme).
Conclusion
Subsolid nodules classified as Lung Imaging Reporting and Data System (Lung-RADS) categories 2 and 3 have a higher risk of malignancy than reported. The Brock risk calculator performed better than measurement-based classification schemes such as Lung-RADS.
© RSNA, 2019
Online supplemental material is available for this article.
See also the editorial by Kauczor and von Stackelberg in this issue.
Summary
Subsolid nodules in Lung Imaging Reporting and Data System (Lung-RADS) categories 2 and 3 have a higher risk of malignancy than reported, and ground-glass nodules measuring 10–19 mm have a risk that is closer to Lung-RADS category 3 than Lung-RADS category 2; there does not appear to be an advantage to using volumetric (NELSON) compared with linear measurement (Lung-RADS) classification schemes.
Key Results
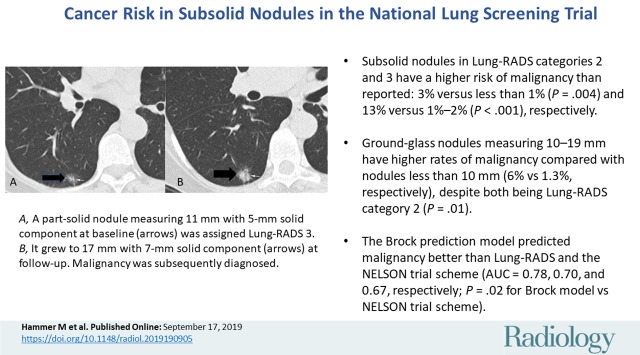
■ Subsolid nodules in Lung-RADS categories 2 and 3 have a higher risk of malignancy than reported: 3% versus less than 1% (P = .004) and 13% versus 1%–2%, (P < .001) respectively.
■ Ground-glass nodules measuring 10–19 mm have a much higher rate of malignancy compared with ground-glass nodules smaller than 10 mm (6% vs 1.3%, respectively), despite both being Lung-RADS category 2 (P = .01).
■ The Brock prediction model enabled prediction of malignancy better than Lung-RADS and the NELSON trial scheme (area under the receiver operating characteristic curve = 0.78, 0.70, and 0.67, respectively; P = .02 for Brock model vs NELSON trial scheme).
Introduction
Subsolid pulmonary nodules, which include pure ground-glass nodules (GGNs) and part-solid nodules (PSNs), are found in approximately 9% of patients undergoing CT lung cancer screening (1,2). These nodules have a higher risk of malignancy than solid nodules (3), although when malignant they tend to have more indolent behavior than solid lung cancers, with slower growth and lower metastatic potential (2,4). This indolent behavior presents challenges for accurately determining the risk of clinically significant malignancy within these nodules, because malignancies may only be detected after many years of follow-up. In addition, indolent malignancies may contribute to overdiagnosis and/or overtreatment in lung cancer screening (5,6). Given the expected increase in lung cancer screening following the recommendations of the United States Preventive Services Task Force and the Center for Medicare and Medicaid Services, appropriate triage of patients with these nodules will become even more important in the future.
On the basis of expert consensus and insights from lung cancer screening experience including the National Lung Screening Trial (NLST) (7), the American College of Radiology developed the Lung Imaging Reporting and Data system (Lung-RADS) as a framework to follow-up and manage pulmonary nodules (8). Lung-RADS is based on linear measurements of the size of the total nodule and the solid component. Other groups advocate the use of volumetric measurements and volume doubling time, such as the algorithm used for the NELSON screening trial (NELSON is a Dutch acronym for "Nederlands-Leuvens Longkanker Screenings Onderzoek") (9). Separately, several risk calculators have been developed to stratify pulmonary nodules, the most prominent of which is the Brock University calculator, which has been shown to outperform Lung-RADS in NLST data (3,10,11). The best approach to stratifying and managing subsolid nodules remains to be determined, particularly pending full publication of the NELSON trial results.
Given uncertainty in the estimates of malignancy risk in subsolid nodules, we set out to remeasure a large number of subsolid nodules from the NLST. We hypothesized that subsolid nodules have a higher risk of malignancy rate than is currently assessed for Lung-RADS categories 2 and 3. We sought to test which of the current methodologies performs the best for the assessment of subsolid nodule malignancy risk in lung cancer screening CT examinations: a linear measurement-based scheme (Lung-RADS), volumetric measures (NELSON trial), or the Brock University model, which includes patient and nodule characteristics.
Materials and Methods
NLST Data
Consent to access NLST data was obtained from the National Cancer Data Access System of the National Cancer Institute, through a data transfer agreement between the authors and the National Cancer Institute. This retrospective study used nonidentifiable patient data for secondary data analysis and was approved by the institutional review boards at our institutions. Written informed consent was waived for this post hoc analysis.
As a brief review, the NLST was a randomized controlled trial, randomizing current and former smokers to chest radiographs or CT for lung cancer screening. The CT protocol involved one baseline and two subsequent annual screening rounds with low-dose chest CT. Patients were also followed after the three annual rounds to evaluate development of lung cancer and death.
We obtained annotation and CT data from participants in the NLST trial. We selected subsets of patients (nodules) by using the following queries: (a) GGNs smaller than 10 mm; (b) GGNs measuring 10 mm or larger; and (c) “mixed” nodules (PSNs) measuring 6 mm or larger. PSNs smaller than 6 mm were not specifically searched for because identification of solid components in such small nodules is inherently prone to error, and it is not clear that the presence of a very small (and potentially misidentified) solid component in such a small nodule has a malignancy risk profile different from that of a GGN of the same size. The set of GGNs was partitioned according to size because we suspected that there would be a significant difference in malignancy risk based on the size threshold of 10 mm, and we wanted to ensure that we had a representative sample for each of the subsets defined with this threshold.
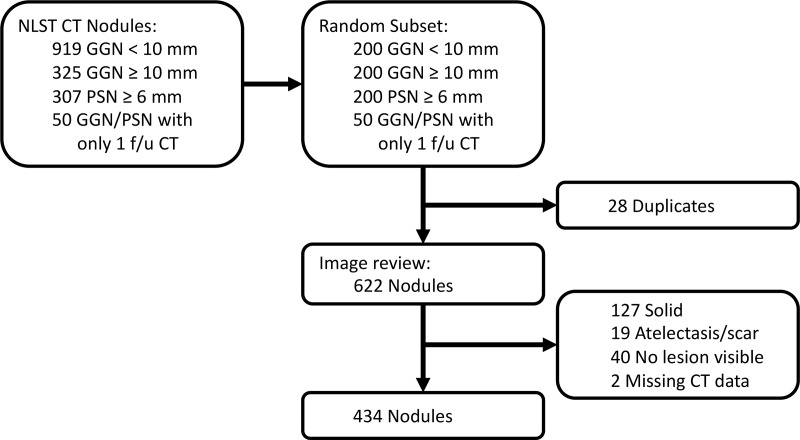
Only patients in the NLST with at least two CT scans (ie, baseline and at least one follow-up) were included to identify nodule growth over time. From the results of each query, 200 patients with baseline and two follow-up CT scans were randomly selected for measurement by radiologists. An additional set of 50 patients was identified with only one follow-up CT available and added to the data set. Because of some patient overlap among the searches (duplication), the final number of patients included for further analysis was 622. Figure 1 shows a flowchart of the number of nodules excluded at each step of analysis.
Figure 1:
Flowchart of the study shows the total number of nodules in the National Lung Screening Trial (NLST) CT arm and how many patients were excluded for this analysis. f/u = follow-up, GGN = ground-glass nodule, PSN = part-solid nodule.
For each nodule, NLST data were used to record whether a cancer was diagnosed in the same lobe as the nodule during follow-up (median follow-up, 6.5 years). The data from NLST did not record information on malignancy on a per-nodule basis, so this proxy for nodule malignancy represents the primary outcome being analyzed.
Nodule Measurement
CT data from the baseline CT and annual follow-up rounds from the selected nodules were loaded into a commercially available advanced visualization software package (Syngo VIA, version VB30; Siemens Healthcare, Erlangen, Germany). This package includes a semiautomated segmentation tool for subsolid nodules.
Data from the NLST annotations were used to supply several variables for calculation of the Brock risk predictor, including patient age, sex, family history of lung cancer, presence of emphysema on CT scans, nodule count, and nodule spiculation. The calculation was then performed using the equation in (10).
The nodule subsets were split into two, and the CT scans for each patient were reviewed by one of two board-certified, fellowship-trained thoracic radiologists (M.M.H. and A.R.H., with 4 and 26 years of dedicated subspecialty experience, respectively). The reviewers were blinded to the patient’s final diagnosis. The largest subsolid nodule for each patient at baseline was evaluated. The radiologist attempted to find the annotated nodule based on section information from the NLST; if unsuccessful, he or she would pick the largest subsolid nodule present on the CT. If an obviously more suspicious subsolid nodule was present, the radiologist would choose the latter. Nodules that were, in the radiologist’s opinion, solid or purely linear (eg, atelectasis) were excluded from further analysis (Fig 2).
Figure 2:
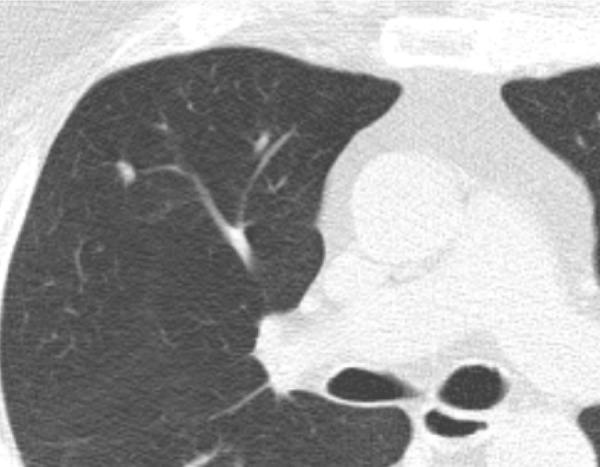
CT scan in 60-year-old man undergoing low-dose lung cancer screening. Scan shows a 6-mm solid polygonal nodule along the right minor fissure described as “mixed” in National Lung Screening Trial annotations. This nodule was stable over 2 years of follow-up and most likely represents an intrapulmonary lymph node.
The radiologist segmented the nodule by using the semiautomated tool, adjusting the segmentation boundaries to best match the nodule. The tool then produced long- and short-axis measurements as well as total lesion volume. The radiologist also measured the size of a solid component, if present, by using lung windows. (The default lung window setting in the software was center of −600, width of 1200, although this was adjustable by the radiologist.)
Lung-RADS and NELSON categories were assigned by using the nodule measurements per the Lung-RADS document and NELSON trial protocol (8,9) using nodule measurement only. For reference, the NELSON categories at baseline are as follows: category 2 for nodules smaller than category 3; category 3 for PSNs or GGNs at least 8 mm diameter or PSNs with a solid component measuring 50–500 mm3; and category 4 for PSNs with a solid component larger than 500 mm3. The NELSON categories at follow-up are as follows: category A (volume doubling time >600 days); category B (volume doubling time 400–600 days); and category C (volume doubling time <400 days or new solid component in a GGN). The Lung-RADS 4× category was not used. Within Lung-RADS category 2, we also evaluated the following subsets: GGN smaller than 10 mm, GGN 10–19 mm, and GGN 20–29 mm.
Statistical Analysis
Data were recorded by using REDCap (Research Electronic Data Capture) electronic data capture tools (12) and downloaded into Microsoft Excel (version 16, Microsoft, Redmond, Wash). Statistical analysis was performed with SAS and JMP Pro software (version 14, SAS Institute, Cary, NC). Because the number of results from the queries 1–3 were not equal, even though the same number of nodules was measured for each query, data from the nodules were reweighted for statistical analysis. In particular, the number of results from query 1 (GGN <10 mm) was 919, compared with 307 and 325 for queries 2 (GGN ≥10 mm) and 3 (PSN ≥6 mm), respectively. Nodules from query 1 were weighted 2.9 times more in the subsequent analyses, using the frequency feature in JMP. In the Results, the true number of nodules measured in each category is given as “n,” while the weighted prevalence and cancer risks are given for the percentages. Statistical tests for proportions were performed using a one-sided binomial test. In particular, for comparison of observed cancer risk to the Lung-RADS document, the upper limit of cancer risk listed in the Lung-RADS document was used as the null hypothesis.
Confidence intervals for areas under the receiver operating characteristic curves were generated by bootstrapping (with 2500 samples). Tests for differences between pairs of receiver operating characteristic curves were performed by using the method described by Hanley and McNeil (13).
The primary aims of this study and the statistical analysis were twofold: (a) comparison of true subsolid nodule cancer risk to those listed in the Lung-RADS document, and (b) comparison of the diagnostic accuracy of the Lung-RADS categories, NELSON trial scheme, and Brock risk predictor for diagnosis of malignancy in subsolid nodules. P values were not corrected for multiplicity of comparisons.
Results
Demographics of the Study Cohort
After exclusion of patients with nodules that were not truly subsolid, 434 patients were included in the analysis. Of these, 220 were women (51%), 387 (89%, 88% weighted) were non-Hispanic white, and 245 (56%, 54% weighted) were former rather than current smokers. The median age was 62 years (range, 55–74 years), and the median smoking history was 48 pack-years (range, 30–212 pack-years). Malignancy was eventually diagnosed in 63 nodules (15%, 10% weighted), of which 41 occurred in the same lobe as the target nodule. Cancers in the cohort were diagnosed at a median of 890 days from NLST randomization (range, 376–2499 days). Only 17 of the 434 patients (4%, 3% weighted) died of lung cancer during the follow-up period.
Nodule Characteristics
Of the 622 nodules manually remeasured, 434 (70%) were deemed to be true subsolid nodules. Nearly half (weighted 45%) were pure GGNs smaller than 10 mm in diameter. The complete size distribution is given in Table 1. Overall, 145 of the 434 nodules (28%) resolved at follow-up imaging and 41 (6%) developed into lung cancer. Forty-four of the 298 nodules (10%) had grown at the first follow-up CT; 74 of 257 nodules (24%) had grown by the second annual follow-up round. Among pure GGNs, 24 of 188 (10%) developed solid components by the second follow-up round.
Table 1:
Distribution and Natural History of Subsolid Nodules
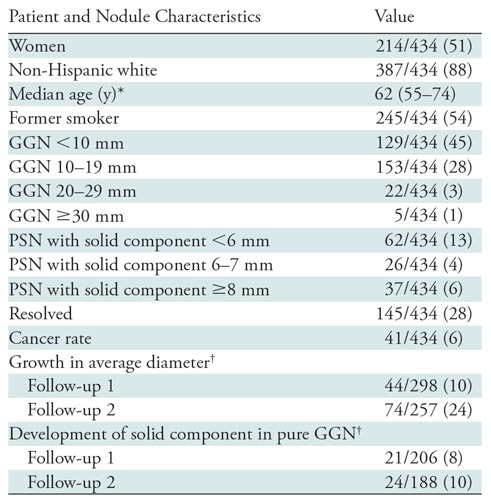
Note.—Nodules are from the National Lung Screening Trial (National Lung Screening Trial Research Team, 2011) (7). Except where indicated, data are numbers of patients, with weighted percentages in parentheses. GGN = ground-glass nodule, PSN = part-solid nodule.
*Numbers in parentheses are the range.
†Of nodules that persist at that follow-up CT.
Malignancy Risk according to Lung-RADS Category at Baseline CT
Of the 434 nodules, 304 (77%) were classified as Lung-RADS category 2 at baseline (Table 2). This category was associated with a 3% risk of malignancy, which is greater than the maximum of 1% listed in the Lung-RADS document (P = .004). Lung-RADS category 3 was associated with a 14% risk of malignancy, which is greater than the maximum of 2% listed in the Lung-RADS document (P < .001). Lung-RADS categories 4A and 4B were associated with 23% and 18% risks of malignancy, respectively; the risk for category 4A lesions was not different from the risk listed in the Lung-RADS document (P = .19).
Table 2:
Lung-RADS Category at Baseline and Risk of Malignancy

Note.—Results show that the observed rate of malignancy for Lung Imaging Reporting and Data System (Lung-RADS) category 2 is higher than that in the Lung-RADS. GGN = ground-glass nodule.
*Expected malignancy rates were obtained from reference 8.
†Data were obtained from the National Lung Screening Trial (7). Numbers in parentheses are weighted percentages.
‡Numbers in parentheses are the 95% confidence intervals.
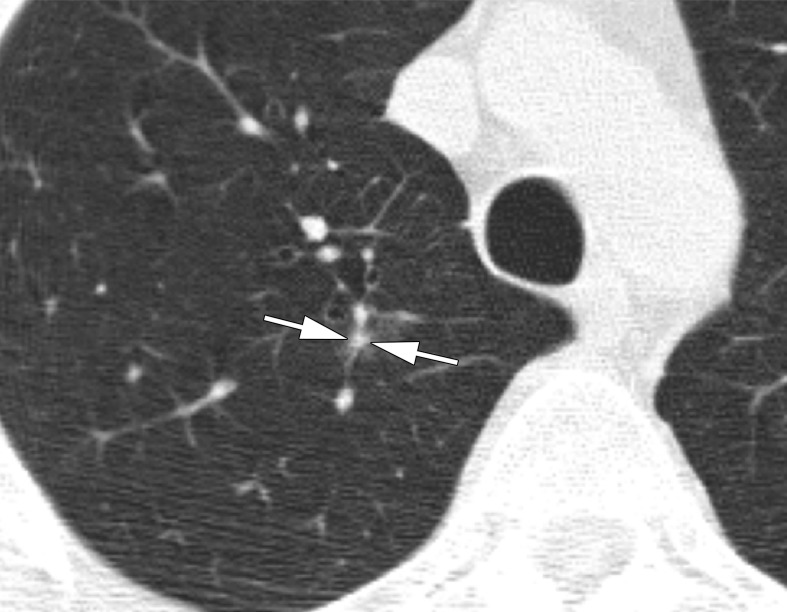
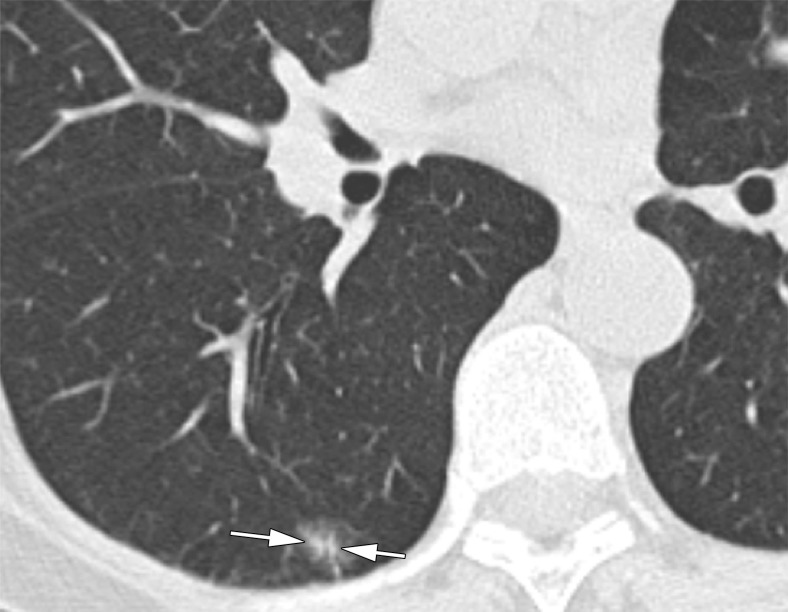
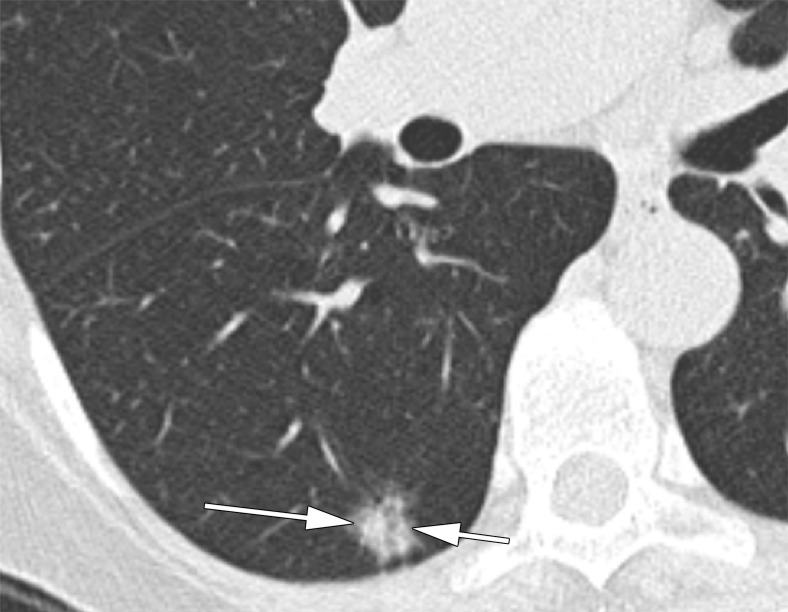
Within Lung-RADS category 2, which encompassed pure GGN smaller than 3 cm, we separated lesions into GGNs smaller than 10 mm, GGNs measuring 10–19 mm, and GGNs measuring 20–29 mm. The malignancy risk in the nodules smaller than 10 mm was only 1.3%, which is not different from the upper limit of 1% for Lung-RADS category 2. However, the 10–19-mm nodules had a malignancy risk of 6%, which is greater than the Lung-RADS risk (P < .001) (Fig 3). Similarly, the 20–29-mm nodules had a higher risk of malignancy than listed in Lung-RADS (9%, P = .02). In addition, direct comparison of the malignancy rates between the nodules smaller than 10 mm and those measuring 10–19 mm yielded P = .01.
Figure 3a:
CT scans in a 57-year-old man undergoing low-dose lung cancer screening. (a) Baseline scan shows a right upper lobe pure ground-glass nodule measuring 11 mm (arrow). Nodule was classified as Lung-RADS category 2. (b, c) CT scans obtained at second annual follow-up show that this nodule grew to 15 mm and developed a 3-mm solid component (arrows). Malignancy was subsequently diagnosed.
Figure 3b:
CT scans in a 57-year-old man undergoing low-dose lung cancer screening. (a) Baseline scan shows a right upper lobe pure ground-glass nodule measuring 11 mm (arrow). Nodule was classified as Lung-RADS category 2. (b, c) CT scans obtained at second annual follow-up show that this nodule grew to 15 mm and developed a 3-mm solid component (arrows). Malignancy was subsequently diagnosed.
Figure 3c:
CT scans in a 57-year-old man undergoing low-dose lung cancer screening. (a) Baseline scan shows a right upper lobe pure ground-glass nodule measuring 11 mm (arrow). Nodule was classified as Lung-RADS category 2. (b, c) CT scans obtained at second annual follow-up show that this nodule grew to 15 mm and developed a 3-mm solid component (arrows). Malignancy was subsequently diagnosed.
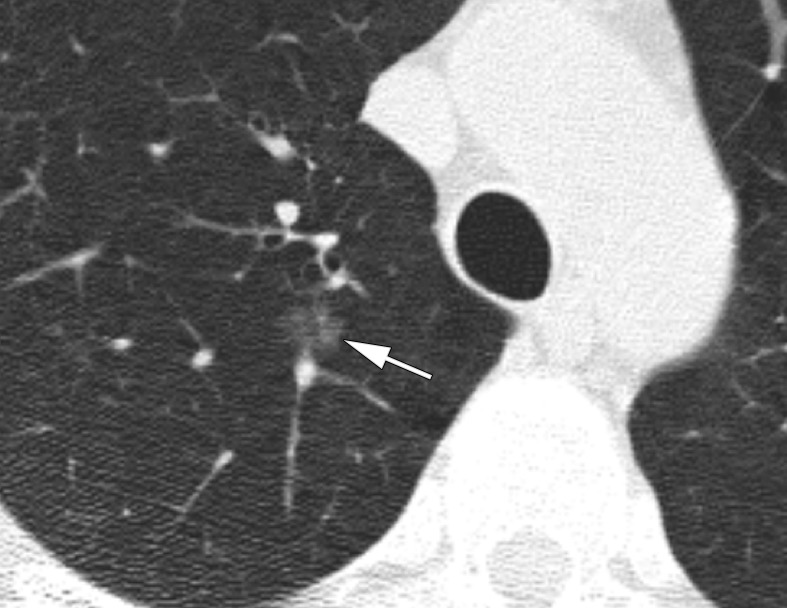
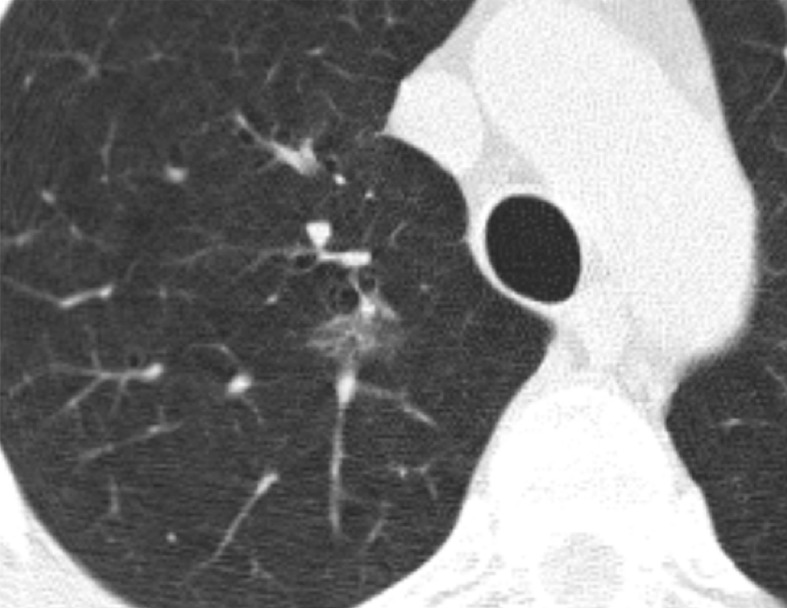
Within Lung-RADS category 3, which encompassed pure GGNs at least 30 mm and PSNs with a solid component smaller than 6 mm (Fig 4), 62 of the 67 nodules (93%) were in the latter category. The malignancy risk in this latter group was 15%.
Figure 4a:
CT scans in a 60-year-old woman undergoing low-dose lung cancer screening CT. (a) Baseline scan shows a right lower lobe part-solid nodule measuring 11 mm with 5-mm solid component (arrows). Nodule was classified as Lung-RADS category 3. (b) Scan obtained at second annual follow-up shows that nodule grew to 17 mm with 7 mm solid component (arrows). Malignancy was subsequently diagnosed.
Figure 4b:
CT scans in a 60-year-old woman undergoing low-dose lung cancer screening CT. (a) Baseline scan shows a right lower lobe part-solid nodule measuring 11 mm with 5-mm solid component (arrows). Nodule was classified as Lung-RADS category 3. (b) Scan obtained at second annual follow-up shows that nodule grew to 17 mm with 7 mm solid component (arrows). Malignancy was subsequently diagnosed.
Malignancy Risk according to Lung-RADS Category at First Follow-up
As with baseline CT, 190 of the 298 (73%) persistent nodules at the first follow-up CT were classified as Lung-RADS category 2 (Table 3). These nodules were associated with a 4% risk of malignancy, which is greater than the 1% listed for the Lung-RADS category 2 (P = .003). Lung-RADS category 3 at follow-up was associated with a 7% risk of malignancy, which is also greater than the 2% listed in the Lung-RADS document (P = .03). Eleven nodules (2%) were classified as Lung-RADS category 4A, with a risk of 64%. This is also higher than the maximum of 15% listed for that category (P = .003). Lung-RADS category 4B was associated with a 33% risk of malignancy, in keeping with the “greater than 15%” listed risk.
Table 3:
Lung-RADS Category at Follow-up CT and Risk of Malignancy

We assessed the evolution of Lung-RADS categories from baseline to first follow-up. Of the 203 persistent nodules classified as Lung-RADS category 2, 182 nodules (92%) remained Lung-RADS 2, 18 nodules (7%) became Lung-RADS 3, one nodule (0%) became Lung-RADS 4A, and two nodules (1%) became Lung-RADS 4B. Of the 54 persistent Lung-RADS 3 nodules, seven (12%) became Lung-RADS 2, 38 (76%) remained Lung-RADS 3, five (7%) became Lung-RADS 4A, and four became (5%) Lung-RADS 4B. Of the 16 persistent Lung-RADS 4A nodules, one nodule (6%) became Lung-RADS 3, five nodules (31%) remained Lung-RADS 4A, and 10 nodules (63%) became Lung-RADS 4B. Finally, of the 25 persistent Lung-RADS 4B nodules, one nodule (4%) became Lung-RADS 2 and 24 nodules (96%) remained Lung-RADS 4B.
Malignancy Risk according to NELSON Category
The NELSON trial categorization scheme differs for baseline and subsequent rounds. The baseline round assigns categories of 2–4 on the basis of lesion volume or size. NELSON category 2 was associated with a 1.6% risk of malignancy, NELSON category 3 with a 9% risk, and NELSON category 4 with a 17% risk (Table 4). The follow-up round assigns categories of A–C according to growth rate or development of a solid component. NELSON category A was associated with a 6% risk of malignancy, NELSON category B with a 22% risk, and NELSON category C with a 16% risk of malignancy (Table 5).
Table 4:
NELSON Category at Baseline and Risk of Malignancy

Table 5:
NELSON Category at Follow-up CT and Risk of Malignancy

Comparison of Brock, Lung-RADS, and NELSON Schemes
Receiver operating characteristic curves for the diagnosis of cancer were generated for the Lung-RADS and NELSON categorizations, as well as the Brock University risk calculator, for baseline and follow-up CT (Figs E1 and E2 [online]). The areas under the receiver operating characteristic curve (AUCs), representing their discriminatory abilities, are given in Table 6. At baseline, the AUC for the Brock model was higher than that for Lung-RADS (P = .09) and NELSON (P = .02 vs Brock). The difference in AUC between Lung-RADS and NELSON yielded P = .75. At follow-up, the Brock model again had a higher AUC than Lung-RADS (P = .11) and NELSON (P = .01 vs Brock).
Table 6:
Diagnostic Performance of Lung-RADS, NELSON, and the Brock University Model in the Detection of Malignancy in a Subsolid Nodule from the NLST Cohort at Baseline and Follow-up CT

Note.—Data are areas under the receiver operating characteristic curves, with the 95% confidence interval in parentheses. Lung-RADS is based on linear nodule measurement and NELSON is based on volumetric nodule measurement. NELSON screening trial categories were obtained from Xu et al (9). Lung-RADS = Lung Imaging Reporting and Data System (8).
Discussion
In our study, we remeasured more than 400 subsolid nodules from the National Lung Screening Trial (NLST) data at baseline and follow-up imaging, including specific delineation of the solid component which was not included in NLST annotations. Using these revised measurements, we assigned Lung-RADS categories to the nodules and showed that the malignancy risks for Lung-RADS categories 2 and 3 were higher than those depicted in the Lung-RADS document (15 of 304 or weighted 3% and 13 of 67 or weighted 13% at baseline CT, compared with <1% [P = .004]) and 1%–2% [P < .001], respectively). In addition, we compared the discriminatory ability of Lung-RADS, the NELSON scheme, and the Brock University model for the diagnosis of malignancy within these subsolid nodules and found that the Brock model had the highest discriminatory ability compared with Lung-RADS and NELSON (area under the receiver operating characteristic curve = 0.78, 0.70, and 0.67, respectively, at baseline CT).
One potential cause of higher malignancy rates in Lung-RADS categories 2 and 3 compared with numbers derived from the NLST annotations is the substantial percentage (188 of 622 or 30%) of nodules labeled in the data as subsolid but that did not correspond to a subsolid nodule. This predominantly represented small solid nodules that appeared as ground glass because of volume averaging, with other instances caused by linear atelectasis or scarring nearly parallel to the axial plane. If not removed, these benign findings would contribute to a lower risk of malignancy in the overall cohort.
The higher rates of malignancy in Lung-RADS categories 2 and 3 are perhaps not surprising given emerging data describing the relatively high risk of invasive adenocarcinoma in larger pure GGNs (14,15). A recent study that evaluated subsolid nodules from the NLST found a similar malignancy rate for Lung-RADS category 2 of 2.5% (16). A recent simulation model also estimated a rate of 3% in Lung-RADS 2 subsolid nodules (17). Our results for Lung-RADS category 3 present an even more substantial discrepancy with respect to the rates published in the Lung-RADS document (13% vs 1%–2%), and this appears to be driven by a high risk of malignancy within PSNs. Of note, it is possible that some of these PSNs would have, in clinical practice, been designated as category 4× rather than 3 (eg, if spiculation were present). However, there is only moderate interobserver agreement regarding the presence of 4× characteristics among chest radiologists (18), and we sought to minimize the degree of subjective judgment involved in our analysis of Lung-RADS as an algorithmic rule system.
Within Lung-RADS category 2, we observed a higher risk of malignancy in larger GGNs (1.3% for GGN <10 mm vs 6% for GGN 10–19 mm, P = .01). Again, these results are not surprising given existing data showing the higher risk of invasive adenocarcinoma in larger pure GGN. However, they do suggest that GGNs larger than 10 mm may be better classified as Lung-RADS category 3 from a cancer risk perspective.
We did not find an advantage to using volumetric measurements in evaluating subsolid nodules for the risk of malignancy, with similar areas under the receiver operating characteristic curve for the NELSON categorization scheme and Lung-RADS (P = .56). A previous study compared linear to volumetric measurements in the NELSON cohort and showed mixed results, with the volumetric strategy having slightly higher specificity and slightly lower sensitivity than the linear approach (19). To our knowledge, this is the first direct comparison of volumetric to linear nodule classification schemes in the NLST cohort. The lack of a difference between these two schemes likely reflects their very similar treatment of subsolid nodules, for example, with pure GGNs restricted to Nelson category III or (except if >3 cm) Lung-RADS 2. However, we did find an advantage of using the Brock risk prediction calculator over these purely measurement-based schemes (with P = .02 greater performance of Brock than NELSON though P = .09 for Brock vs Lung-RADS). This highlights the utility of risk stratification using multiple imaging and clinical parameters rather than measurement alone. We note that a previous study also showed that the Brock calculator performed better than Lung-RADS for all nodule types in the NLST (11). It is likely that radiomics or convolutional neural network–based artificial intelligence can produce even greater performance.
Although our findings do suggest that many subsolid nodules (particularly GGN >10 mm and subsolid Lung-RADS 3) have a higher malignancy risk than suggested by the Lung-RADS document, the implications for nodule management remain uncertain. Indeed, as these nodules tend to be indolent when malignant, the utility of implementing a more aggressive follow-up scheme must be evaluated in future work. We acknowledge that a more aggressive follow-up scheme would result in far more CT examinations, which would lead to increased radiation dose and patient cost, without necessarily a benefit given how indolent these malignancies are. Our results suggest that using additional clinical and imaging features, such as with the Brock calculator, may stratify these nodules even better, although whether that leads to improved patient outcomes remains to be shown. We should also highlight that patient preferences are an important component of the entire lung cancer screening program, and some patients may prefer a more aggressive approach given the high risk of malignancy even if lesions are determined to be indolent.
Our study has several limitations. First, the NLST data cancers were assigned to a lobe rather than a nodule. Thus, we cannot know for certain if a malignancy identified within the lobe was the result of the most suspicious nodule seen at that time or of a new (incident) nodule. However, increasing Lung-RADS categories and larger nodules within the Lung-RADS 2 category were both associated with greater risks of malignancy, supporting the fact that these malignancies are attributable to the nodules themselves. Thus, we think this approach is preferable to that of others who eliminated nodules due to ambiguity in assigning the malignancy to a nodule. We also note that unresected subsolid nodules in NLST may still represent indolent malignancies that have simply not been detected during the follow-up period; however, it is possible that malignancies that are so indolent may not ever impact the patient’s life expectancy. Our study being derived from NLST only included current or former smokers, and therefore the applicability to Asian screening populations, which tend to include many nonsmokers, is uncertain. We also did not apply radiomic analysis to these subsolid nodules, which may have improved the malignancy risk assessment (20,21).
In conclusion, we show that the cancer risk in subsolid nodules is greater than reported for Lung-RADS categories 2 and 3. The Brock University model performed better than linear and volumetric measurements of the subsolid nodules in the National Lung Screening Trial study cohort. Future methods for individual risk assessment favor the use of models that combine both clinical and imaging characteristics for decisions regarding follow-up of subsolid nodules at found on baseline lung cancer screening chest CT examinations. Further work is needed to evaluate the cost effectiveness of such approaches.
SUPPLEMENTAL FIGURES
Funded by National Institutes of Health/National Cancer Institute (grant U01CA199284).
Disclosures of Conflicts of Interest: M.M.H. disclosed no relevant relationships. L.L.P. disclosed no relevant relationships. C.Y.K. disclosed no relevant relationships. A.R.H. disclosed no relevant relationships.
Abbreviations:
- GGN
- ground-glass nodule
- Lung-RADS
- Lung Imaging Reporting and Data System
- NLST
- National Lung Screening Trial
- PSN
- part-solid nodule
References
- 1. Yankelevitz DF, Yip R, Smith JP, et al . CT Screening for Lung Cancer: Nonsolid Nodules in Baseline and Annual Repeat Rounds . Radiology 2015. ; 277 ( 2 ): 555 – 564 . [DOI] [PMC free article] [PubMed] [Google Scholar]
- 2. Henschke CI, Yip R, Smith JP, et al . CT Screening for Lung Cancer: Part-Solid Nodules in Baseline and Annual Repeat Rounds . AJR Am J Roentgenol 2016. ; 207 ( 6 ): 1176 – 1184 . [DOI] [PubMed] [Google Scholar]
- 3. McWilliams A, Tammemagi MC, Mayo JR, et al . Probability of cancer in pulmonary nodules detected on first screening CT . N Engl J Med 2013. ; 369 ( 10 ): 910 – 919 . [DOI] [PMC free article] [PubMed] [Google Scholar]
- 4. Obayashi K, Shimizu K, Nakazawa S, et al . The impact of histology and ground-glass opacity component on volume doubling time in primary lung cancer . J Thorac Dis 2018. ; 10 ( 9 ): 5428 – 5434 . [DOI] [PMC free article] [PubMed] [Google Scholar]
- 5. Mortani Barbosa EJ., Jr. Lung cancer screening overdiagnosis: reports of overdiagnosis in screening for lung cancer are grossly exaggerated . Acad Radiol 2015. ; 22 ( 8 ): 976 – 982 . [DOI] [PubMed] [Google Scholar]
- 6. Veronesi G, Maisonneuve P, Bellomi M, et al . Estimating overdiagnosis in low-dose computed tomography screening for lung cancer: a cohort study . Ann Intern Med 2012. ; 157 ( 11 ): 776 – 784 . [DOI] [PubMed] [Google Scholar]
- 7. National Lung Screening Trial Research Team , Aberle DR, Adams AM, et al . Reduced lung-cancer mortality with low-dose computed tomographic screening . N Engl J Med 2011. ; 365 ( 5 ): 395 – 409 . [DOI] [PMC free article] [PubMed] [Google Scholar]
- 8. American College of Radiology . Lung-RADS Version 1.1. 2019. https://www.acr.org/-/media/ACR/Files/RADS/Lung-RADS/LungRADSAssessmentCategoriesv1-1.pdf?la=en. Accessed June 21, 2019 .
- 9. Xu DM, Gietema H, de Koning H, et al . Nodule management protocol of the NELSON randomised lung cancer screening trial . Lung Cancer 2006. ; 54 ( 2 ): 177 – 184 . [DOI] [PubMed] [Google Scholar]
- 10. UpToDate. Calculator: Solitary pulmonary nodule malignancy risk in adults (Brock University cancer prediction equation) . https://www.uptodate.com/contents/calculator-solitary-pulmonary-nodule-malignancy-risk-in-adults-brock-university-cancer-prediction-equation. Accessed June 22, 2019 .
- 11. White CS, Dharaiya E, Dalal S, Chen R, Haramati LB. . Vancouver Risk Calculator Compared with ACR Lung-RADS in Predicting Malignancy: Analysis of the National Lung Screening Trial . Radiology 2019. ; 291 ( 1 ): 205 – 211 . [DOI] [PubMed] [Google Scholar]
- 12. Harris PA, Taylor R, Thielke R, Payne J, Gonzalez N, Conde JG. . Research electronic data capture (REDCap)--a metadata-driven methodology and workflow process for providing translational research informatics support . J Biomed Inform 2009. ; 42 ( 2 ): 377 – 381 . [DOI] [PMC free article] [PubMed] [Google Scholar]
- 13. Hanley JA, McNeil BJ. . A method of comparing the areas under receiver operating characteristic curves derived from the same cases . Radiology 1983. ; 148 ( 3 ): 839 – 843 . [DOI] [PubMed] [Google Scholar]
- 14. Lee SM, Park CM, Goo JM, Lee HJ, Wi JY, Kang CH. . Invasive pulmonary adenocarcinomas versus preinvasive lesions appearing as ground-glass nodules: differentiation by using CT features . Radiology 2013. ; 268 ( 1 ): 265 – 273 . [DOI] [PubMed] [Google Scholar]
- 15. Lim HJ, Ahn S, Lee KS, et al . Persistent pure ground-glass opacity lung nodules ≥ 10 mm in diameter at CT scan: histopathologic comparisons and prognostic implications . Chest 2013. ; 144 ( 4 ): 1291 – 1299 . [DOI] [PubMed] [Google Scholar]
- 16. Chung K, Jacobs C, Scholten ET, et al . Malignancy estimation of Lung-RADS criteria for subsolid nodules on CT: accuracy of low and high risk spectrum when using NLST nodules . Eur Radiol 2017. ; 27 ( 11 ): 4672 – 4679 . [DOI] [PMC free article] [PubMed] [Google Scholar]
- 17. Hammer MM, Palazzo LL, Eckel AL, Barbosa EM, Jr, Kong CY. . A Decision Analysis of Follow-up and Treatment Algorithms for Nonsolid Pulmonary Nodules . Radiology 2019. ; 290 ( 2 ): 506 – 513 . [DOI] [PMC free article] [PubMed] [Google Scholar]
- 18. Chung K, Jacobs C, Scholten ET, et al . Lung-RADS Category 4X: Does It Improve Prediction of Malignancy in Subsolid Nodules? Radiology 2017. ; 284 ( 1 ): 264 – 271 . [DOI] [PubMed] [Google Scholar]
- 19. Horeweg N, van Rosmalen J, Heuvelmans MA, et al . Lung cancer probability in patients with CT-detected pulmonary nodules: a prespecified analysis of data from the NELSON trial of low-dose CT screening . Lancet Oncol 2014. ; 15 ( 12 ): 1332 – 1341 . [DOI] [PubMed] [Google Scholar]
- 20. Lee G, Lee HY, Park H, et al . Radiomics and its emerging role in lung cancer research, imaging biomarkers and clinical management: State of the art . Eur J Radiol 2017. ; 86 : 297 – 307 . [DOI] [PubMed] [Google Scholar]
- 21. Cherezov D, Hawkins SH, Goldgof DB, et al . Delta radiomic features improve prediction for lung cancer incidence: A nested case-control analysis of the National Lung Screening Trial . Cancer Med 2018. ; 7 ( 12 ): 6340 – 6356 . [DOI] [PMC free article] [PubMed] [Google Scholar]
Associated Data
This section collects any data citations, data availability statements, or supplementary materials included in this article.


