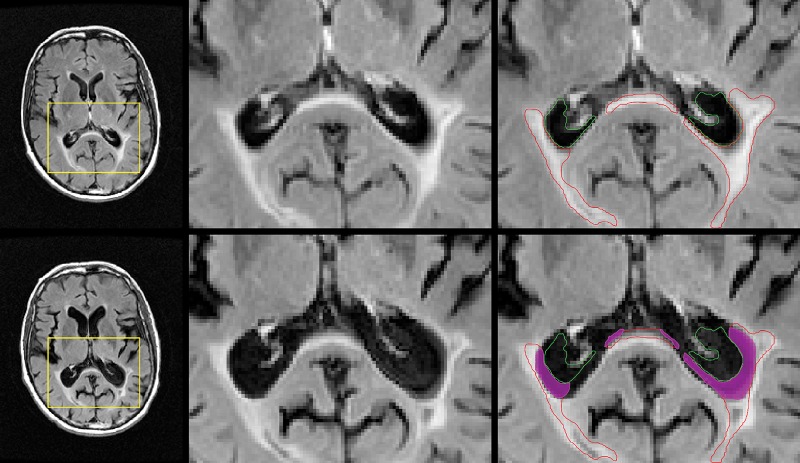
Figure 3:
Representative images of atrophied T2 lesion volume in a patient whose disease converted to secondary progressive multiple sclerosis over the course of follow-up. Top row: Baseline images. Left: Axial T2-weighted fluid-attenuated inversion recovery image. Yellow □ indicates the area of interest. Middle: Zoomed-in view of the corresponding area. Right: Outlines of the ventricle (green) and lesion volume (red). Bottom row: Corresponding follow-up images for each case, with the baseline ventricle and lesion volume outlines overlaid on top. The magenta area corresponds to cerebrospinal fluid that was lesioned tissue at baseline (atrophied T2 lesion volume).

