

Abstract
Background
Psychosis is a serious mental condition characterised by a loss of contact with reality. There may be a prodromal period or stage of psychosis, where early signs of symptoms indicating onset of first episode psychosis (FEP) occur. A number of services, incorporating multimodal treatment approaches (pharmacotherapy, psychotherapy and psychosocial interventions), developed worldwide, now focus on this prodromal period with the aim of preventing psychosis in people at risk of developing FEP.
Objectives
The primary objective is to assess the safety and efficacy of early interventions for people in the prodromal stage of psychosis.
The secondary objective is, if possible, to compare the effectiveness of the various different interventions.
Search methods
We searched Cochrane Schizophrenia's study‐based Register of studies (including trials registers) on 8 June 2016 and 4 August 2017.
Selection criteria
All randomised controlled trials (RCTs) evaluating interventions for participants older than 12 years, who had developed a prodromal stage of psychosis.
Data collection and analysis
Review authors independently inspected citations, selected studies, extracted data, and assessed study quality.
Main results
We included 20 studies with 2151 participants. The studies analysed 13 different comparisons. Group A comparisons explored the absolute effects of the experimental intervention. Group B were comparisons within which we could not be clear whether differential interactive effects were also ongoing. Group C comparisons explored differential effects between clearly distinct treatments.
A key outcome for this review was ‘transition to psychosis’. For details of other main outcomes please see 'Summary of findings' tables.
In Group A (comparisons of absolute effects) we found no clear difference between amino acids and placebo (risk ratio (RR) 0.48 95% confidence interval (CI) 0.08 to 2.98; 2 RCTs, 52 participants; very low‐quality evidence). When omega‐3 fatty acids were compared to placebo, fewer participants given the omega‐3 (10%) transitioned to psychosis compared to the placebo group (33%) during long‐term follow‐up of seven years (RR 0.24 95% CI 0.09 to 0.67; 1 RCT, 81 participants; low‐quality evidence).
In Group B (comparisons where complex interactions are probable) and in the subgroup focusing on antipsychotic drugs added to specific care packages, the amisulpiride + needs‐focused intervention (NFI) compared to NFI comparison (no reporting of transition to psychosis; 1 RCT, 102 participants; very low‐quality evidence) and the olanzapine + supportive intervention compared to supportive intervention alone comparison (RR 0.58 95% CI 0.28 to 1.18; 1 RCT, 60 participants; very low‐quality evidence) showed no clear differences between groups.
In the second Group B subgroup (cognitive behavioural therapies (CBT)), when CBT + supportive therapy was compared with supportive therapy alone around 8% of participants allocated to the combination of CBT and supportive therapy group transitioned to psychosis during follow‐up by 18 months, compared with double that percentage in the supportive therapy alone group (RR 0.45 95% CI 0.23 to 0.89; 2 RCTs, 252 participants; very low‐quality evidence). The CBT + risperidone versus CBT + placebo comparison identified no clear difference between treatments (RR 1.02 95% CI 0.39 to 2.67; 1 RCT, 87 participants; very low‐quality evidence) and this also applies to the CBT + needs‐based intervention (NBI) + risperidone versus NBI comparison (RR 0.75 95% CI 0.39 to 1.46; 1 RCT, 59 participants; very low‐quality evidence).
Group C (differential effects) also involved six comparisons. The first compared CBT with supportive therapy. No clear difference was found for the ‘transition to psychosis’ outcome (RR 0.74 95% CI 0.28 to 1.98; 1 RCT, 72 participants; very low‐quality evidence). The second subgroup compared CBT + supportive intervention was compared with a NBI + supportive intervention, again, data were equivocal, few and of very low quality (RR 6.32 95% CI 0.34 to 117.09; 1 RCT, 57 participants). In the CBT + risperidone versus supportive therapy comparison, again there was no clear difference between groups (RR 0.76 95% CI 0.28 to 2.03; 1 RCT, 71 participants; very low‐quality evidence).
The three other comparisons in Group C demonstrated no clear differences between treatment groups. When cognitive training was compared to active control (tablet games) (no reporting of transition to psychosis; 1 RCT, 62 participants; very low quality data), family treatment compared with enhanced care comparison (RR 0.54 95% CI 0.18 to 1.59; 2 RCTs, 229 participants; very low‐quality evidence) and integrated treatment compared to standard treatment comparison (RR 0.57 95% CI 0.28 to 1.15; 1 RCT, 79 participants; very low‐quality evidence) no effects of any of these approaches was evident.
Authors' conclusions
There has been considerable research effort in this area and several interventions have been trialled. The evidence available suggests that omega‐3 fatty acids may prevent transition to psychosis but this evidence is low quality and more research is needed to confirm this finding. Other comparisons did not show any clear differences in effect for preventing transition to psychosis but again, the quality of this evidence is very low or low and not strong enough to make firm conclusions.
Plain language summary
Early interventions for people at risk of developing psychosis
Review question
Is there high‐quality evidence indicating that interventions for people at risk of developing psychosis are effective?
Background
Psychoses are serious mental conditions characterised by a loss of contact with reality. The first clear episode of psychosis can be preceded by a 'prodromal' period of at least six months, where a person experiences gradual non‐specific changes in thoughts, perceptions, behaviours and functioning. Although an individual is experiencing changes, they have not yet started to experience the more obvious psychotic symptoms such as delusions (fixed false beliefs) or hallucinations (perceptions without a cause). A number of services with treatment approaches that combine pharmacotherapy, psychotherapy and psychosocial treatments, developed worldwide, are now focusing on prevention of psychosis in people at risk by giving treatments during this prodromal period. This review assesses the evidence available concerning the effects of different treatment approaches for people not yet diagnosed with a non affective psychosis but who are in the prodromal stage of psychosis.
Searching for evidence
On 8 June 2016 and 4 August 2017 we ran electronic searches of the Cochrane Schizophrenia's specialised register of studies in order to find clinical studies that randomly allocated individuals at risk of developing psychosis to receive various treatments for preventing development of psychosis.
Evidence found
We were able to include 20 studies with 2151 participants. These studies analysed a wide range of treatments. All the review findings are of, at very best, low quality. There is some suggestion from one small study that people at risk of psychosis may benefit from taking omega‐3 fatty acids in terms of reduced transition to psychosis. Other studies found adding antipsychotic drugs to supportive‐care packages did not seem to make much difference in terms of transition to full illness. When cognitive behavioural therapy (CBT) + supportive therapy was compared with supportive therapy alone around 8% of participants treated allocated to the combination of CBT and supportive therapy transitioned to psychosis during follow‐up by 18 months, compared with double that percentage in people who just received supportive therapy. This could be important but these data are of very low quality. All other testing of CBT and other packages of care found no clear difference between treatments for transition to psychosis.
Conclusions
There has been considerable effort and expense invested testing treatment approaches for prevention of the first episode of schizophrenia. Currently, there is some low‐quality evidence suggesting that omega‐3 fatty acids may be effective, but there is no high‐quality evidence to suggest that any type of treatment is effective, and no firm conclusions can be made.
Summary of findings
Summary of findings for the main comparison. Group A: amino acids compared to placebo for prodromal stage of psychosis.
| Amino acids compared to placebo for prodromal stage of psychosis | ||||||
| Patient or population: people in the prodromal stage of psychosis Setting: outpatient Intervention: amino acids Comparison: placebo | ||||||
| Outcomes | Anticipated absolute effects* (95% CI) | Relative effect (95% CI) | № of participants (studies) | Quality of the evidence (GRADE) | Comments | |
| Risk with placebo | Risk with amino acids | |||||
|
Prodromal symptoms: transition to psychosis Endpoint data (events) |
Study population | RR 0.48 (0.08 to 2.98) | 52 (2 RCTs) | ⊕⊝⊝⊝ Very low1,2 | ||
| 107 per 1000 | 51 per 1000 (9 to 319) | |||||
| Global state: clinically important change in global state | See comment | See comment | Not estimable | 0 (0) | See comment | No study reported this outcome |
|
Mental state: psychosis risk symptoms Average total score (SOPS total score; higher score = worse, scale from: 0‐114) Short‐term Follow‐up: 8 weeks |
The mean mental state: psychosis risk symptoms was 42.0 points | MD 10 points lower (22.38 lower to 2.38 higher) | ‐ | 8 (1 RCT) | ⊕⊝⊝⊝ Very low3,4 | Data for our predefined outcome of interest 'Clinically important change in mental state' were not reported by the studies. |
| Behaviour: clinically important change in behaviour | See comment | See comment | Not estimable | 0 (0) | See comment | No study reported this outcome |
|
Adverse effects: suicidal thoughts Short‐term (events) Follow‐up: by 16 weeks |
Study population | RR 3.57 (0.15 to 83.14) | 44 (1 RCT) | ⊕⊝⊝⊝ Very low4,5 | ||
| 0 per 1000 | 0 per 1000 (0 to 0) | |||||
| Quality of life: clinically important change in quality of life | See comment | See comment | Not estimable | 0 (0) | See comment | No study reported this outcome |
|
Satisfaction with treatment: leaving the study early Endpoint data (events) |
Study population | RR 0.96 (0.55 to 1.69) | 52 (2 RCTs) | ⊕⊝⊝⊝ Very low1,2 | ||
| 464 per 1000 | 446 per 1000 (255 to 785) | |||||
| *The risk in the intervention group (and its 95% confidence interval) is based on the assumed risk in the comparison group and the relative effect of the intervention (and its 95% CI). CI: confidence interval; MD: mean difference; RCT: randomised controlled trial; RR: risk ratio; SOPS: Scale of Psychotic Symptoms | ||||||
| GRADE Working Group grades of evidence High quality: further research is very unlikely to change our confidence in the estimate of effect. Moderate quality: further research is likely to have an important impact on our confidence in the estimate of effect and may change the estimate. Low quality: further research is very likely to have an important impact on our confidence in the estimate of effect and is likely to change the estimate. Very low quality: we are very uncertain about the estimate. | ||||||
1Risk of bias: rated 'very serious'; randomisation method not described, allocation concealment method not described, high attrition, blinding of outcome assessors not described, unclear risk of selective reporting bias. 2Imprecision: rated 'very serious'; evidence from two small studies. 3Risk of bias: rated 'very serious'; 1 randomisation method not described, allocation concealment method not described, blinding of outcome assessors not described, unclear risk of selective reporting bias. 4Imprecision: rated 'very serious'; evidence from one small study. 5Risk of bias: rated 'very serious'; randomisation method not described, allocation concealment method not described, high attrition.
Summary of findings 2. Group A: omega‐3 fatty acids compared to placebo for prodromal stage of psychosis.
| Omega‐3 fatty acids compared to placebo for prodromal stage of psychosis | ||||||
| Patient or population: people in the prodromal stage of psychosis Setting: outpatient Intervention: omega‐3 fatty acids Comparison: placebo | ||||||
| Outcomes | Anticipated absolute effects* (95% CI) | Relative effect (95% CI) | № of participants (studies) | Quality of the evidence (GRADE) | Comments | |
| Risk with placebo | Risk with omega‐3 fatty acids | |||||
|
Prodromal symptoms: transition to psychosis Long‐term (events) Follow‐up: 7 years |
Study population | RR 0.24 (0.09 to 0.67) | 81 (1 RCT) | ⊕⊕⊝⊝ Low1 | ||
| 400 per 1000 | 96 per 1000 (36 to 268) | |||||
|
Global state: antipsychotic prescription Long‐term (events) Follow‐up: 7 years |
Study population | RR 0.54 (0.30 to 0.99) | 69 (1 RCT) | ⊕⊕⊝⊝ Low1 | ||
| 543 per 1000 | 293 per 1000 (163 to 537) | |||||
|
Mental state: psychotic symptoms Average total score (PANSS, higher score = worse, scale from 30‐210) Long‐term (up to 7 years) |
The mean mental state: psychotic symptoms was 57.4 points | MD 11.40 points lower (20.55 lower to 2.25 lower) | ‐ | 81 (1 RCT) | ⊕⊕⊝⊝ Low1 | Data for our predefined outcome of interest 'Clinically important change in mental state' were not reported by the studies. |
| Behaviour: clinically important change in behaviour | See comment | See comment | Not estimable | 0 (0) | See comment | No study reported this outcome |
|
Adverse effects: neurological, extrapyramidal UKU (events) Medium‐term Follow‐up: by 12 months |
Study population | RR 2.57 (0.94 to 7.02) | 304 (1 RCT) | ⊕⊕⊝⊝ Low1 | ||
| 33 per 1000 | 85 per 1000 (31 to 232) | |||||
| Quality of life: clinically important change in quality of life | See comment | See comment | Not estimable | 0 (0) | See comment | No study reported this outcome |
|
Satisfaction with treatment: leaving the study early Long‐term (events) Follow‐up: 7 years |
Study population | RR 1.46 (0.45 to 4.80) | 81 (1 RCT) | ⊕⊕⊝⊝ Low1 | ||
| 100 per 1000 | 146 per 1000 (45 to 480) | |||||
| *The risk in the intervention group (and its 95% confidence interval) is based on the assumed risk in the comparison group and the relative effect of the intervention (and its 95% CI). CI: confidence interval; MD: mean difference; PANSS: Positive and Negative Syndrome Scale; RCT: randomised controlled trial; RR: risk ratio; UKU: Udvalg for Kliniske Undersøgelser Adverse Effects Scale | ||||||
| GRADE Working Group grades of evidence High quality: further research is very unlikely to change our confidence in the estimate of effect. Moderate quality: further research is likely to have an important impact on our confidence in the estimate of effect and may change the estimate. Low quality: further research is very likely to have an important impact on our confidence in the estimate of effect and is likely to change the estimate. Very low quality: we are very uncertain about the estimate. | ||||||
1Imprecision: rated 'very serious'; evidence from one small study.
Summary of findings 3. Group B antipsychotic drugs: amisulpiride + needs‐focused intervention compared to needs‐focused intervention for prodromal stage of psychosis.
| Amisulpiride + needs‐focused intervention compared to needs‐focused intervention for prodromal stage of psychosis | ||||||
| Patient or population: people in the prodromal stage of psychosis Setting: outpatient Intervention: amisulpiride + needs‐focused intervention (NFI) Comparison: needs‐focused intervention (NFI) | ||||||
| Outcomes | Anticipated absolute effects* (95% CI) | Relative effect (95% CI) | № of participants (studies) | Quality of the evidence (GRADE) | Comments | |
| Risk with NFI | Risk with amisulpiride + NFI | |||||
| Prodromal symptoms: transition to psychosis | See comment | See comment | Not estimable | 0 (0) | See comment | No study reported this outcome |
| Global state: clinically important change in global state | See comment | See comment | Not estimable | 0 (0) | See comment | No study reported this outcome |
| Mental state: clinically important change in mental state | See comment | See comment | Not estimable | 0 (0) | See comment | No study reported this outcome |
| Behaviour: clinically important change in behaviour | See comment | See comment | Not estimable | 0 (0) | See comment | No study reported this outcome |
|
Adverse effects: suicidal thoughts (events) |
Study population | RR 0.25 (0.01 to 6.10) | 102 (1 RCT) | ⊕⊝⊝⊝ Very low1,2 | ||
| 23 per 1000 | 6 per 1000 (0 to 127) | |||||
| Quality of life: clinically important change in quality of life | See comment | See comment | Not estimable | 0 (0) | See comment | No study reported this outcome |
|
Satisfaction with treatment: leaving the study early Endpoint data (events) |
Study population | RR 0.59 (0.38 to 0.94) | 124 (1 RCT) | ⊕⊝⊝⊝ Very low1,2 | ||
| 492 per 1000 | 290 per 1000 (187 to 462) | |||||
| *The risk in the intervention group (and its 95% confidence interval) is based on the assumed risk in the comparison group and the relative effect of the intervention (and its 95% CI). CI: confidence interval; MD: mean difference; NFI: needs‐focused intervention; RCT: randomised controlled trial; RR: risk ratio | ||||||
| GRADE Working Group grades of evidence High quality: further research is very unlikely to change our confidence in the estimate of effect. Moderate quality: further research is likely to have an important impact on our confidence in the estimate of effect and may change the estimate. Low quality: further research is very likely to have an important impact on our confidence in the estimate of effect and is likely to change the estimate. Very low quality: we are very uncertain about the estimate. | ||||||
1Risk of bias: rated 'very serious'; randomisation method not described, allocation concealment method not described, participants not blinded, outcome assessors not blinded, high attrition, unclear risk of selective reporting bias. 2Imprecision: rated 'very serious'; evidence from one small study.
Summary of findings 4. Group B antipsychotic drugs: olanzapine + supportive intervention compared to placebo + supportive intervention for prodromal stage of psychosis.
| Olanzapine + supportive intervention compared to placebo + supportive intervention for prodromal stage of psychosis | ||||||
| Patient or population: people in the prodromal stage of psychosis Setting: outpatient Intervention: olanzapine + supportive intervention Comparison: placebo + supportive intervention | ||||||
| Outcomes | Anticipated absolute effects* (95% CI) | Relative effect (95% CI) | № of participants (studies) | Quality of the evidence (GRADE) | Comments | |
| Risk with placebo + supportive intervention | Risk with olanzapine + supportive intervention | |||||
|
Prodromal symptoms: transition to psychosis Endpoint data, (events) Medium‐term Follow‐up: by 12 months |
Study population | RR 0.58 (0.28 to 1.18) | 60 (1 RCT) | ⊕⊝⊝⊝ Very low1,2 | ||
| 448 per 1000 | 260 per 1000 (126 to 529) | |||||
|
Global state: global illness severity Average total score, CGI (higher score = worse, scale from: 2‐14) Medium‐term Follow‐up: 12 months |
The mean global state: global illness severity was 3.86 points | MD 0.23 points lower (0.82 lower to 0.36 higher) | ‐ | 59 (1 RCT) | ⊕⊝⊝⊝ Very low1,2 | |
|
Mental state: psychosis risk symptoms SOPS total (higher score = worse, scale from: 0‐114) Follow‐up: 12 months |
The mean mental state: psychosis risk symptoms was 36.56 points | The mean mental state: psychosis risk symptoms was 33.8 See comment |
‐ | 59 (1 RCT) | ⊕⊝⊝⊝ Very low1,2 | Data for this outcome were skewed, and therefore we did not present summary estimates |
| Behaviour: clinically important change in behaviour | See comment | See comment | Not estimable | 0 (0) | See comment | No study reported this outcome |
|
Adverse effects: average weight gain change kg gained (higher scores = worse) Medium‐term Follow‐up: 12 months |
The mean adverse effects: average weight gain change was 0.32 kg | MD 8.49 kg higher (4.90 higher to 12.08 higher) | ‐ | 59 (1 RCT) | ⊕⊝⊝⊝ Very low1,2 | |
| Quality of life: clinically important change in quality of life | See comment | See comment | Not estimable | 0 (0) | See comment | No study reported this outcome |
|
Satisfaction with treatment: leaving the study early Endpoint data (events) Medium‐term Follow‐up: by 12 months |
Study population | RR 1.59 (0.88 to 2.88) | 60 (1 RCT) | ⊕⊝⊝⊝ Very low1,2 | ||
| 345 per 1000 | 548 per 1000 (303 to 993) | |||||
| *The risk in the intervention group (and its 95% confidence interval) is based on the assumed risk in the comparison group and the relative effect of the intervention (and its 95% CI). CGI: Clinical Global Impression‐Severity of Illness Scale; CI: Confidence interval; MD: mean difference; RCT: randomised controlled trial; RR: Risk ratio; SOPS: Scale of Prodromal Symptoms | ||||||
| GRADE Working Group grades of evidence High quality: further research is very unlikely to change our confidence in the estimate of effect. Moderate quality: further research is likely to have an important impact on our confidence in the estimate of effect and may change the estimate. Low quality: further research is very likely to have an important impact on our confidence in the estimate of effect and is likely to change the estimate. Very low quality: we are very uncertain about the estimate. | ||||||
1Risk of bias: rated 'very serious'; randomisation method not described, allocation concealment method not described, high attrition, unclear risk of selective reporting bias. 2Imprecision: rated 'very serious'; evidence from one small study.
Summary of findings 5. Group B cognitive behavioural therapy: cognitive behavioural therapy + supportive therapy compared to supportive therapy for prodromal stage of psychosis.
| Cognitive behavioural therapy + supportive therapy compared to supportive therapy for prodromal stage of psychosis | ||||||
| Patient or population: people in the prodromal stage of psychosis Setting: outpatient Intervention: cognitive behavioural therapy (CBT) + supportive therapy Comparison: supportive therapy | ||||||
| Outcomes | Anticipated absolute effects* (95% CI) | Relative effect (95% CI) | № of participants (studies) | Quality of the evidence (GRADE) | Comments | |
| Risk with supportive therapy | Risk with CBT + supportive therapy | |||||
|
Prodromal symptoms: transition to psychosis Long‐term (events) Follow‐up: by 18 months |
Study population | RR 0.45 (0.23 to 0.89) | 252 (2 RCTs) | ⊕⊝⊝⊝ Very low1,2 | ||
| 195 per 1000 | 88 per 1000 (45 to 174) | |||||
| Global state: clinically important change in global state | See comment | See comment | Not estimable | 0 (0) | See comment | No study reported this outcome |
|
Mental state PANSS total (higher score = worse, scale from: 30‐210) Follow‐up: 12 months |
The mean mental state was 39.1 points | The mean mental state was 39.4 points See comment |
‐ | 68 (1 RCT) | ⊕⊝⊝⊝ Very low3,4 | Data for this outcome were skewed, and therefore we did not present summary estimates |
| Behaviour: clinically important change in behaviour | See comment | See comment | Not estimable | 0 (0) | See comment | No study reported this outcome |
| Adverse effects: at least one serious adverse event | See comment | See comment | Not estimable | 0 (0) | See comment | No study reported this outcome |
|
Quality of life Average total score, MANSA (higher score = better, scale from: 16‐112) Long‐term Follow‐up: 18 months |
The mean quality of life was 55.5 points | MD 1.50 points higher (2.93 lower to 5.93 higher) | ‐ | 140 (1 RCT) | ⊕⊝⊝⊝ Very low4,5 | Data for clinically important change in quality of life not available. |
|
Satisfaction with treatment: leaving the study early Endpoint data (events) Additional follow‐up: by between > 2 years to 4 years |
Study population | RR 0.96 (0.74 to 1.24) | 261 (2 RCTs) | ⊕⊝⊝⊝ Very low2,6 | ||
| 468 per 1000 | 450 per 1000 (347 to 581) | |||||
| *The risk in the intervention group (and its 95% confidence interval) is based on the assumed risk in the comparison group and the relative effect of the intervention (and its 95% CI). CBT: cognitive behavioural therapy; CI: confidence interval; MANSA: Montgomery–Asberg Depression Rating Scale; MD: mean difference; PANSS: Positive and Negative Syndrome Scale; RCT: randomised controlled trial; RR: risk ratio; SOPS: Scale of Prodromal Symptoms | ||||||
| GRADE Working Group grades of evidence High quality: further research is very unlikely to change our confidence in the estimate of effect. Moderate quality: further research is likely to have an important impact on our confidence in the estimate of effect and may change the estimate. Low quality: further research is very likely to have an important impact on our confidence in the estimate of effect and is likely to change the estimate. Very low quality: we are very uncertain about the estimate. | ||||||
1Risk of bias: rated 'very serious'; allocation concealment not described, participants not blinded, high attrition, unclear risk of selective reporting bias. 2Imprecision: rated 'very serious'; evidence from two small studies. 3Risk of bias: rated 'very serious'; allocation concealment not described, participants not blinded, outcome assessors not blinded, high attrition. 4Imprecision: rated 'very serious'; evidence from one small study. 5Risk of bias: rated 'very serious; allocation concealment not described, participants not blinded, unclear risk of selective reporting bias. 6Risk of bias: rated 'very serious'; randomisation method not described, allocation concealment method not described, participants not blinded, outcome assessors not blinded, high attrition.
Summary of findings 6. Group B cognitive behavioural therapy: cognitive behavioural therapy + risperidone compared to cognitive behavioural therapy + placebo for prodromal stage of psychosis.
| Cognitive behavioural therapy + risperidone compared to cognitive behavioural therapy + placebo for prodromal stage of psychosis | ||||||
| Patient or population: people in the prodromal stage of psychosis Setting: outpatient Intervention: cognitive behavioural therapy (CBT) + risperidone Comparison: cognitive behavioural therapy (CBT) + placebo | ||||||
| Outcomes | Anticipated absolute effects* (95% CI) | Relative effect (95% CI) | № of participants (studies) | Quality of the evidence (GRADE) | Comments | |
| Risk with CBT + placebo | Risk with CBT + risperidone | |||||
|
Prodromal symptoms: transition to psychosis Endpoint data (events) |
Study population | RR 1.02 (0.39 to 2.67) | 87 (1 RCT) | ⊕⊝⊝⊝ Very low1,2 | ||
| 159 per 1000 | 162 per 1000 (62 to 425) | |||||
| Global state: clinically important change in global state | See comment | See comment | Not estimable | 0 (0) | See comment | No study reported this outcome |
|
Mental state: psychopathology Total endpoint data, BPRS (higher score = worse, scale from 0‐126) Follow‐up: 12 months |
The mean mental state: psychopathology was 16.5 points | The mean mental state: psychopathology was 14 points See comment |
‐ | 51 (1 RCT) | ⊕⊝⊝⊝ Very low1,2 | Data for this outcome were skewed, and therefore we did not present summary estimates |
| Behaviour: clinically important change in behaviour | See comment | See comment | Not estimable | 0 (0) | See comment | No study reported this outcome |
|
Adverse effects: specific ‐ doctors' assessment of adverse effects UKU (events) Medium‐term Follow‐up: 12 months |
Study population | RR 1.03 (0.55 to 1.91) | 65 (1 RCT) | ⊕⊝⊝⊝ Very low1,2 | ||
| 379 per 1000 | 391 per 1000 (209 to 724) | |||||
|
Quality of life Average endpoint score, QLS (higher score = better, scale from: 0‐126) Medium‐term Follow‐up: 12 months |
The mean quality of life was 0 | MD 5.70 higher (7.86 lower to 19.26 higher) | ‐ | 51 (1 RCT) | ⊕⊝⊝⊝ Very low1,2 | Data for clinically important change in quality of life were not available |
|
Satisfaction with treatment: leaving the study early Endpoint data (events) |
Study population | RR 1.09 (0.62 to 1.92) | 87 (1 RCT) | ⊕⊝⊝⊝ Very low1,2 | ||
| 341 per 1000 | 372 per 1000 (211 to 655) | |||||
| *The risk in the intervention group (and its 95% confidence interval) is based on the assumed risk in the comparison group and the relative effect of the intervention (and its 95% CI). BPRS: Brief Psychiatric Rating Scale; CBT: cognitive behavioural therapy; CI: confidence interval; MD: mean difference; QLS: Quality of Life Scale; RCT: randomised controlled trial; RR: risk ratio; UKU: Udvalg for Kliniske Undersøgelser Adverse Effects Scale | ||||||
| GRADE Working Group grades of evidence High quality: further research is very unlikely to change our confidence in the estimate of effect. Moderate quality: further research is likely to have an important impact on our confidence in the estimate of effect and may change the estimate. Low quality: further research is very likely to have an important impact on our confidence in the estimate of effect and is likely to change the estimate. Very low quality: we are very uncertain about the estimate. | ||||||
1Risk of bias: rated 'very serious'; randomisation method not described, allocation concealment method not described, high attrition. 2Imprecision: rated 'very serious'; evidence from one small study.
Summary of findings 7. Group B cognitive behavioural therapy: cognitive behavioural therapy (specific preventive intervention) + needs‐based intervention + risperidone compared to needs‐based intervention for prodromal stage of psychosis.
| Cognitive behavioural therapy (specific preventive intervention) + needs‐based intervention + risperidone compared to needs‐based intervention for prodromal stage of psychosis | ||||||
| Patient or population: people in the prodromal stage of psychosis Setting: outpatient Intervention: cognitive behavioural therapy (specific preventive intervention) (CBT(SPI)) + needs‐based intervention (NBI) + risperidone Comparison: needs‐based intervention (NBI) | ||||||
| Outcomes | Anticipated absolute effects* (95% CI) | Relative effect (95% CI) | № of participants (studies) | Quality of the evidence (GRADE) | Comments | |
| Risk with NBI | Risk with CBT(SPI) + NBI + risperidone | |||||
|
Prodromal symptoms: transition to psychosis Endpoint data (events) Long‐term Follow‐up: up to 4 years |
Study population | RR 0.75 (0.39 to 1.46) | 59 (1 RCT) | ⊕⊝⊝⊝ Very low1,2 | ||
| 429 per 1000 | 321 per 1000 (167 to 626) | |||||
| Global state: clinically important change in global state | See comment | See comment | Not estimable | 0 (0) | See comment | No study reported this outcome |
|
Mental state: psychopathology Total endpoint data, BPRS (higher score = worse, scale from: 0‐126) Follow‐up: 4 years |
The mean mental state: psychopathology was 22.47 | The mean mental state: psychopathology was 26.33 See comment |
‐ | 40 (1 RCT) | ⊕⊝⊝⊝ Very low1,2 | Data for this outcome were skewed, and therefore we did not present summary estimates |
| Behaviour: clinically important change in behaviour | See comment | See comment | Not estimable | 0 (0) | See comment | No study reported this outcome |
| Adverse effects: at least one serious adverse event | See comment | See comment | Not estimable | 0 (0) | See comment | No study reported this outcome |
|
Quality of life Average endpoint score, QLS (higher score = better, scale from: 0‐126) Long‐term Follow‐up: up to 4 years |
The mean quality of life was 80.53 points | MD 2.03 points lower (16.90 lower to 12.84 higher) | ‐ | 40 (1 RCT) | ⊕⊝⊝⊝ Very low1,2 | Data for clinically important change in quality of life were not available |
|
Satisfaction with treatment: leaving the study early (events) Long‐term Follow‐up: up to 4 years |
Study population | RR 0.57 (0.26 to 1.28) | 59 (1 RCT) | ⊕⊝⊝⊝ Very low1,2 | ||
| 393 per 1000 | 224 per 1000 (102 to 503) | |||||
| *The risk in the intervention group (and its 95% confidence interval) is based on the assumed risk in the comparison group and the relative effect of the intervention (and its 95% CI). BPRS: Brief Psychiatric Rating Scale; CBT(SPI): cognitive behavioural therapy (specific preventive intervention); CI: confidence interval; MD: mean difference; QLS: Quality of Life Scale; RCT: randomised controlled trial; RR: risk ratio | ||||||
| GRADE Working Group grades of evidence High quality: further research is very unlikely to change our confidence in the estimate of effect. Moderate quality: further research is likely to have an important impact on our confidence in the estimate of effect and may change the estimate. Low quality: further research is very likely to have an important impact on our confidence in the estimate of effect and is likely to change the estimate. Very low quality: we are very uncertain about the estimate. | ||||||
1Risk of bias: rated 'very serious'; randomisation method not described, allocation concealment not described, participants not blinded, outcome assessors not blinded. 2Imprecision: rated 'very serious'; evidence from one small study.
Summary of findings 8. Group C cognitive behavioural therapy: cognitive behavioural therapy + placebo compared to supportive therapy + placebo for prodromal stage of psychosis.
| Cognitive behavioural therapy + placebo compared to supportive therapy + placebo for prodromal stage of psychosis | ||||||
| Patient or population: people in the prodromal stage of psychosis Setting: outpatient Intervention: cognitive behavioural therapy (CBT) + placebo Comparison: supportive therapy + placebo | ||||||
| Outcomes | Anticipated absolute effects* (95% CI) | Relative effect (95% CI) | № of participants (studies) | Quality of the evidence (GRADE) | Comments | |
| Risk with supportive therapy + placebo | Risk with CBT + placebo | |||||
|
Prodromal symptoms: transition to psychosis Endpoint data (events) |
Study population | RR 0.74 (0.28 to 1.98) | 72 (1 RCT) | ⊕⊝⊝⊝ Very low1,2 | ||
| 214 per 1000 | 159 per 1000 (60 to 424) | |||||
| Global state: clinically important change in global state | See comment | See comment | Not estimable | 0 (0) | See comment | No study reported this outcome |
|
Mental state: psychopathology Total endpoint data, BPRS (higher score = worse, scale from 0‐126) Follow‐up: 12 months |
The mean mental state: psychopathology: was 15.3 points | The mean mental state: psychopathology: was 16.5 points See comment |
‐ | 45 (1 RCT) | ⊕⊝⊝⊝ Very low1,2 | Data for this outcome were skewed, and therefore we did not present summary estimates |
| Behaviour: clinically important change in behaviour | See comment | See comment | Not estimable | 0 (0) | See comment | No study reported data we could use for this outcome |
|
Adverse effects: specific ‐ doctors' assessment of adverse effects UKU (events) Medium‐term Follow‐up: 12 months |
Study population | RR 1.39 (0.61 to 3.18) | 51 (1 RCT) | ⊕⊝⊝⊝ Very low1,2 | ||
| 273 per 1000 | 379 per 1000 (166 to 867) | |||||
|
Quality of life Average endpoint scores, QLS (higher score = better, scale from 0‐126) Medium‐term Follow‐up: 12 months |
The mean quality of life was 84.4 points | MD 3.30 points lower (18.76 lower to 12.16 higher) | ‐ | 44 (1 RCT) | ⊕⊝⊝⊝ Very low1,2 | Data for clinically important change in quality of life were not available. |
|
Satisfaction with treatment: leaving the study early Endpoint data (events) |
Study population | RR 1.06 (0.54 to 2.09) | 72 (1 RCT) | ⊕⊝⊝⊝ Very low1,2 | ||
| 321 per 1000 | 341 per 1000 (174 to 672) | |||||
| *The risk in the intervention group (and its 95% confidence interval) is based on the assumed risk in the comparison group and the relative effect of the intervention (and its 95% CI). BPRS: Brief Psychiatric Rating Scale; CBT: cognitive behavioural therapy; CI: confidence interval; MD: mean difference; QLS: Quality of Life Scale; RCT: randomised controlled trial; RR: risk ratio; UKU: Udvalg for Kliniske Undersøgelser Adverse Effects Scale | ||||||
| GRADE Working Group grades of evidence High quality: further research is very unlikely to change our confidence in the estimate of effect. Moderate quality: further research is likely to have an important impact on our confidence in the estimate of effect and may change the estimate. Low quality: further research is very likely to have an important impact on our confidence in the estimate of effect and is likely to change the estimate. Very low quality: we are very uncertain about the estimate. | ||||||
1Risk of bias: rated 'serious'; randomisation process unclear, method of allocation concealment unclear, large attrition of participants. 2Imprecision: rated ' very serious'; evidence from one small study.
Summary of findings 9. Group C cognitive behavioural therapy: cognitive behavioural therapy + supportive intervention compared to non‐directive reflective listening + supportive intervention for prodromal stage of psychosis.
| Cognitive behavioural therapy + supportive intervention compared to non‐directive reflective listening + supportive intervention for prodromal stage of psychosis | ||||||
| Patient or population: people in the prodromal stage of psychosis Setting: outpatient Intervention: cognitive behavioural therapy (CBT) + supportive intervention Comparison: non‐directive reflective listening (NDRL) + supportive intervention | ||||||
| Outcomes | Anticipated absolute effects* (95% CI) | Relative effect (95% CI) | № of participants (studies) | Certainty of the evidence (GRADE) | Comments | |
| Risk with NDRL + supportive intervention | Risk with CBT + supportive intervention | |||||
|
Prodromal symptoms: transition to psychosis Endpoint data (events) |
Study population | RR 6.32 (0.34 to 117.09) | 57 (1 RCT) | ⊕⊝⊝⊝ Very low1,2 | ||
| 0 per 1000 | 0 per 1000 (0 to 0) | |||||
| Global state: clinically important change in global state | See comment | See comment | Not estimable | 0 (0) | See comment | No study reported this outcome |
| Mental state: clinically important change in mental state | See comment | See comment | Not estimable | 0 (0) | See comment | No study reported this outcome |
| Behaviour: clinically important change in behaviour | See comment | See comment | Not estimable | 0 (0) | See comment | No study reported this outcome |
| Adverse effects: at least one serious adverse event | See comment | See comment | Not estimable | 0 (0) | See comment | No study reported this outcome |
| Quality of life: clinically important change in quality of life | See comment | See comment | Not estimable | 0 (0) | See comment | No study reported this outcome |
|
Satisfaction with treatment: leaving the study early Endpoint data (events) |
Study population | RR 1.35 (0.81 to 2.25) | 57 (1 RCT) | ⊕⊝⊝⊝ Very low1,2 | ||
| 444 per 1000 | 600 per 1000 (360 to 1000) | |||||
| *The risk in the intervention group (and its 95% confidence interval) is based on the assumed risk in the comparison group and the relative effect of the intervention (and its 95% CI). CBT: cognitive behavioural therapy; CI: confidence interval; NDRL: non‐directive reflective listening; RCT: randomised controlled trial; RR: risk ratio | ||||||
| GRADE Working Group grades of evidence High quality: further research is very unlikely to change our confidence in the estimate of effect. Moderate quality: further research is likely to have an important impact on our confidence in the estimate of effect and may change the estimate. Low quality: further research is very likely to have an important impact on our confidence in the estimate of effect and is likely to change the estimate. Very low quality: we are very uncertain about the estimate. | ||||||
1Risk of bias: rated 'very serious'; allocation concealment method unclear; participants not blinded; high attrition. 2Imprecision: rated 'very serious'; evidence from one small study.
Summary of findings 10. Group C cognitive behavioural therapy: cognitive behavioural therapy + risperidone compared to supportive therapy + placebo for prodromal stage of psychosis.
| Cognitive behavioural therapy + risperidone compared to supportive therapy + placebo for prodromal stage of psychosis | ||||||
| Patient or population: people in the prodromal stage of psychosis Setting: outpatient Intervention: cognitive behavioural therapy (CBT) + risperidone Comparison: supportive therapy + placebo | ||||||
| Outcomes | Anticipated absolute effects* (95% CI) | Relative effect (95% CI) | № of participants (studies) | Quality of the evidence (GRADE) | Comments | |
| Risk with supportive therapy + placebo | Risk with CBT + risperidone | |||||
|
Prodromal symptoms: transition to psychosis Endpoint data (events) |
Study population | RR 0.76 (0.28 to 2.03) | 71 (1 RCT) | ⊕⊝⊝⊝ Very low1,2 | ||
| 214 per 1000 | 163 per 1000 (60 to 435) | |||||
| Global state: clinically important change in global state | See comment | See comment | Not estimable | 0 (0) | See comment | No study reported this outcome |
|
Mental state: psychopathology Total endpoint data, BPRS (higher score = worse, scale from: 0‐126) Follow‐up: 12 months |
The mean mental state: psychopathology was 15.3 points | The mean mental state: psychopathology was 14 points See comment |
‐ | 42 (1 RCT) | ⊕⊝⊝⊝ Very low1,2 | Data for this outcome were skewed, and therefore we did not present summary estimates |
| Behaviour: clinically important change in behaviour | See comment | See comment | Not estimable | 0 (0) | See comment | No study reported this outcome |
|
Adverse effects: doctors' assessment of adverse effects UKU (events) Medium‐term Follow‐up: 12 months |
Study population | RR 1.43 (0.64 to 3.16) | 58 (1 RCT) | ⊕⊝⊝⊝ Very low1,2 | ||
| 273 per 1000 | 390 per 1000 (175 to 862) | |||||
|
Quality of life Average endpoint scores, QLS (higher score = better, scale from: 0‐126) Medium‐term Follow‐up: 12 months |
The mean quality of life was 84.4 points | MD 2.40 points higher (9.91 lower to 14.71 higher) | ‐ | 43 (1 RCT) | ⊕⊝⊝⊝ Very low1,2 | Data for clinically important change in quality of life were not available. |
|
Satisfaction with treatment: leaving the study early Endpoint data (events) |
Study population | RR 1.16 (0.60 to 2.25) | 71 (1 RCT) | ⊕⊝⊝⊝ Very low1,2 | ||
| 321 per 1000 | 373 per 1000 (193 to 723) | |||||
| *The risk in the intervention group (and its 95% confidence interval) is based on the assumed risk in the comparison group and the relative effect of the intervention (and its 95% CI). BPRS: Brief Psychiatric Rating Scale; CI: confidence interval; QLS: Quality of Life Scale; RR: risk ratio; UKU: Udvalg for Kliniske Undersøgelser Adverse Effects Scale | ||||||
| GRADE Working Group grades of evidence High quality: further research is very unlikely to change our confidence in the estimate of effect. Moderate quality: further research is likely to have an important impact on our confidence in the estimate of effect and may change the estimate. Low quality: further research is very likely to have an important impact on our confidence in the estimate of effect and is likely to change the estimate. Very low quality: we are very uncertain about the estimate. | ||||||
1 Risk of bias: rated 'very serious'; randomisation method not described, allocation concealment method not described, high attrition
2 Imprecision: rated 'very serious'; evidence from one small study
Summary of findings 11. Group C other: cognitive training compared to active control (tablet games) for prodromal stage of psychosis.
| Cognitive training compared to active control (tablet games) for prodromal stage of psychosis | ||||||
| Patient or population: people in the prodromal stage of psychosis Setting: outpatient Intervention: cognitive training Comparison: active control (tablet games) | ||||||
| Outcomes | Anticipated absolute effects* (95% CI) | Relative effect (95% CI) | № of participants (studies) | Quality of the evidence (GRADE) | Comments | |
| Risk with active control (tablet games) | Risk with cognitive training | |||||
| Prodromal symptoms: transition to psychosis | See comment | See comment | Not estimable | 0 (0) | See comment | No study reported this outcome |
| Global state: clinically important change in global state | See comment | See comment | Not estimable | 0 (0) | See comment | No study reported this outcome |
|
Mental state: psychosis risk symptoms SOPS total (higher score = worse, scale from: 0‐114) Follow‐up: 24 months |
The mean mental state: psychosis risk symptoms was 25.49 points | The mean mental state: psychosis risk symptoms was 33.9 points See comment |
‐ | 62 (1 RCT) | ⊕⊝⊝⊝ Very low1,2 | Data for this outcome were skewed, and therefore we did not present summary estimates |
| Behaviour: clinically important change in behaviour | See comment | See comment | Not estimable | 0 (0) | See comment | No study reported this outcome |
| Adverse effects: at least one serious adverse event | See comment | See comment | Not estimable | 0 (0) | See comment | No study reported this outcome |
| Quality of life: clinically important change in quality of life | See comment | See comment | Not estimable | 0 (0) | See comment | No study reported this outcome |
|
Satisfaction with treatment: leaving the study early Endpoint data (events) Long‐term Follow‐up: by 24 months |
Study population | RR 0.78 (0.48 to 1.29) | 83 (1 RCT) | ⊕⊝⊝⊝ Very low1,2 | ||
| 485 per 1000 | 378 per 1000 (233 to 625) | |||||
| *The risk in the intervention group (and its 95% confidence interval) is based on the assumed risk in the comparison group and the relative effect of the intervention (and its 95% CI). CI: confidence interval; RR: risk ratio; SOPS: Scale of Prodromal Symptoms | ||||||
| GRADE Working Group grades of evidence High quality: further research is very unlikely to change our confidence in the estimate of effect. Moderate quality: further research is likely to have an important impact on our confidence in the estimate of effect and may change the estimate. Low quality: further research is very likely to have an important impact on our confidence in the estimate of effect and is likely to change the estimate. Very low quality: we are very uncertain about the estimate. | ||||||
1Risk of bias: rated 'very serious'; randomisation method not described, allocation concealment method not described, high attrition. 2Imprecision: rated 'very serious'; evidence from one small study.
Summary of findings 12. Group C other: family treatment compared to enhanced care for prodromal stage of psychosis.
| Family treatment compared to enhanced care for prodromal stage of psychosis | ||||||
| Patient or population: people in the prodromal stage of psychosis Setting: outpatient Intervention: family treatment Comparison: enhanced care | ||||||
| Outcomes | Anticipated absolute effects* (95% CI) | Relative effect (95% CI) | № of participants (studies) | Quality of the evidence (GRADE) | Comments | |
| Risk with enhanced care | Risk with family treatment | |||||
|
Prodromal symptoms: transition to psychosis FACT Long‐term Follow‐up: 24 months |
Study population | RR 0.71 (0.35 to 1.45) | 100 (1 RCT) | ⊕⊝⊝⊝ Very low1,2 | ||
| 280 per 1000 | 199 per 1000 (98 to 406) | |||||
|
Global state: antipsychotic prescriptions (events) Follow‐up: 24 months |
Study population | RR 1.18 (0.69 to 2.02) | 129 (1 RCT) | ⊕⊝⊝⊝ Very low2,3 | ||
| 270 per 1000 | 318 per 1000 (186 to 545) | |||||
|
Mental state: specific ‐ psychosis risk, positive symptoms Average total score, SOPS positive (higher score = worse, scale from 0‐30) Short‐term Follow‐up: 6 months |
The mean mental state: specific ‐ psychosis risk, positive symptoms was 9.84 points | MD 2.01 points lower (3.87 lower to 0.15 lower) | ‐ | 102 (1 RCT) | ⊕⊝⊝⊝ Very low2,3 | Data for our predefined outcome of interest 'Clinically important change in mental state' were not reported by the studies. |
| Behaviour: clinically important change in behaviour | See comment | See comment | Not estimable | 0 (0) | See comment | No study reported this outcome |
|
Adverse events: suicide (events) Long‐term (by 24 months) Follow‐up: 24 months |
Study population | RR 1.00 (0.06 to 15.55) | 100 (1 RCT) | ⊕⊝⊝⊝ Very low1,2 | ||
| 20 per 1000 | 20 per 1000 (1 to 311) | |||||
| Quality of life: clinically important change in quality of life | See comment | See comment | Not estimable | 0 (0) | See comment | No study reported this outcome |
|
Satisfaction with treatment: leaving the study early FACT Long‐term Follow‐up: 24 months |
Study population | RR 0.94 (0.52 to 1.68) | 100 (1 RCT) | ⊕⊝⊝⊝ Very low1,2 | ||
| 320 per 1000 | 301 per 1000 (166 to 538) | |||||
| *The risk in the intervention group (and its 95% confidence interval) is based on the assumed risk in the comparison group and the relative effect of the intervention (and its 95% CI). CI: confidence interval; FACT: Family‐aided Assertive Community Treatment; MD: mean difference; RCT: randomised controlled trial; RR: risk ratio; SOPS: Scale for Prodromal Symptoms | ||||||
| GRADE Working Group grades of evidence High quality: further research is very unlikely to change our confidence in the estimate of effect. Moderate quality: further research is likely to have an important impact on our confidence in the estimate of effect and may change the estimate. Low quality: further research is very likely to have an important impact on our confidence in the estimate of effect and is likely to change the estimate. Very low quality: we are very uncertain about the estimate. | ||||||
1Risk of bias: rated 'very serious'; randomisation method not described, allocation concealment method not described, participants not blinded, high attrition, unclear risk of selective reporting bias. 2Imprecision: rated 'very serious'; evidence from one small study. 3Risk of bias: rated 'very serious'; randomisation method not described, allocation concealment method not described, participants not blinded, outcome assessors not blinded, unclear risk of selective reporting bias.
Summary of findings 13. Group C other: integrated treatment compared to standard treatment for prodromal stage of psychosis.
| Integrated treatment compared to standard treatment for prodromal stage of psychosis | ||||||
| Patient or population: people in the prodromal stage of psychosis Setting: outpatient Intervention: integrated treatment Comparison: standard treatment | ||||||
| Outcomes | Anticipated absolute effects* (95% CI) | Relative effect (95% CI) | № of participants (studies) | Quality of the evidence (GRADE) | Comments | |
| Risk with standard treatment | Risk with integrated treatment | |||||
|
Prodromal symptoms: transition to psychosis Endpoint data (events) Long‐term Follow‐up: by 2 years |
Study population | RR 0.57 (0.28 to 1.15) | 79 (1 RCT) | ⊕⊝⊝⊝ Very low1,2 | ||
| 378 per 1000 | 216 per 1000 (106 to 435) | |||||
| Global state: clinically important change in global state | See comment | See comment | Not estimable | 0 (0) | See comment | No study reported this outcome |
|
Mental state SANS total (higher score = worse, scale from 0‐130) Follow‐up: 2 years |
The mean mental state was 1.7 points | The mean mental state was 1.34 points See comment |
‐ | 57 (1 RCT) | ⊕⊝⊝⊝ Very low1,2 | Data for this outcome were skewed, and therefore we did not present summary estimates |
| Behaviour: clinically important change in behaviour | See comment | See comment | Not estimable | 0 (0) | See comment | No study reported this outcome |
| Adverse effects: at least one serious adverse event | See comment | See comment | Not estimable | 0 (0) | See comment | No study reported this outcome |
| Quality of life: clinically important change in quality of life | See comment | See comment | Not estimable | 0 (0) | See comment | No study reported this outcome |
|
Satisfaction with treatment: leaving the study early Endpoint data (events) |
Study population | RR 0.66 (0.25 to 1.73) | 79 (1 RCT) | ⊕⊝⊝⊝ Very low1,2 | ||
| 216 per 1000 | 143 per 1000 (54 to 374) | |||||
| *The risk in the intervention group (and its 95% confidence interval) is based on the assumed risk in the comparison group and the relative effect of the intervention (and its 95% CI). CI: Confidence interval; MD: mean difference; RCT: randomised controlled trial; RR: Risk ratio; SANS: Scale for Assessment of Negative Symptoms | ||||||
| GRADE Working Group grades of evidence High quality: further research is very unlikely to change our confidence in the estimate of effect. Moderate quality: further research is likely to have an important impact on our confidence in the estimate of effect and may change the estimate. Low quality: further research is very likely to have an important impact on our confidence in the estimate of effect and is likely to change the estimate. Very low quality: we are very uncertain about the estimate. | ||||||
1Risk of bias: rated 'very serious'; allocation concealment method not described, participants not blinded, outcome assessors not blinded, moderate attrition, unclear risk of selective reporting bias. 2Imprecision: rated 'very serious'; evidence from one small study.
Background
Description of the condition
Schizophrenia is a chronic, recurrent illness that usually starts with a prodromal phase, eventually followed by the first acute phase. It continues with periods of remission and acute psychosis. With each episode of psychosis, mental state will usually deteriorate, finally reaching a state of chronicity. People with schizophrenia usually have more than three psychotic episodes, with only partial remission from each episode over the course of their illness (Wiersma 1998), and decline in functional status is linked to the progression of neurobiological damage over time (Andreasen 2013).
Schizophrenia has a prevalence of 1% worldwide, affecting a substantial number of people each year (Wittchen 2011). Treatment of schizophrenia is complex, costly, and offers only partial, limited improvement in two‐thirds of sufferers. Treatment response is best for first‐episode psychoses, but unfortunately, due to treatment non‐adherence, the majority of patients relapse within a few years. With every new relapse, treatment resistance increases (Emsley 2013). Over its course, schizophrenia still remains a disorder with low functional recovery rates (Jaaskelainen 2013; Wunderink 2013), and remains among the leading causes of disability (Wittchen 2011).
A number of early intervention services, developed over the last 20 years worldwide, have shifted attention to the treatment of the early course of schizophrenia, including the prevention of schizophrenia in people at risk. Specialised teams have established a set of clinical criteria for identifying people at risk of developing schizophrenia, this includes the clinical high risk (CHR) criteria (comprising the 'at‐risk mental state' (ARMS) or prodromal syndrome); the ultra high risk (UHR) criteria (comprising the attenuated psychotic syndrome (APS)); the 'Brief Limited Intermittent Psychotic Syndrome' (BLIPS); and genetic risk combined with functional decline (Cornblatt 2002; Miller 2003; Yung 2004; Broome 2005; Yung 2005; Cannon 2008). Another approach has been researched ‐ the Basic Symptom approach. This includes the cognitive‐perceptive (COPER) basic symptoms; and Cognitive Disturbances (COGDIS; Schultze‐Lutter 2009). The use of psychometric prognostic interviews for CHR have been reviewed by Fusar‐Poli, and their use as clinical tools for high risk services worldwide has been supported (Fusar‐Poli 2016).
People with CHR criteria have been found to have neurocognitive impairments, and corresponding neurotransmitter and structural changes have been identified. These include hyperdopaminergia in the striatum and hippocampal glutamate alterations (Stone 2010; Allen 2012; Howes 2012), thalamic disconnectivity (Anticevic 2015), as well as reductions in grey matter in the left parahippocampal and fusiform gyri (Job 2006), and temporal lobe volume reduction (Chung 2015).
Description of the intervention
There are a number of early intervention services that focus on treating early phases or prodromal stage of schizophrenia and preventing development of psychoses in CHR/UHR groups.
1. Pharmacotherapy treatment
Pharmacotherpay includes antipsychotics, mood stabilisers and antidepressant treatment.
Antipsychotic treatment is a well‐established treatment for first episode psychosis. However, due to a number of potential side effects as well as the lack of firm evidence that it is effective for prevention of psychosis, antipsychotic treatment is currently suggested in the prodromal phase of the illness only for more complex cases and only with a few atypical antipsychotics (Schmidt 2015). Treatment with antidepressants is not suggested for the treatment of acute‐episode psychosis, as evidence suggests that antidepressants may be associated with the risk of worsening psychosis. However, it has been suggested that treating prodromal depressive syndromes may actually delay the onset of psychosis (Cornblatt 2007a; Fusar‐Poli 2007). Mood stabilisers are used as first‐ or second‐line treatment for bipolar disorders, which sometimes present as affective psychoses. Their use in the prodromal stage may potentially be useful (Berger 2012). Anxiolitics are used for the short‐term reduction of anxiety in first‐episode psychosis. It has been suggested that reducing anxiety in the prodromal phase of the illness may postpone psychosis (McAusland 2015).
2. The use of nutritives/supplements and alternative medication
This category includes omega‐3, glycine, D‐serine, B vitamins, folic acid, and immune response modulators.
Based on the hypothesis of the alteration of metabolism of lipids, homocysteine levels and neuroinflammation in schizophrenia, a number of studies examined the influence of different supplements aimed at restoring lipid metabolism or low levels of vitamins in UHR people (Amminger 2010; Woods‐1‐USA; Sommer 2014; Kantrowitz 2015; Xu 2015).
3. Psychotherapy or psychosocial interventions
Psychotherapy and psychosocial interventions include psychoeducation, social skills training, metacognitive training, cognitive remediation, family therapy, individual psychotherapy, and combined multiple approaches.
Most early intervention services focus on psychosocial methods, offered for a variable duration of time, and suggested psychosocial interventions as the first‐line treatment for the prodromal stage. Studies showed variable and generally modest effectiveness of a variety of psychosocial methods for people with schizophrenia, especially over a longer assessment period (Falloon 1985; Hogarty 1991; Dolder 2003; Durham 2005; Velligan 2008; Jauhar 2014; Anderson 2015; Cai 2015; Ruggeri 2015).
How the intervention might work
There are a variety of treatment options, and each of them may work differently:
Pharmacotherapy based on antipsychotics has documented efficacy for psychotic symptoms, based on their blockade/agonism of multireceptor sites. In particular, cortical dopamine transmission via D1 receptors may play a role in impaired working memory and negative symptoms, whereas striatal dopamine activity via D2 receptors may modulate response inhibition, temporal organisation, and motor performance (Abi‐Dargham 2004).
Mood stabilisers may act as modulators of glutamate neurotransmission, counteracting the effect of the excessive glutamate transmission. Anxiolytics may increase GABA neurotransmission, subsequently decreasing excessive glutamate transmission. Both of these support the glutamate hypothesis of schizophrenia. Antidepressants may increase serotoninergic, noradrenergic or dopaminergic neurotransmission in the prefrontal cortex, subsequently affecting cognitive and depressive symptoms in the prodromal stage.
Nutritives/supplements and alternative medication (omega‐3, glycine, D‐serine, B vitamins, folic acid) act as glutamatergic modulators (glycine, D‐serine), suppressing the increased immune response (acetylsalicylate and others) or counteracting the altered phospholipid metabolism observed in some people with schizophrenia (Amminger 2010; Woods‐1‐USA; Sommer 2014; Kantrowitz 2015; Xu 2015).
Psychosocial interventions may enhance self‐confidence and self‐esteem, cognitive abilities, social skills, social network and support, all contributing to increased coping mechanisms and decreased anxiety and vulnerability to stressors, and subsequently to psychosis.
Why it is important to do this review
Psychosis has a large impact on an individual's life, causing long‐term health, economic and social problems. Identifying and treating people in the prodromal stage of psychosis may prevent full transition to schizophrenia and in turn negate some of the ill effects brought about by psychosis. Since firm evidence of the efficacy and safety of different treatment approaches in this vulnerable group is lacking, a systematic review can help inform decisions of healthcare workers, researchers, politicians and other public health decision makers.
Objectives
The primary objective is to assess the safety and efficacy of early interventions for people in the prodromal stage of psychosis.
The secondary objective is, if possible, to compare the effectiveness of the various different interventions.
Methods
Criteria for considering studies for this review
Types of studies
All relevant randomised controlled studies. If a study had been described as 'double‐blind' but implied randomisation, we would have included such studies in a sensitivity analysis (see Sensitivity analysis). We excluded quasi‐randomised studies, such as those allocating by alternate days of the week.
Types of participants
We included participants older than 12 years, who had developed a prodromal stage of psychosis, including people that met at least one of the following criteria:
positive psychiatric heredity (relatives that suffer from schizophrenia spectrum disorders and non‐organic psychosis) combined with functional decline over the last 12 months;
experienced Brief Limited Intermittent Psychotic Symptoms combined with functional decline over the last 12 months;
experienced Attenuated Psychosis Syndrome combined with functional decline over the last 12 months.
Exclusion criteria were mental illness in childhood that can present with psychosis (such as autism); organic conditions that can present with psychosis; neurological disorders; mental retardation; comorbid alcoholism or abuse of opiates and other substance disorders (excluding marijuana); pregnancy and lactation; and the use of medications that can produce psychotic reactions.
Studies had to use internationally recognised criteria for diagnosis (such as Diagnostic and Statistical Manual of Mental Disorders V (DSM‐5) or previous editions of DSM (APA 2013); and the International Classification of Diseases 10 (ICD‐10) or previous editions of ICD (WHO 2010)). For studies that included only a subset of relevant participants, we only included the study if data for the population of interest were reported separately.
Types of interventions
Pharmacotherapy: any oral antipsychotics
Alternative medication (e.g. omega‐3, B12 vitamins, folic acid, B6 vitamins)
Psychotherapies: including psychodynamically oriented individual psychotherapy, cognitive behavioural psychotherapy, group therapy (psychodynamically oriented), systemic therapy, interpersonal therapy, integrative therapy, family therapy
Pyschosocial interventions: including psychoeducation (individual, group and family), metacognitive training (individual and group), cognitive remediation training, social skills training
Combined pharmacotherapy and psychotherapy or psychosocial interventions, or psychosocial interventions including a combination of at least two approaches, one of which is pharmacotherapy and one psychotherapy or psychosocial intervention
Placebo
No therapy or treatment, or treatment as usual (TAU) (e.g. brief outpatients’ consultations less than once every three months).
Types of outcome measures
We divided all outcomes into short‐term (less than six months), medium‐term (7 to 12 months) and long‐term (over one year) outcomes.
Primary outcomes
1. Prodromal symptoms
1.1. Transition to psychosis during follow‐up period 1.2. Clinically important change of severity of prodromal symptoms 1.3. Any change in prodromal symptoms 1.4. Remission of prodromal symptoms
2. Global state
2.1. Clinically important change in global state
3. Adverse effects
3.1. Clinically important general adverse effects
Secondary outcomes
1. General overall functioning (social functioning, relationship status, employment status, academic status)
1.1. Clinically important change in overall functioning, as defined by each of the studies 1.2. Average endpoint/change score in overall functioning scales 1.3 Clinically important change in social functioning, as defined by each of the studies 1.4. Average endpoint/change score in social functioning scales 1.5. Change in the relationship status, as defined by each of the studies 1.6. Change in the employment status, as defined by each of the studies 1.7. Change in the academic status, as defined by each of the studies
2. Global state
2.1. Any change in global state 2.2. Average endpoint/change score in global state scales
3. Mental state: general symptoms; specific psychotic symptoms (positive symptoms (delusions, hallucinations, disordered thinking); negative symptoms (avolition, poor self‐care, blunted affect)); mood; psychomotor; cognitive
3.1. Clinically important change in mental state, as defined by each of the studies 3.2. Average endpoint/change score in mental state scales 3.3. Clinically important change in positive symptoms, as defined by each of the studies 3.4. Average endpoint/change score in positive symptoms scales 3.5. Clinically important change in negative symptoms, as defined by each of the studies 3.6. Average endpoint/change score in negative symptoms scales 3.7. Clinically important change in affective/mood symptoms, as defined by each of the studies 3.8. Average endpoint/change score in affective/mood symptoms scales 3.9. Clinically important change in psychomotor symptoms, as defined by each of the studies 3.10. Average endpoint/change score in psychomotor symptoms scales 3.11. Clinically important change in cognitive symptoms, as defined by each of the studies 3.12. Average endpoint/change score in cognitive symptoms scales
4. Behaviour: general behaviour, specific behaviours (for example, aggressive or violent behaviour); occurrence of violent incidents (to self, others or property)
4.1. Clinically important change in overall behaviour, as defined by each of the studies 4.2. Average endpoint/change score in overall behaviour scales 4.3. Clinically important change in specific behaviour, as defined by each of the studies 4.4. Average endpoint/change score in specific behaviour scales 4.5. Occurrence of violent incidents
5. Adverse effects
5.1. Average endpoint/change score in general adverse effect scores 5.2. Clinically important specific adverse effects 5.3. Average endpoint/change score in specific adverse effect scores 5.4. Various adverse effects: specific movement disorders (extrapyramidal side effects, specifically tardive dyskinesia and neuroleptic malignant syndrome); sedation; dry mouth; weight gain; sleepiness; dizziness; palpitations; muscle rigidity; hypersalivation; blurred vision; dysuria; nausea; nocturnal enuresis; thirst; polyuria; prolactinaemia side‐effects (swollen nipples, galactorrhoea, loss of sexual pleasure, erectile dysfunction)
6. Death by suicide or by natural causes
7. Quality of life
7.1. Any change in quality of life, as defined by each of the studies 7.2. Average endpoint/change score in quality‐of‐life scales
8. Satisfaction with treatment (participant/carer)
8.1. Leaving the study early 8.2. Participant/carer not satisfied with treatment 8.3. Participant/carer average satisfaction score 8.4. Participant/carer change in the satisfaction scores
9. Service outcomes
9.1. Hospital admission 9.2. Duration of hospital stay
10. Economic outcomes
10.1. Cost of care
'Summary of findings' table
We used the GRADE approach to interpret findings (Schünemann 2017); and GRADEpro GDT to import data from Review Manager 5 (RevMan 5) to create 'Summary of findings' tables (Review Manager 2014). These tables provide outcome‐specific information concerning the overall quality of evidence from each included study in the comparison, the magnitude of effect of the interventions examined, and the sum of available data on all outcomes we rated as important to patient care and decision making. We selected the following main outcomes for inclusion in the 'Summary of findings' table:
Prodromal symptoms: transition to psychosis
Global state: clinically important change in global state
Mental state: clinically important change in mental state
Behaviour: clinically important change in behaviour
Adverse effects: at least one serious adverse event
Quality of life: clinically important change in quality of life
Satisfaction with treatment: leaving the study early
Search methods for identification of studies
Electronic searches
Cochrane Schizophrenia’s Register of studies
On 8 June 2016 and 4 August 2017, the Information Specialist searched Cochrane Schizophrenia’s study‐based Register of studies using the following search strategy, which has been developed based on literature review and consulting with the authors of the review:
(*At Risk* OR *At‐Risk* OR *Attenuat* Psycho* Syndrome* OR *Brief Limited Intermittent Psycho* Symptom* OR *Brief Limited Intermittent Psycho* Syndrome* OR *Brief Self Limited Psycho* Syndrome* OR *Brief Self‐Limited Psycho* Syndrome* OR *Cognit* Disturbance* OR *Cognit* Percept* Basic Symptom* OR *Cognitive‐Percept* Basic Symptom* OR *Conver* OR *Elevated Clinical Risk* OR *Family History* OR *Genetic* Risk* OR *Heredity* OR *High Clinical Risk* OR *High Genetic Risk* OR *High Risk* OR *High‐Risk* OR *Inherit* OR *Onset* OR *Pre Delusion* OR *Pre Psycho* OR *Predelusion* OR *Pre‐Delusion* OR *Prepsycho* OR *Pre‐Psycho* OR *Prodrom* OR *Relative* OR *Risk* Syndrome* OR *Sub Psycho* OR *Subpsycho* OR *Sub‐Psycho* OR *Transition* OR *Vulnerable*) in Title OR Abstract of REFERENCE OR (*At Risk of Psychosis* OR *Prodromal Illness* OR *Family History of Psychosis* OR *Early Onset*) in Healthcare Condition of STUDY
In study‐based registers, searching the major concept retrieves all the synonym keywords and relevant studies because all the studies have already been organised based on their interventions and linked to the relevant topics.
Cochrane Schizophrenia’s Register of studies is compiled by systematic searches of major resources (including AMED, BIOSIS CINAHL, EMBASE, MEDLINE, PsycINFO, PubMed, and registries of clinical trials) and their monthly updates, handsearches, grey literature, and conference proceedings (see Cochrane Schizophrenia Register of trials). There are no language, date, document type, or publication status limitations for inclusion of records into the register.
Searching other resources
1. Reference searching
We inspected references of all included studies for further relevant studies.
2. Personal contact
We contacted the first author of each included study for information regarding unpublished studies. We noted the outcome of this contact in the sections 'Characteristics of included studies' or 'Characteristics of studies awaiting classification'.
Data collection and analysis
Selection of studies
DB and IK independently inspected citations from the searches and identified relevant abstracts. JH re‐inspected a random 20% sample to ensure reliability. In the case of disputes, we acquired the full report for more detailed scrutiny. We obtained full reports of the abstracts meeting the review criteria and DB and IK inspected these. Again, JH re‐inspected a random 20% of the full reports in order to ensure reliable selection. Where it was not possible to resolve disagreement by discussion, we attempted to contact the authors of the study for clarification.
Data extraction and management
1. Extraction
Review authors DB and IK extracted data from all included studies. In addition, to ensure reliability, JH independently extracted data from a random sample of these studies, comprising 10% of the total. Again, we discussed any disagreement, documented decisions and, if necessary, contacted authors of studies for clarification. With remaining problems MRK helped to clarify issues and we documented these final decisions. We extracted data presented only in graphs and figures whenever possible, but only included them if two review authors independently had the same result. We attempted to contact study authors through an open‐ended request in order to obtain missing information or for clarification whenever necessary. If studies were multicentre, where possible we extracted data relevant to each component centre separately.
2. Management
2.1 Forms
We extracted data onto standard, simple forms.
2.2 Scale‐derived data
We included continuous data from rating scales only if: a) the psychometric properties of the measuring instrument had been described in a peer‐reviewed journal (Marshall 2000); and b) the measuring instrument had not been written or modified by one of the trialists for that particular study. Ideally the measuring instrument should either be i. a self‐report or ii. completed by an independent rater or relative (not the therapist). We realise that this is not often reported clearly; in 'Description of studies' we noted if this is the case or not.
2.3 Endpoint versus change data
There are advantages of both endpoint and change data. Change data can remove a component of between‐person variability from the analysis. On the other hand calculation of change needs two assessments (baseline and endpoint), which can be difficult in unstable and difficult‐to‐measure conditions such as schizophrenia. We decided to primarily use endpoint data, and only use change data if the former are not available and used mean differences (MD) rather than standardised mean differences throughout (Deeks 2017).
2.4 Skewed data
Continuous data on clinical and social outcomes are often not normally distributed. To avoid the pitfall of applying parametric tests to non‐parametric data, we applied the following standards to all data before inclusion.
Endpoint data (more than 200 participants)
We entered data from studies of at least 200 participants in analyses, irrespective of the following rules, because skewed data pose less of a problem in large studies.
Change data
We also entered change data as when continuous data are presented on a scale that includes a possibility of negative values (such as change data), it is difficult to tell whether data are skewed or not. We presented and entered change data into statistical analyses where possible.
Endpoint data (fewer than 200 participants)
a) when a scale starts from the finite number zero, we subtracted the lowest possible value from the mean, and divided this by the standard deviation. If this value was lower than 1, it strongly suggests a skew and we excluded these data. If this ratio was higher than 1 but below 2, there is suggestion of skew. We entered these data and tested whether their inclusion or exclusion would change the results substantially. Finally, if the ratio was larger than 2 we included such data because skew is less likely (Altman 1996; Deeks 2017).
b) if a scale starts from a positive value (such as the Positive and Negative Syndrome Scale (PANSS, Kay 1986), which can have values from 30 to 210), we modified the calculation described to take the scale starting point into account. In these cases skew is present if 2 SD > (S − S min), where S is the mean score and 'S min' is the minimum score.
2.5 Common measure
To facilitate comparison between studies, we converted variables that could be reported in different metrics, such as days in hospital (mean days per year, per week or per month) to a common metric (e.g. mean days per month).
2.6 Conversion of continuous to binary
Where possible, we made efforts to convert outcome measures to dichotomous data. This can be done by identifying cut‐off points on rating scales and dividing participants accordingly into 'clinically improved' or 'not clinically improved'. It is generally assumed that if there is a 50% reduction in a scale‐derived score such as the Brief Psychiatric Rating Scale (BPRS, Overall 1962), or the PANSS (Kay 1987), this could be considered as a clinically significant response (Leucht 2005a; Leucht 2005b). If data based on these thresholds were not available, we used the primary cut‐off presented by the original study authors.
2.7 Direction of graphs
Where possible, we entered data in such a way that the area to the left of the line of no effect indicates a favourable outcome for early intervention. Where keeping to this made it impossible to avoid outcome titles with clumsy double‐negatives (e.g. 'Not un‐improved') we reported data where the left of the line indicated an unfavourable outcome and made a note in the relevant graphs.
Assessment of risk of bias in included studies
Review authors DB and LP worked independently to assess risk of bias by using criteria described in the Cochrane Handbook for Systematic Reviews of Interventions (Higgins 2017). This set of criteria is based on evidence of associations between overestimate of effect and high risk of bias of the article such as sequence generation, allocation concealment, blinding, incomplete outcome data and selective reporting.
For attrition bias, we used the following assessment criteria: we judged as low risk of bias studies where attrition was under 30%, unclear risk of bias if attrition was between 30% and 50%, and high risk of bias if total attrition rate, or attrition in any of the groups, was higher than 50%. If attrition was under 30%, but reasons for attrition were unclear, we judged the study as unclear risk of attrition bias.
If the raters disagreed, we made the final rating by consensus. Where inadequate details of randomisation and other characteristics of studies were provided, we contacted authors of the studies in order to obtain further information. We have noted the level of risk of bias in both the text of the review and in Figure 1; Figure 2
1.
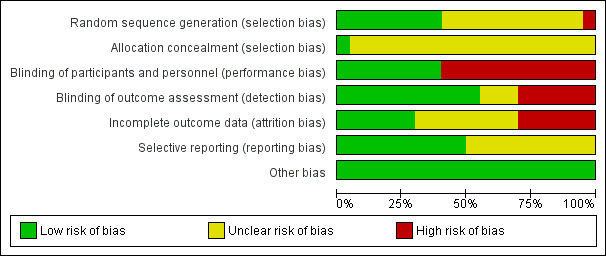
'Risk of bias' graph: review authors' judgements about each 'Risk of bias' item presented as percentages across all included studies
2.

'Risk of bias' summary: review authors' judgements about each 'Risk of bias' item for each included study
Measures of treatment effect
1. Binary data
For binary outcomes we calculated a standard estimation of the risk ratio (RR) and its 95% confidence interval (CI). It has been shown that RR is more intuitive than odds ratios (Boissel 1999); and that odds ratios tend to be interpreted as RR by clinicians (Deeks 2000).
2. Continuous data
For continuous outcomes we aimed to estimate mean difference (MD) between groups. We preferred not to calculate effect size measures (standardised mean difference (SMD)). However, if scales of very considerable similarity were used, we presumed there was a small difference in measurement, and calculated effect size and transformed the effect back to the units of one or more of the specific instruments.
Unit of analysis issues
1. Cluster trials
Studies increasingly employ 'cluster randomisation' (such as randomisation by clinician or practice) but analysis and pooling of clustered data poses problems. Firstly, authors often fail to account for intra‐class correlation in clustered trials, leading to a 'unit of analysis' error whereby P values are spuriously low, confidence intervals unduly narrow and statistical significance overestimated (Divine 1992). This causes type I errors (Bland 1997; Gulliford 1999).
Where clustering is not accounted for in primary studies, we presented data in a table, with a (*) symbol to indicate the presence of a probable unit‐of‐analysis error. We aimed to contact first authors of studies to obtain intra‐class correlation coefficients for their clustered data and to adjust for this by using accepted methods (Gulliford 1999). Where primary studies incorporated clustering into their analysis, we presented these data as if from a non‐cluster randomised trial, but adjusted for the clustering effect.
We have sought statistical advice and have been advised that the binary data as presented in a report should be divided by a 'design effect'. This is calculated using the mean number of participants per cluster (m) and the intra‐class correlation coefficient (ICC): [Design effect = 1 + (m − 1) * ICC] (Donner 2002). If the ICC was not reported we assumed it was 0.1 (Ukoumunne 1999).
If cluster trials have been appropriately analysed taking into account intra‐class correlation coefficients and relevant data documented in the report, synthesis with other studies is possible using the generic inverse variance technique.
2. Cross‐over trials
A major concern of cross‐over trials is the carry‐over effect. It occurs if an effect (e.g. pharmacological, physiological or psychological) of the treatment in the first phase is carried over to the second phase. As a consequence on entry to the second phase the participants can differ systematically from their initial state despite a wash‐out phase. For the same reason cross‐over trials are not appropriate if the condition of interest is unstable (Elbourne 2002). As both effects are very likely in severe mental illness, we only used data of the first phase of cross‐over trials.
3. Studies with multiple treatment groups
Where a study involved more than two treatment arms we, if relevant, presented the additional treatment arms in comparisons. If data were binary we simply added these and combined within the two‐by‐two table. If data were continuous we combined data following the formula in section 7.7.3.8 (Combining groups) of the Cochrane Handbook for Systematic Reviews of Interventions (Higgins 2011a). Where the additional treatment arms were not relevant, we did not reproduce these data.
Dealing with missing data
1. Overall loss of credibility
At some degree of loss of follow‐up, data must lose credibility (Xia 2009). We chose that, for any particular outcome, when more than 50% of data was unaccounted for, we did not reproduce these data or used them within analyses. If, however, more than 50% of those in one arm of a study were lost, but the total loss was less than 50%, we addressed this within the 'Summary of findings' tables by downgrading quality. Finally, we also downgraded quality within the 'Summary of findings' tables when loss was 25% to 50% in total.
2. Binary
In the case where attrition for a binary outcome was between 0% and 50% and where these data were not clearly described, we presented data on a 'once‐randomised‐always‐analyse' basis (an intention‐to‐treat analysis). Those leaving the study early were all assumed to have the same rates of negative outcome as those who completed, with the exception of the outcome of death and adverse effects. For these outcomes we used the rate of those who stayed in the study ‐ in that particular arm of the study ‐ for those who did not. We undertook a sensitivity analysis testing how prone the primary outcomes were to change when data only from people who completed the study to that point were compared to the intention‐to‐treat analysis using the above assumptions.
3. Continuous
3.1 Attrition
In the case where attrition for a continuous outcome was between 0% and 50%, and data only from people who completed the study to that point were reported, we reproduced these.
3.2 Standard deviations
If standard deviations (SDs) were not reported, we first tried to obtain the missing values from the study authors. If not available, where there were missing measures of variance for continuous data, but an exact standard error and confidence intervals available for group means, and either P value or T value available for differences in mean, we calculated them according to the rules described in the Cochrane Handbook for Systemic Reviews of Interventions. When studies only reported the standard error (SE), we calculated SDs by the formula SD = SE * √(n). Chapters 7.7.3 (Higgins 2011a), and 16.1.3 (Higgins 2011b), of the Cochrane Handbook for Systemic Reviews of Interventions present detailed formulae for estimating SDs from P values, T or F values, confidence intervals, ranges or other statistics. If these formulae did not apply, we calculated the SDs according to a validated imputation method that is based on the SDs of the other included studies (Furukawa 2006). Although some of these imputation strategies can introduce error, the alternative would be to exclude a given study’s outcome and thus to lose information. We nevertheless examined the validity of the imputations in a sensitivity analysis excluding imputed values.
3.3 Assumptions about participants who left the studies early or were lost to follow‐up
Various methods were available to account for participants who left the studies early or were lost to follow‐up. Some studies just presented the results of study completers, others used the method of last observation carried forward (LOCF), while more recently, methods such as multiple imputation or mixed‐effects models for repeated measurements (MMRM) have become more of a standard. While the latter methods seem somewhat better than LOCF (Leon 2006), we feel that the high percentage of participants leaving the studies early and differences in the reasons for leaving the studies early between groups is often the core problem in randomised schizophrenia studies. We therefore did not exclude studies based on the statistical approach used. However, we preferably used the more sophisticated approaches. For example, we preferred to use MMRM or multiple‐imputation to LOCF and completer analyses only if some kind of ITT data were not available at all. Moreover, we addressed this issue in the item 'incomplete outcome data' of the 'Risk of bias' tool.
Assessment of heterogeneity
1. Clinical heterogeneity
We considered all included studies initially, without seeing comparison data, to judge clinical heterogeneity. We simply inspected all studies for clearly outlying people or situations that we had not predicted would arise and if such situations or participant groups arose, we fully discussed them.
2. Methodological heterogeneity
We considered all included studies initially, without seeing comparison data, to judge methodological heterogeneity. We simply inspected all studies for clearly outlying methods that we had not predicted would arise and if such situations or participant groups arose, we fully discussed them.
3. Statistical heterogeneity
3.1 Visual inspection
We visually inspected graphs to investigate the possibility of statistical heterogeneity.
3.2 Employing the I² statistic
We investigated heterogeneity between studies by considering the I² method alongside the Chi² P value. The I² statistic provides an estimate of the percentage of inconsistency thought to be due to chance (Higgins 2003). The importance of the observed value of the I² statistic depends on i) the magnitude and direction of effects and ii) strength of evidence for heterogeneity (e.g. P value from Chi² test, or a confidence interval for I² statistic). We interpreted an I² statistic estimate greater than 50% accompanied by a statistically significant Chi² statistic as evidence of substantial levels of heterogeneity (Deeks 2017). When we found substantial levels of heterogeneity in the primary outcome, we explored reasons for heterogeneity (Subgroup analysis and investigation of heterogeneity).
Assessment of reporting biases
Reporting biases arise when the dissemination of research findings is influenced by the nature and direction of results (Egger 1997). These are described in Section 10 of the Cochrane Handbook for Systematic Reviews of Interventions (Sterne 2017). We were aware that funnel plots may be useful in investigating reporting biases but are of limited power to detect small‐study effects. We did not use funnel plots for outcomes where there were 10 or fewer studies, or where all studies were of similar size. In cases where funnel plots were possible, we looked for statistical advice in their interpretation.
Data synthesis
We understand that there is no closed argument for preference for use of fixed‐effect or random‐effects models. The random‐effects method incorporates an assumption that the different studies are estimating different, yet related, intervention effects. This often seems to be true to us and the random‐effects model takes into account differences between studies even if there is no statistically significant heterogeneity. There is, however, a disadvantage to the random‐effects model: it puts added weight onto small studies which often are the most biased ones. Depending on the direction of effect these studies can either inflate or deflate the effect size. We chose to use random‐effects or fixed‐effect models for all analyses after the selection of studies.
Subgroup analysis and investigation of heterogeneity
1. Subgroup analyses
1.1 Primary outcomes
If data were available, then for primary outcomes we investigated whether continuous treatment over a longer period (> 6 months) was more effective than structured short‐duration treatments of any kind.
1.2 Clinical state, stage or problem
We proposed to undertake this review and provide an overview of the various interventions available for people in the prodromal stage of psychosis. In addition, however, we reported any available data on subgroups of people in the same clinical state, stage and with similar problems.
2. Investigation of heterogeneity
We reported if inconsistency was high. First we investigated whether data had been entered correctly. Second, if data were correct, we visually inspected the graph and successively removed studies from the analysis to see if homogeneity was restored. For this review we decided that when this occurred with data contributing to the summary finding of no more than 10% of the total weighting, we would present the data. If not, we did not pool data, but discussed these issues. We know of no supporting research for this 10% cut‐off but are investigating use of prediction intervals as an alternative to this unsatisfactory state.
When unanticipated clinical or methodological heterogeneity were obvious we simply stated hypotheses regarding these for future reviews or versions of this review. We did not undertake analyses relating to these.
Sensitivity analysis
1. Implication of randomisation
We aimed to include studies in a sensitivity analysis if they were described in some way as to imply randomisation. We included these studies for the primary outcomes, and if their inclusion did not result in a substantive difference, they remained in the analyses. If their inclusion did result in significant differences, we did not add the data from these lower‐quality studies to the results of the better studies, but presented such data within a subcategory.
2. Assumptions for lost binary data
Where assumptions had to be made regarding people lost to follow‐up (see Dealing with missing data), we compared the findings of the primary outcomes when we used our assumption compared with completer data only. If there was a substantial difference, we reported results and discussed them but continued to employ our assumption.
Where assumptions had to be made regarding missing SD data (see Dealing with missing data), we compared the findings on primary outcomes when we used our assumption compared with completer data only. We undertook a sensitivity analysis testing how prone results were to change when 'completer' data only were compared to the imputed data using the above assumption. If there was a substantial difference, we reported results and discussed them but continued to employ our assumption.
3. Risk of bias
For primary outcomes, we analysed the effects of excluding studies that we judged to be at high risk of bias across one or more of the domains of randomisation (implied as randomised with no further details available, allocation concealment, blinding and outcome reporting). If the exclusion of studies at high risk of bias did not substantially alter the direction of effect or the precision of the effect estimates, then we included relevant data from these studies in the analysis.
4. Imputed values
We also undertook a sensitivity analysis to assess the effects of including data from studies where we used imputed values for ICC in calculating the design effect in cluster‐randomised studies.
If we noted substantial differences in the direction or precision of effect estimates in any of the sensitivity analyses listed above, we did not pool data from the excluded studies with the other studies contributing to the outcome, but presented them separately.
5. Fixed and random effects
If we synthesised data using a fixed‐effect model, we also synthesised data for the primary outcome using a random‐effects model to evaluate whether this alters the significance of the results. If we synthesised data using a random‐effects model we also synthesised data for the primary outcome using a fixed‐effect model to evaluate whether this alters the significance of the results.
Results
Description of studies
For substantive descriptions of studies, please see Characteristics of included studies; Characteristics of excluded studies; Characteristics of ongoing studies.
Results of the search
The original search (8 June 2016) identified 4852 abstracts to be screened. In addition, after screening the references of the studies, we identified three additional potentially eligible studies. After screening, we identified 70 potentially eligible unique studies, which were reported in 337 manuscripts (Figure 3). Out of these 70, 19 were finished studies that met our inclusion criteria. RAP‐USA and NEURAPRO‐Q‐Australia also met the inclusion criteria, but these studies terminated early in the recruitment phase so we excluded them from the analysis. Overall, we excluded 51 studies from the analysis (25 that did not meet the inclusion criteria, two that met the inclusion criteria but were terminated early, 16 that we classified as ongoing studies and eight that we classified as awaiting assessment due to insufficient data).
3.

Study flow diagram
The update search (4 August 2017), found a further 84 new references. Among them, there were 37 potentially eligible manuscripts; some of which described studies that we had already found in the initial search. Out of these, we identified three potentially eligible unique studies; of those three studies, we were able to include one additional study (Piskulic‐Canada). Two other studies met the inclusion criteria but we did not include them as one was terminated (Heresco‐Levy‐Israel), and one was ongoing (NCT02047539). One study, that we had previously categorised as awaiting assessment, we excluded after publication of the results.
Therefore, in total, we analysed 73 unique studies (reported in 374 manuscripts), of which we included 20 studies; we excluded 29 studies because they did not meet the inclusion criteria or were terminated early, 17 were still ongoing and seven are currently awaiting classification (three of which published data that are not usable for analysis and four of which require further clarification).
For substantive descriptions of studies, please see the Characteristics of included studies, Characteristics of ongoing studies, Characteristics of studies awaiting classification and Characteristics of excluded studies.
Included studies
We included 20 studies with 2016 participants (ADAPT‐Canada; Amminger‐Austria; Choi‐USA; DEPTh‐Australia; EDIE‐2‐UK; EDIE‐NL; EDIE‐UK; EDIP‐USA; EIPS‐Germany; Kantrowitz‐USA; LIPS‐Germany; Miklowitz‐USA; NEURAPRO‐AAE; Nordentoft‐Denmark; PACE‐Australia; Piskulic‐Canada; PRIME‐USA; Vinogradov‐USA; Woods‐1‐USA; Yung‐Australia).
1. Methods
All the included studies stated that they were randomised. For further description of study methods, please see Characteristics of included studies and Risk of bias in included studies.
2. Participants and setting
2.1 Within the cognitive behavioural therapy (CBT) and supportive therapy versus supportive therapy alone comparison
There are five included studies (ADAPT‐Canada; EDIE‐UK; EDIE‐2‐UK; EDIE‐NL; EIPS‐Germany). These studies included participants between the ages of 14 and 36 years old (mean ages ranged from 20.6 to 26). The studies were conducted in different locations around the world: ADAPT‐Canada was conducted in Toronto, Canada; EDIE‐UK and EDIE‐2‐UK were conducted in multiple locations in the UK; EDIE‐NL in The Hague, Rivierduinen and Friesland, Netherlands; and lastly, EIPS‐Germany in Cologne, Bonn, Dusseldorf, and Munich. The method of recruitment varied. ADAPT‐Canada recruited participants via advertisement on radio, public transit and local newspaper. EDIE‐UK recruited participants from community settings. The participants from EIPS‐Germany and EDIE‐2‐UK were help‐seeking. Different assessment criteria were used, ranging from Criteria of Prodromal States (COPS) in ADAPT‐Canada, CAARMS criteria (Yung 2005), in EDIE‐2‐UK and EDIE‐NL, adapted criteria (Yung 1998), in EDIE‐UK and criteria for the Early Initial Prodrome State in EIPS‐Germany.
2.2 Within the CBT versus different pharmacological or other interventions comparison
There are three included studies (DEPTh‐Australia; PACE‐Australia; Yung‐Australia). These studies were conducted in Australia, apart from DEPTh‐Australia, which also included participants from Newcastle, UK. The age of participants was between 14 to 30 years, and they were recruited from clinical settings. All of these studies defined UHR using CAARMS criteria (Yung 2005).
2.3 Within the cognitive training versus active control group comparison
There are three included studies (Choi‐USA; Piskulic‐Canada; Vinogradov‐USA). Ages of participants from these studies ranged between 12 to 35 years, and were recruited from North America (USA or Canada). All three studies made diagnosis using SIPS criteria. Choi‐USA and Piskulic‐Canada recruited participants who had been enrolled in other related research and Vinogradov‐USA recruited participants from community settings.
2.4 Within the family treatment versus enhanced treatment comparison
There are two included studies: (EDIP‐USA; Miklowitz‐USA). EDIP‐USA took place in Portland, USA and Miklowitz‐USA undertook research in multiple states in the USA and Canada. Participants were aged between 12 to 35 years, and SIPS criteria was used to define CHR. Both studies recruited participants who had been enrolled in previous related studies.
2.5 Within the integrated treatment versus standard treatment comparison
There is one study included in this comparison. Nordentoft‐Denmark was conducted in inpatient and outpatient mental health services in Copenhagen and Aarhus County, Denmark. Participants met criteria for schizotypal disorder (ICD‐10) and had a mean age of 24.9 years.
2.6 Within the antipsychotic drugs comparison
There are two included studies (LIPS‐Germany; PRIME‐USA). LIPS‐Germany recruited participants in community settings in Cologne, Bonn, Dusseldorf and Munich, whilst PRIME‐USA recruited treatment‐seeking patients in an outpatient setting in New Haven and North Carolina (USA) and Calgary and Toronto (Canada). The age range of participants was 18 to 36 years for LIPS‐Germany and 12 to 45 years for PRIME‐USA. The participants for LIPS‐Germany fulfilled the Basic Symptom criteria for either the Early Initial Prodrome State or Late Initial Prodrome State. The participants for PRIME‐USA fulfilled SIPS criteria.
2.7 Within the different nutritives/supplements versus alternative medication comparison
There are four included studies (Amminger‐Austria; Kantrowitz‐USA; NEURAPRO‐AAE; Woods‐1‐USA). Amminger‐Austria took place in Vienna, Austria; Kantrowitz‐USA and Woods‐1‐USA took place in the USA; and NEURAPRO‐AAE is a multicentre study that took place in Australia, Switzerland, Denmark, Austria, Hong Kong, Singapore, Germany and the Netherlands. Participants were aged between 13 to 40 years. Amminger‐Austria used Yung's criteria for the 'ultra high risk' mental state. Kantrowitz‐USA and Woods‐1‐USA used the SOPS criteria, whilst NEURAPRO‐AAE included participants who met the criteria for “at risk” groups, as measured by Trait and State Risk Factor, Attenuated Psychotic Symptoms (APS) or Brief Limited Intermittent Psychotic Symptoms (BLIPS).
3. Study size
The size of studies ranged from eight participants to 304 participants.
| Study | Number |
| NEURAPRO‐AAE | 304 |
| EDIE‐2‐UK | 288 |
| EDIE‐NL | 201 |
| Yung‐Australia | 115 |
| EIPS‐Germany | 128 |
| Miklowitz‐USA | 102 |
| LIPS‐Germany | 102 |
| EDIP‐USA | 100 |
| Vinogradov‐USA | 83 |
| Amminger‐Austria | 81 |
| Nordentoft‐Denmark | 79 |
| Choi‐USA | 62 |
| PACE‐Australia | 59 |
| EDIE‐UK | 60 |
| PRIME‐USA | 60 |
| DEPTh‐Australia | 57 |
| ADAPT‐Canada | 51 |
| Kantrowitz‐USA | 44 |
| Piskulic‐Canada | 32 |
| Woods‐1‐USA | 8 |
4. Length of studies
The length of intervention ranged from eight weeks to 24 months. The overall length of the studies (including intervention and follow‐up) ranged from three months to 84 months. Three studies were specific as they had additional follow‐up longer than it was planned in their protocols. These were Amminger‐Austria(1 year according to the protocol, but 7 years with the additional follow‐up), EDIE‐NL (1.5 years planned, but 4 years with the additional follow‐up) and PACE‐Australia (1 year planned, but 4 years with additional follow‐up).
| Study | Months |
| LIPS‐Germany | 3 |
| Kantrowitz‐USA | 4 |
| Choi‐USA | 4 |
| Woods‐1‐USA | 5.5 |
| Piskulic‐Canada | 9 |
| Years | |
| ADAPT‐Canada; DEPTh‐Australia | 1.5 |
| EDIE‐2‐UK; EDIP‐USA; Miklowitz‐USA; NEURAPRO‐AAE; Nordentoft‐Denmark; PRIME‐USA; Vinogradov‐USA; Yung‐Australia | 2 |
| EDIE‐UK; EIPS‐Germany | 3 |
| EDIE‐NL; PACE‐Australia | 4 |
| Amminger‐Austria | 7 |
5. Interventions
Within this review, we aim to summarise best evidence of the effects of a series of treatments for people with prodromal illness. In doing so it was always likely that we would identify several treatments that have been used for these people but we did not pre‐state within our protocol groupings for the treatments. In order to make presentation of the results and discussion less of a list and more of a logical categorisation we have grouped treatments into three.
The first group (A) is where researchers seem to have been investigating the absolute effects of the experimental intervention, comparing these treatments with – essentially ‐ placebo. The two comparisons in question happened within the context of ongoing standard care but we could see no reason why meaningful interaction with the standard care would occur.
The second group (B) is a series of five comparisons where the experimental treatment is either a package of care or is given as an adjunct to a form of care that is not standard and even where the underlying treatment is thought of as a relatively simple approach. Differential interaction could have happened enhancing the effects of, for example, CBT or undermining its effects. Such interaction was not discussed in the papers so does not leave us reassured – hence this second grouping.
The final group (C) is a series of six comparisons where differential effects seem to be being explored. These comparisons are comparing two different approaches.
5.1 Group A: absolute effects
5.1.1 Different nutrients/supplements versus alternative medication
Four studies assessed effectiveness of different nutrients/supplements and alternative medication. Two of them involved amino‐acids, D‐serine (Kantrowitz‐USA), and glycine (Woods‐1‐USA), and the other two involved omega‐3 fatty acids (Amminger‐Austria; NEURAPRO‐AAE).
a. Different nutrients/supplements
Kantrowitz‐USA assessed effects of orally administered D‐serine on negative symptoms in participants at high risk for developing psychosis according to SOPS criteria.
The intervention arm of Woods‐1‐USA received glycine. The doses were 0.2 g/kg during the first seven days, followed by 0.4 g/kg until the end of the study.
Participants in Amminger‐Austria received omega‐3 fatty acids (daily dose of capsules containing 700 mg of eicosapentaenoic acid and 500 mg of docosahexaenoic acid) as an active intervention. These were offered over a period of three months.
The active intervention for NEURAPRO‐AAE was combined omega‐3 fatty acids (2.8 g of marine fish oil containing approximately 1.4 g eicosapentaenoic acid/docosahexaenoic acid in 4 x 0.700 g capsules daily with cognitive behavioural case management (sessions of 30 to 60 minutes' duration). Omega‐3 fatty acids and up to 20 sessions of cognitive behavioural case management were administered over the first six months. During the follow‐up period, further sessions of case management were available on a needs‐basis for up to 12 months from study entry.
b. Alternative medication
Kantrowitz‐USA gave matched placebo to the control group. Some of the participants continued taking medication that had been prescribed to them prior to the study (antidepressants, anxiolytics), but the majority (over 60%) did not receive any other psychotropic medication.
The control group in Woods‐1‐USA received placebo. After 12 weeks, all participants from both groups could chose to use open‐label glycine for another 12 weeks.
Control participants in Amminger‐Austria received placebo (coconut oil capsules). Antipsychotic medication and mood stabilisers were not permitted, but participants could receive antidepressants for moderate to severe levels of depression (MADRS score of 21) and benzodiazepines for any one or a combination of anxiety, agitation or insomnia. Also, all participants were offered nine sessions of needs‐based psychological and psychosocial interventions with the research follow‐up interviews.
NEURAPRO‐AAE provided control group participants with placebo capsules (paraffin/coconut oil, tocopherols, a small amount of fish oil) with cognitive behavioural case management in the same amount as in the intervention group. During the first 12 months of the study, antidepressants (selective serotonin reuptake inhibitors (SSRI)) were allowed for moderate to severe depression (MADRS score 21 or above for at least two consecutive weeks; Montgomery 1979) and benzodiazepines for anxiety. Antipsychotics and mood stabilisers were not allowed during the study period (unless the participant was withdrawn).
5.2 Group B: comparisons in which interaction is probable
5.2.1 Antipsychotic drugs
Two included studies assessed efficacy of antipsychotics, alone or in combination with another type of treatment: amisulpiride (LIPS‐Germany), and olanzapine (PRIME‐USA).
LIPS‐Germany used needs‐focused intervention (NFI) with amisulpiride (mean dose 118 mg/day) in the intervention group and NFI only in the control group for prevention of psychosis in the late initial prodromas state that is defined by the presence of attenuated positive symptoms or brief limited intermittent positive symptoms, or both, within the three months preceding the study using Early Recognition Inventory (ERIraos) questionnaire (Maurer 2004). NFI included psychoeducation, crisis intervention, family counselling and assistance with education or work‐related difficulties, according to participants' needs.
The Prevention through Risk Identification Management and Education study (PRIME‐USA) compared olanzapine (5 mg/day to 15 mg/day, mean 8 mg/day) with placebo. During the one‐year treatment period, individual and family psychosocial interventions were available for both groups. In case of agitation or insomnia, or both, lorazepam (max 8 mg/day), diazepam (max 40 mg/day) and chloral hydrate (max 100 mg/day) were allowed. Benztropine mesylate or biperiden (max 6 mg/day) were used to treat extrapyramidal symptoms and nizatidine (300 mg/day to 600 mg/day) for weight gain. Antidepressants were allowed at the time of admission (with a tendency to cut them off), but once a patient was randomised, the initiation of antidepressants was not allowed.
5.2.2 Cognitive behavioural therapy (CBT)
a. CBT plus supportive therapy versus supportive therapy alone
Five included studies are relevant (ADAPT‐Canada; EDIE‐2‐UK; EDIE‐NLEDIE‐UK; EIPS‐Germany).
i. Cognitive behavioural therapy (CBT)
CBT sessions were manualised and time limited, ranging from 20 sessions (ADAPT‐Canada), to 30 sessions (EIPS‐Germany). The sessions were individual therapy sessions. The CBT sessions focused on a combination of psychoeducation, symptom, stress and crisis management, as well as any anxiety, depression, family or occupational problems.
ii. Supportive therapy
Supportive therapy varied between studies. ADAPT‐Canada provided active supportive psychological therapy during the six‐month treatment period. EIPS‐Germany also provided supportive counselling to control participants.
The control group in EDIE‐2‐UK had treatment as usual plus regular monitoring. This provided warm, empathic and non‐judgemental face‐to‐face contact, supportive listening and signposting to appropriate local services for unmet needs and crisis management when required. EDIE‐NL provided the control group with treatment as usual for the mental problems that they were seeking help for (e.g. depression, attention deficit hyperactivity disorder (ADHD) or anxiety disorder). EDIE‐UK monitored the control group without any active psychological intervention. However participants were provided with elements of case management for resolving crises with social issues and mental health risk.
b. CBT plus risperidone versus CBT plus placebo
One study is relevant to this comparison (Yung‐Australia).
i. Cognitive behavioural therapy (CBT)
CBT sessions were manualised and time limited. These sessions were tailored to meet the individual’s needs, to help them to understand and cope with experienced symptoms, enhancing the control of them and reducing associated distress.
ii. Risperidone
The risperidone that was given with the CBT was at a low dose (0.5 mg/day to 2.0 mg/day).
c. CBT (specific preventive intervention) plus needs‐based intervention versus needs‐based intervention
PACE‐Australia randomised patients into two groups: needs‐based intervention (NBI) and specific preventive intervention (SPI).
i. Specific preventive intervention
SPI included manualised CBT and low doses of risperidone (mean dosage 1.3mg/day), along with all elements of NBI.
ii. Needs‐based intervention
NBI comprised supportive psychotherapy primarily focusing on pertinent issues such as social relationships and vocational and family issues. Both groups received case management from a PACE (Playfulness, Acceptance, Curiosity and Empathy) therapist.
5.3 Group C: differential effects
5.3.1 Cognitive behavioural therapy (CBT)
a. CBT versus supportive therapy
One study is relevant to this comparison (Yung‐Australia).
i. Cognitive behavioural therapy (CBT)
CBT sessions were manualised and time limited. These sessions were tailored to meet the individual’s needs, to help them to understand and cope with experienced symptoms, enhancing the control of them and reducing associated distress.
ii. Supportive therapy
This therapy was delivered by the same psychologists who delivered the CBT. The aim of this was to provide the participant with emotional and social support, as well as basic problem solving, stress management, and psychoeducation.
b. CBT plus supportive intervention versus non‐directive reflective listening plus supportive intervention
DEPTh‐Australia compared CBT with non‐directive reflective listening (NDRL).
i. Cognitive behavioural therapy (CBT)
CBT sessions were manualised and time limited. These sessions were tailored to meet the individual’s needs, to help them to understand and cope with experienced symptoms, enhancing the control of them and reducing associated distress.
ii. Supportive therapy
This therapy was delivered by the same psychologists who delivered the CBT. The aim of this was to provide the participant with emotional and social support, as well as basic problem solving, stress management, and psychoeducation.
iii. Non‐directive reflective listening
This is a form of person‐centred counselling in which participants could discuss topics that they chose, while the therapist offered empathic reflections and positive regard. All participants were offered casework (help with accommodation, education and employment) and non‐structured family intervention (brief education and support).
c. CBT plus risperidone versus supportive therapy
One study is relevant to this comparison (Yung‐Australia).
i. Cognitive behavioural therapy (CBT)
CBT sessions were manualised and time limited. These sessions were tailored to meet the individual’s needs, to help them to understand and cope with experienced symptoms, enhancing the control of them and reducing associated distress.
ii. Supportive therapy
This therapy was delivered by the same psychologists who delivered the CBT. The aim of this was to provide the participant with emotional and social support, as well as basic problem solving, stress management, and psychoeducation.
iii. Risperidone
The risperidone that was given with the CBT was at a low dose (0.5 mg/day to 2.0 mg/day).
5.3.2 Cognitive training versus active control
Three included studies compared cognitive training with active control (Choi‐USA; Piskulic‐Canada; Vinogradov‐USA).
a. Cognitive training
Choi‐USA used processing speed training (PST) as the intervention. PST is delivered on tablets and it consists of exercises centred on pupillometric cognitive load, working memory theory, and motivational psychology. During each PST session, participants worked in groups of two or three on tablets for approximately 30 hours over the course of two months (about 3.5 to 4.0 hours per week).
The participants in Piskulic‐Canada took part in Posit Science Brain Fitness Training (PSBFT), a cognitive remediation therapy that involves auditory training exercises. This was delivered online, and activity was monitored via an online monitoring system.
The participants in the intervention group of Vinogradov‐USA were enrolled in an Auditory Training Program (AT). AT consisted of computer exercises for improving speed and accuracy of auditory information processing that were continuously adjusted at adequate difficulty level, with rewards (points and animations) for correct studies. During each session, the participant had four of six exercises (15 minutes per exercise). Compliance was monitored by electronic data upload. Participants were asked to complete 20 to 40 hours of training.
b. Active control
The control group for Choi‐USA participated in active control training (commercial tablet games) in the same dose and duration as the intervention participants.
The control group for Piskulic‐Canada played commercial games (CG). The activity for this was monitored online.
The control group for Vinogradov‐USA participated in a series of available games. During the study, participants received different types of treatment from therapists who were not involved in the study (psychoeducation, psychotherapy, pharmacotherapy if clinically indicated).
5.3.3 Family treatment versus enhanced treatment
Two included studies are relevant (EDIP‐USA and Miklowitz‐USA).
a. Family treatment
EDIP‐USA used family‐aided assertive community treatment (FACT) as the active intervention. FACT was a combination of multifamily psychoeducational group therapy, assertive community treatment, supported education/employment and psychotropic medication.
The active intervention for Miklowitz‐USA was family‐focused treatment (FFT). FFT was an 18‐session training consisting of psychoeducation, communication enhancement, and problem‐solving skills training over six months, focusing on skills for coping with symptoms and improving family communication and problem‐solving.
b. Enhanced treatment
Control participants in EDIP‐USA received enhanced standard treatment (EST). This comprised psychotropic drugs, individual case management, family education and crisis intervention.
Control participants in Miklowitz‐USA had three sessions of psychoeducational treatment for assisting participants and their families in coping with early signs of psychosis. Additional medication was allowed for both participant groups (antipsychotics, antidepressants, mood stabilisers, anxiolytics, psychostimulants).
5.3.4 Integrated treatment versus standard treatment
There is one included study in this comparison (Nordentoft‐Denmark).
a. Integrated treatment
This consisted of Assertive Community Treatment, social skills training (individual or group) and group psychoeducation for patients and their family members.
b. Standard treatment
Standard treatment was treatment as usual within standard mental health services in Copenhagen and Aarhus. Participants were usually offered treatment at a community mental health centre, and were in contact with a physician, community mental health nurse and in some cases a social worker. Visits usually took place once a month. In a small proportion of cases, the standard treatment included psychosocial interventions such as training in social skills or daily living activities, or supportive contacts with the family.
For description of adherence to treatment, see additional Table 14.
1. Adherence table.
| ADAPT‐Canada | Overall the mean number of sessions was 12 (SD = 6.2, range 1–26). 31% (N = 16) received < 7 sessions. Those who left before the 6‐month follow‐up had significantly fewer sessions (5 vs 13.4; T = 7.1, P < 0.0001). |
| Amminger‐Austria | The mean rate for adherence with study medication, based on pill count and self‐report, was 81.4% (SD, 17.7%) in the omega‐3 group and 75.4% (SD, 17.8%) in the placebo group (P = 0.13). |
| Choi‐USA | There was no significant difference in the dosage of training between groups as participants in PST completed 30.32 (SD = 0.92) h versus 30.11 (SD = 0.84) h for ACG (T = 0.94, P = 0.353). As expected, given the structured nature of the programmes at both sites (participants were coming in for a regimen of treatments, usually 2 days/week), treatment intensity between groups was also not significantly different (PST, 3.37 h/week, SD 1.03; ACG, 3.52 h/week, SD 0.94; T 0.60, p. 558). |
| DEPTh‐Australia | The mean number of sessions completed was 9.2 for CBT (3% had no sessions, 17% had 1–5, 47% had 6–11, 30% had 12–26), and 10.1 for NDRL (4% had no sessions, 26% had 1–5, 37% had 6–11, 33% had 12–26). |
| EDIE‐2‐UK | Those allocated to cognitive therapy received a mean of 9.11 (SD 6.69; range 0‐26) sessions, each lasting on average 1 h. Adherence to cognitive therapy was reasonably good, with only 9 of 144 (6.25%) participants not attending any sessions and 108 (75%) receiving at least ≥ 4 sessions. Fidelity to the therapy model was assessed using competency and adherence scales in relation to audio recordings of 80 therapy sessions. 90% of rated sessions scored over the threshold for competency and 93.3% met the criteria for therapy that adhered to the manual. |
| EDIE‐NL | Not reported |
| EDIE‐UK | Not reported |
| EDIP‐USA | Not reported |
| EIPS‐Germany | After randomisation, 2 participants from the IPI group and 1 from the SC group failed to attend any treatment sessions. In the IPI group 22 (33.8%) of participants received < 50% of treatment (< 20 sessions) and in the SC group 20 (31.7%) participants received < 50% of treatment (< 13 sessions), but there were no statistical differences between the number of these participants (Chi2 = 0.003, P = 0.956). Mean number of sessions for the SC group was 15.8 ± 6.8 and for the IPI group 23.7 ± 13.1, therefore participants from the SC group received significantly less treatment (P < 0.001). |
| Kantrowitz‐USA | Not reported |
| LIPS‐Germany | Not reported |
| Miklowitz‐USA | The average number of sessions in the FFT group was 11.0 ± 7.1 (range 0–19) sessions and 42 (63.6%) participants took part in at least 1 session of communication or problem‐solving skills training. Out of 66 participants in this group, 18 received < 50% of sessions (9 sessions) and 37 > 9 sessions. The rest dropped out before the first session. In the enhanced care group, average number of sessions was 2.4 ± 1.2 sessions (range 0–4) and 50 (79.4%) took part in most or all (2–3 sessions) of the psychoeducational training. Out of 63 participants in this group, 5 received < 50% of sessions (1 session) and 48 received > 50% of sessions (2‐3 sessions). Participants in both FFT and enhanced treatment groups were equally likely to obtain extra‐protocol individual or group therapy sessions (34.5% and 36.2%; 2(1) = 03, P = 0.86). |
| NEURAPRO‐AAE | There were 66 adherent participants (43.1%) in the omega‐3 PUFA group and 62 in the placebo group (41.1%). Participants who had missing data for the capsule counts (N = 35 in omega‐3 fatty acids group and 48 in placebo group) were considered as non‐adherent. The overall median number of CBCM sessions attended was 8 (range, 1‐35), in omega‐3 fatty acids group 11.2 ± 6.4 and 10.3 ± 6.0 in placebo group. The transition rate was lower in the adherent participants, but without significant difference. There was no significant difference between groups in transition rates for those with a number of CBCM sessions ≤ median (P = 0.31), as well as for those > median (P = 0.50). |
| Nordentoft‐Denmark | Not reported |
| PACE‐Australia | Variable adherence to risperidone was reported; in the SPI group (N = 31), 13 participants were classified as nonadherent (< 50% doses taken), 4 as partially adherent, and 14 as fully adherent (almost 100% doses taken). |
| Piskulic‐Canada | Half of all participants completed between 2 and 4 training sessions/week, the other half failed to reach the target, completing 42 sessions on any given week. On average, participants across both groups completed 20 training sessions (SD = 13.5 sessions) and 50% of all participants completed between 20 and 40 training sessions (N = 7 in Post Science Brain Fitness group and N = 9 in control treatment group) in 12 weeks. |
| PRIME‐USA | Not reported |
| Vinogradov‐USA | Not reported |
| Woods‐1‐USA | Quote: "Two placebo subjects missed one or more rating visits", no other data |
| Yung‐Australia | Poor therapy adherence (only 2 participants (4.7%) had full adherence to risperidone). Problems with therapy supervision (only 24 of 41 tapes from the cognitive therapy groups (58.5%) were classified as receiving cognitive therapy, 9 participants (22.0%) allocated to cognitive therapy were judged to be receiving supportive therapy, and, in a further 8 cases (19.5%), the nature of the psychological therapy was rated as not known). |
| ACG: active control group; CBCM: cognitive behavioural case management; CBT: cognitive behavioural therapy; FFT: family‐focused treatment IPI: integrated psychological intervention; NDRL: non‐directive reflective listening; PST: processing speed training; SC: supportive counselling; SD: standard deviation; SPI: specific preventive intervention | |
6. Outcomes
6.1 Non‐scale data
We were able to report dichotomous data on leaving the study early, transition to psychosis and adverse effects.
6.2 Scale‐derived data
We have only shown details of the outcome scales that provided usable data below and we have given reasons for exclusions of data under 'Outcomes' in Characteristics of included studies.
6.2.1 Global state
a. Clinical Global Impression (CGI; Guy 1976)
The CGI is a brief observer‐rated scale consisting of Severity scale (CGI‐S) and Improvement scale (CGI‐I). Both CGI‐S and CGI‐I are seven‐point scales rating the severity or improvement of the patient's illness at the time of assessment. Higher scores represent higher severity and worsening of the illness (1: normal or very much improved; 7: among the most severely ill or very much worse since the initiation of treatment). Scores range from 2 to 14. PRIME‐USA reported data from this scale.
b. Personal Beliefs about Illness Questionnaire (PBIQ; Birchwood 1993)
PBIQ is a 16‐item scale originally developed to assess five constructs related to people’s appraisals of their psychotic illness: control over illness, self as illness, illness as an impediment to the attainment of goals, humiliation and guilt, and need for social containment. Personal Beliefs about Illness Questionnaire ‐ Revised (PBIQ‐R; Birchwood 2012), is a 29‐item scale, designed to measure five different categories of emotion/appraisal following a psychotic illness: shame (six items); loss (seven items); entrapment (six items); control over illness (five items), and social marginalisation/group fit (five items). The scale was designed to measure both stigma‐ and social rank‐based variables. EDIE‐NL reported data from this scale. An adapted version of PBIQ, Personal Beliefs about Experiences Questionnaire (PBEQ; Pyle 2015) is a 13‐item, self‐report questionnaire. Each item reflects social and cultural beliefs/stereotypes about psychosis. Participants rate the degree to which they endorse statements to be true about themselves on a four‐point scale. EDIE‐2‐UK reported data from PBEQ (please see Appendix 1).
6.2.2 Mental state
a. Brief Psychopathological Rating Scale (BPRS; Overall 1962)
The BPRS is a scale used for assessment of positive symptoms, general psychopathology and affective symptoms. The original scale has 16 items, but a revised scale consisting of 18 items is commonly used. Each item is rated from 0 (not present) to 7 (extremely severe), with total scores ranging from 0 to 126 (higher scores meaning more severe symptoms). PACE‐Australia and Yung‐Australia reported data from this scale, while NEURAPRO‐AAE reported data for psychotic subscale (please see Appendix 1).
b. Positive and Negative Symptom Scale (PANSS; Kay 1987)
The PANSS is used for evaluation of positive, negative and other symptom dimensions in schizophrenia. The scale consists of 30 items divided into three subscales: positive (PANSS P), negative (PANSS N) and general (PANSS G) symptoms. Each item is rated on a seven‐point scoring system, higher levels meaning more severity of symptoms. Scores range from 30 to 210. Amminger‐Austria, EIPS‐Germany, LIPS‐Germany and PRIME‐USA reported data from the PANSS.
c. Scale for the Assessment of Negative Symptoms (SANS; Andreasen 1983)
SANS is an observer‐rated, 26‐item scale for measuring the severity of negative symptoms of schizophrenia across five domains (alogia, affective blunting, avolition‐apathy, anhedonia‐asociality, attention impairment). Items are rated on a six‐point scale from 0 to 5, with higher scores indicating more severe symptoms. NEURAPRO‐AAE, Nordentoft‐Denmark, PACE‐Australia and Yung‐Australia reported data from this scale (please see Appendix 1).
d. Comprehensive Assessment of At‐Risk Mental States (CAARMS; Yung 2005)
This is a semi‐structured interview designed to identify people who meet criteria for at‐risk mental state. Rater assesses symptoms, frequency and distress under these categories: disorders of thought content; perceptual abnormalities; conceptual disorganisation; motor changes; concentration and attention; emotion and affect; subjectively impaired energy; and impaired tolerance to normal stress. DEPTh‐Australia, EDIE‐2‐UK and EDIE‐NL reported data for this scale (please see Appendix 1).
e. Scale of Psychotic Symptoms (SOPS; Miller 1999)
The SOPS is a 19‐item scale designed according to the PANSS scale to measure the severity of prodromal symptoms. It consists of five positive symptom items (unusual thought content/delusional ideas, suspiciousness/persecutory ideas, grandiosity, perceptual abnormalities/hallucinations, disorganised communication), six negative symptom items (social anhedonia, avolition, expression of emotion, experience of emotions and self, ideational richness, occupational functioning), four disorganisational symptoms items (odd behavior and appearance, bizarre thinking, trouble with focus and attention, personal hygiene) and four general symptom items (sleep disturbance, dysphoric mood, motor disturbances, impaired tolerance to normal stress). Each item is rated on a seven‐point scale from 0 (never, absent) to 6 (severe/extreme ‐ and psychotic for the positive items), total scores ranging from 0 to 114. ADAPT‐Canada, PRIME‐USA, Vinogradov‐USA and Woods‐1‐USA reported data from SOPS, while Miklowitz‐USA reported data for SOPS positive symptoms.
f. Hamilton Rating Scale for Anxiety (HRSA; Hamilton 1959)
Hamilton Rating Scale for Anxiety (HRSA) is one of the first rating scales developed to quantify the severity of anxiety symptoms. HAMA consists of 14 items, each defined by a series of symptoms. The 14 items consist of: anxious mood; tension; fears; insomnia; intellectual; depressed mood; somatic complaints (muscular); somatic complaints (sensory); cardiovascular symptoms; respiratory symptoms; gastrointestinal symptoms; genitourinary symptoms; autonomic symptoms and behaviour at Interview. Each item is rated on a five‐point scale, from 0 (not present) to 4 (severe). Total score range is between 0 an 56, with higher score indicating more severe symptoms. PACE‐Australia reported data from this scale.
g. Hamilton Rating Scale for Depression (HRSD; Hamilton 1960)
This is an observer‐rated scale, designed to rate the severity of depression by probing mood, feelings of guilt, suicide ideation, insomnia, interest, agitation or retardation, anxiety (psychic and somatic), weight loss, somatic symptoms and insight. It consists of 17 variables measured on either a three‐point or a five‐point rating scale. A score of 0 to 7 is considered to be normal, higher scores indicate depression (mild, moderate, severe, very severe). PACE‐Australia reported data from this scale.
h. Calgary Depression Scale for Schizophrenia (CDSS; Addington 1990)
The CDSS is a nine‐item scale (0 = absent; 1 = mild; 2 = moderate; 3 = severe) that was specifically developed for assessment of depression in people with schizophrenia, independent of the negative symptoms. It has been evaluated in both relapsed and remitted patients, and is provided as a semi‐structured interview. High scores indicate worse outcome. ADAPT‐Canada and EDIE‐NL reported data from this scale.
i. Montgomery Asberg Depression Rating Scale (MADRS; Montgomery 1979)
MADRS is a scale designed for assessment of depressive symptoms through 10 items (apparent sadness, reported sadness, inner tension, reduced sleep, reduced appetite, concentration difficulties, lassitude, inability to feel, pessimistic thoughts, suicidal thoughts). Each item is rated on a seven‐point scale from 0 to 6. Higher scores indicate more severe symptoms. Total scores range from 0 to 60, results from 0 to 6 are considered as normal/symptom absent. Amminger‐Austria, EIPS‐Germany, LIPS‐Germany, NEURAPRO‐AAE, PRIME‐USA and Woods‐1‐USA used this scale.
j. Beck Depression Inventory (BDI; Beck 1961)
This is a 21‐item self‐rating scale for assessment of presence and severity of depressive symptoms over the last week. Each item comprises four statements (rated 0 to 4). The score ranges from 0 to 63, higher scores meaning more severe depression. Choi‐USA used a revised version of BDI, BDI‐II (Beck 1996), while EDIE‐NL used the Dutch translation of the Beck Depression Inventory second edition, BDI‐II‐NL (Van der Does 2002). A shorter version of BDI, BDI‐PC (Winter 1999), is comprised of seven items that are related to depressive symptoms, each rated on a four‐point scale (0 to 3). The BDI‐PC is scored by adding the ratings for each item to produce a total score, with a range of 0 to 21. EDIE‐2‐UK reported data from this scale.
k. Young Mania Scale (YMS; Young 1978)
YMS is an interviewer‐rated, 11‐item scale designed for assessment of symptoms of mania. Seven items are graded on a 0 to 4 scale, but four items are graded on a 0 to 8 scale (irritability, speech, thought content, and disruptive/aggressive behaviour). Higher scores indicate more severe manic symptoms. NEURAPRO‐AAE, PACE‐Australia and PRIME‐USA reported data from this scale.
l. Social Interaction and Anxiety Scale (SIAS; Mattick 1998)
The SIAS is a 20‐item questionnaire designed to measure levels of fear in social interaction situations. Each item is rated on a five‐point Likert scale (0 to 5). Total scores range from 0 to 80, higher scores reflecting more severe social anxiety. ADAPT‐Canada, EDIE‐2‐UK and EDIE‐NL reported data from this scale.
m. The Social Phobia Scale (SPS; Mattick 1998)
The SPS is a 20‐item questionnaire for assessment of fear of being observed or scrutinised by others during routine activities, e.g. eating, writing, speaking in public. Each item is rated from 0 to 4 (all items are negatively worded), total scores ranging from 0 to 80. ADAPT‐Canada reported data from this scale.
n. The Social Anxiety Scale for Adolescents (SAS‐A; La Greca 1993)
SAS‐A is a clinician‐rated scale for assessing social function specific to the fear of negative evaluation by peers, social avoidance, and social response to new situations. It contains 18 items rated on a five‐point scale ranging from 1 (not at all) to 5 (all the time), with total scores from 18 to 90 (higher scores indicating more anxiety and poorer relations). Choi‐USA reported data from this scale.
o. The Brief Symptom Inventory (BSI; Derogatis 1995)
The BSI is a psychological self‐report symptom scale consisting of 53 items divided into nine primary symptom dimensions: somatisation, obsessive‐compulsive, interpersonal sensitivity, depression, anxiety, hostility, phobic anxiety, paranoid ideation and psychoticism. Each item of the BSI is rated on a five‐point scale of distress (0 to 4), ranging from 'not‐at‐all' to 'extremely'. DEPTh‐Australia reported data from this scale (please see Appendix 1).
p. The Scale for the Assessment of Positive Symptoms (SAPS; Andreasen 1984)
The SAPS is a rating scale developed for the assessment of positive symptoms in schizophrenia. It consists of four domains: hallucinations; delusion;, bizarre behaviour; and positive formal thought disorder. Within each domain, symptoms are rated from 0 (absent) to 5 (severe). Nordentoft‐Denmark reported data from this scale (please see Appendix 1).
q. The Early Recognition Inventory (ERIraos; Maurer 2004)
The ERIraos is a comprehensive early‐recognition inventory developed on an empirical basis as an extension of the Retrospective Assessment of the Onset and course of Schizophrenia and Other Psychoses (IRAOS; Häfner 1992). The psychopathological section comprises a symptom list with 110 items structured in 12 sections. Each item score ranges from 0 to 3. LIPS‐Germany used the ERIraos. Basic and Positive Psychotic Spectrum Symptoms score (ERI–BAPPSS score) used to assess treatment effects, was formed of the 16 items related to full‐blown psychotic symptoms (including disorganised thinking and behaviour), six items assessing attenuated positive symptoms and 10 items assessing a set of basic symptoms. Data were reported for two ERI–BAPPSS subscores, ERI–PPS score (the attenuated and full‐blown psychotic positive symptoms) and ERI–BS (the basic symptoms) (please see Appendix 1).
r. Cognitive tests
Woods‐1‐USA used various tests for neuropsychological assessment of processing speed, verbal memory, executive functioning, semantic (category) fluency, phonemic fluency, attention and working memory. Data were reported for the following tests: Trails B (Reitan 1985), Stroop Color Word Test (Golden 1978), Auditory Verbal Learning Task (AVLT; Rey 1964),Wisconsin Card Sort Test (WCS; Heaton 1993), semantic (category) fluency (Spreen 1998), Controlled Oral Word Association (FAS) Test of phonemic fluency (Spreen 1969), Letter‐number sequencing (Gold 1997) and Trails A (Reitan 1985).
Piskulic‐Canada used modified battery of MATRICS measures (Neuchterlein 2008), consisting of nine subtests for measuring neurocognitive functioning in the following domains: processing speed; attention/vigilance; working memory; verbal learning; visual learning; and reasoning and problem solving.
Choi‐USA used neurocognitive tests for assessment of processing speed (Wechsler Adult Intelligence Scale‐Third Edition (WAIS‐III) Digit Symbol‐Coding subtest (Wechsler 1999), and The Minnesota Clerical Test (MCT; Andrew 1979).
6.2.3 Functioning
a. Global Assessment of Functioning (GAF; APA 1994)
This is an observer‐rated scale for measuring social, occupational and psychological functioning (impairment). Scores range from 100 (extremely high functioning) to 1 (inadequate information). ADAPT‐Canada, Amminger‐Austria, DEPTh‐Australia, EDIE‐2‐UK, EDIP‐USA, LIPS‐Germany, Miklowitz‐USA, PACE‐Australia, PRIME‐USA and Yung‐Australia reported data from this scale.
b. The Global Functioning: Social and Role scales (Cornblatt 2007b)
The Global Functioning: Social (GFS) and Global Functioning: Role (GFR) scales were designed to distinguish social from role functioning and to detect functional changes over time, taking account the age and the phase of illness. Each scale consists of 10 items, with scores ranging between 1 (severe dysfunction) and 10 (superior functioning). Also, both scales generate three scores: lowest level of functioning in the past month (i.e. current functioning), and lowest and highest level of functioning reported over the past year. Miklowitz‐USA, NEURAPRO‐AAE, Piskulic‐Canada and Vinogradov‐USA reported data from these scales.
c. Social Functioning Scale‐II (SAS‐II; Schooler 1979)
The SAS‐II is an interviewer‐rated scale containing 52 questions for assessment of current functioning: work role; relationship with a "principal household member"; sexual adjustment; romantic involvement; parental role; extended family relationships; social leisure activities; and personal well‐being. Each item is rated from 1 to 5, with higher scores indicating worse functioning. EIPS‐Germany reported data from this scale (for subscores, please see Appendix 1).
d. Social Functioning Scale‐Self report (SAS‐SR; Weissman 1976)
SAS‐SR is self‐administered version of the Social Adjustment Scale (SAS; Weissman 1976), commonly used to assess social adjustment in children and adolescents. It contains 54 items that measure performance in occupational role, social and leisure activities, relationship with extended family, marital role, parental role, family unit, and economic independence. The form is scored on a five‐point scale, higher scores indicating greater impairment. Choi‐USA reported data from this scale.
e. Social and Occupational Functioning Assessment Scale (SOFAS; Goldman 1992)
The SOFAS is an instrument for assessment of social or occupational functioning, or both, independent of the overall severity of the illness. To be counted, impairment must be a direct consequence of mental and physical health problems. The rating scores range from 0 (inadequate information) to 100 (superior functioning). DEPTh‐Australia, EDIE‐NL and NEURAPRO‐AAE reported data from this scale.
f. The Social Functioning Scale (SFS; Birchwood 1990).
Social Functioning Scale, SFS is a 79‐item questionnaire, developed for assessing functioning and performance in seven areas: social engagement/withdrawal (time spent alone, initiation of conversations, social avoidance); interpersonal communication (number of friends, heterosexual contact, quality of communication); recreational activities (engagement in a range of common social activities, e.g. sport); social activities (engagement in a range of common hobbies, interests, pastimes etc.); independence competence (ability to perform skills necessary for independent living); independence performance (performance of skills necessary for independent living); and occupational activity (engagement in productive employment or structured programme of daily activity). Total score ranges between 55 and 145 points, with higher scores indicating better functioning. ADAPT‐Canada reported data from this scale.
6.2.4 Adverse effects
a. Simpson Angus Scale (SAS; Simpson 1970)
The SAS is a 10‐item scale used to evaluate the presence and severity of extrapyramidal side effects. The items are gait, arm dropping, shoulder shaking, elbow rigidity, wrist rigidity, leg pendulousness, head dropping, glabella tap, tremor and salivation. The 10 items focus on rigidity rather than bradykinesia and do not assess subjective rigidity or slowness. Each item is rated on a five‐point scale, from 0 (complete absence of condition) to 4 (presence of condition in extreme), higher scores indicating higher levels of side effects. PRIME‐USA reported data from this scale.
b. Barnes Akathisia Rating Scale (BAS; Barnes 1989)
BAS is a four‐item scale to assess the presence and severity of drug‐induced movement disorder akathisia. Items include restless movements, the subjective awareness of restlessness, distress associated with the condition, and the global severity. Three items are rated on a four‐point scale and one on a six‐point scale, higher scores meaning more severe‐level akathisia. PRIME‐USA reported data from this scale.
c. Abnormal Involuntary Movement Scale (AIMS; Guy 1976b)
AIMS is a scale designed to assess abnormal involuntary movements associated with antipsychotic drugs, such as tardive dyskinesia and chronic akathisia, as well as 'spontaneous' motor disturbance related to the illness itself. Scoring consists of rating movement severity in the anatomical areas (facial/oral, extremities, trunk). Each item is rated on a five‐point scale from 0 to 4, with higher scores indicating higher levels of abnormal movements. PRIME‐USA reported data from this scale.
d. Extrapyramidal Symptom Rating Scale (ESRS; Chouinard 1980)
The ESRS consists of four subscales (subjective examination questionnaire, examination of parkinsonism and akathisia, dystonia, dyskinesia) and four clinical global impression severity scales (tardive dyskinesia, parkinsonism, dystonia and akathisia). The subjective examination (subscale I of the ESRS) is rated on a four‐point scale (higher scores meaning more severe symptoms). Tremors, rigidity dystonic and dyskinetic movements are rated for each body part as separate terms on a seven‐point scale from 0 (absent) to 6 (most severe). LIPS‐Germany reported data from this scale.
e. Side Effect Rating Scale (UKU; Lingjærde 1987)
UKU is an observer‐rated, semi‐structured interview for assessment of side effects divided into four categories: psychic, neurologic, autonomic and other. Each of the 48 items is rated on a four‐point scale, from 0 to 3, a higher score meaning more severe side effects. UKU takes into account global assessment of the interference by existing side effects with the patient's daily performance and the consequence of it, as well as possible interactions with administered drugs. Amminger‐Austria, LIPS‐Germany and Yung‐Australia reported data from this scale.
f. Systematic Assessment For Treatment Emergent Adverse Events (SAFTEE; Levine 1986)
The SAFTEE is designed for assessment of safety and adverse effects. The SAFTEE has two forms, a General Inquiry (GI) and a Specific Inquiry (SI) form. GI is an open‐ended form about any physical or health problems and their impact on functioning. SI is a detailed and systematic inquiry including 78 adverse effects divided into 23 categories corresponding to organ systems or body parts. Woods‐1‐USA reported data using SAFTEE.
6.2.5. Quality of life
a. Quality of Life Scale; (QLS; Heinrichs 1984)
QLS is a semi‐structured interview administered and rated by trained clinicians. The 21 items are rated on a seven‐point scale based on the interviewer's judgement of patient functioning. Higher scores indicate better quality of life. Scores range from 0 to 126. DEPTh‐Australia, PACE‐Australia and Yung‐Australia reported data from this scale (please also see Appendix 1).
b. Manchester Short Assessment of Quality of Life; (MANSA; Priebe 1999)
MANSA is a brief instrument for assessing quality of life focusing on satisfaction with life as a whole and with life domains. This self‐report questionnaire contains 16 items, which are rated on a seven‐point scale, higher scores meaning better quality of life. Scores range from 16 to 112. EDIE‐NL reported data from this questionnaire.
6.3 Redundant data
Some studies reported data only as P values or statements of significant or non‐significant differences, and we could not extract other continuous data because the number of participants was missing or they had not reported standard deviations.
6.4. Missing data
Ten of the included studies had missing outcomes that they had planned in the registered protocol or indicated in the methods section of the manuscript. These were: ADAPT‐Canada (part of the mental state and physical questionnaires/scales, cost‐effectiveness report); Choi‐USA (2 specific cognitive tests); EDIE‐2‐UK (part of the mental state questionnaires/scales, cost‐effectiveness report); EDIE‐NL (a questionnaire for quality of life and cognitive test for verbal fluency); EDIP‐USA (transition to psychosis after 60 months); LIPS‐Germany (part of the mental state/functioning/adverse events questionnaire/scales); Miklowitz‐USA (mental scale score after one year); Nordentoft‐Denmark (treatment satisfaction/compliance/adherence and suicidal behaviour); PRIME‐USA (quality of life questionnaire); and Woods‐1‐USA (multiple outcomes reported for only one participant). We did not find missing outcomes for other studies.
Excluded studies
There are currently 29 excluded studies. We have summarized the reasons for excluding the studies in the following table:
| Totals | Randomisation | Reasons | Totals | Studies |
| 29 | Randomised | Not UHR sample | 17 | Berry‐USA, Biagianti‐USA, Capra‐Australia, CHANGSHA‐USA, Chien‐Hong Kong, Cordes‐Germany, Holzer‐Switzerland, Koren‐Israel, LEGS‐USA, LEO CAT‐UK, LEO‐UK, Leweke‐Germany, OPUS‐Denmark, RAISE‐ETP‐USA, Ramsay‐USA, Schmechtig‐USA, Uher‐Canada |
| Terminated early | 4 | Heresco‐Levy‐Israel, NEURAPRO‐Q‐Australia, Piskulic‐2‐Canada, RAP‐USA | ||
| Different outcomes | 1 | O'Neill‐UK | ||
| Not randomised | 7 | Berger‐Australia, EDIPP‐USA, EPIP‐Singapoure, Keri‐Hungary, Lewis‐USA, Woods‐2‐USA, Vadhan‐USA | ||
Reasons for exclusion of each study are described in Characteristics of excluded studies tables.
Awaiting classification
Seven studies are awaiting assessment (see descriptions in Characteristics of studies awaiting classification table). For three of them published data are not usable for analysis and the other four require further clarification. Ultimately, we will exclude studies where data are unobtainable.
Ongoing studies
We are awaiting data from 17 studies (see descriptions in Characteristics of ongoing studies table). This is an active area for research.
Risk of bias in included studies
Overview of risk of bias in included studies is illustrated in Figure 1 and across different domains of risk of bias in Figure 2.
Allocation
The authors of all 20 included studies described them as randomised. Eight studies adequately described the process of generating a random sequence using a computer or web‐based resources (Amminger‐Austria; DEPTh‐Australia; EDIE‐2‐UK; EDIE‐NL; EIPS‐Germany; NEURAPRO‐AAE; Nordentoft‐Denmark), or minimisation (ADAPT‐Canada), so we judged it at low risk of bias. In other studies method for generating random sequence was not described, so we judged them at unclear risk of bias.
Allocation concealment was adequately described in only one study (Kantrowitz‐USA), so we judged it at low risk of bias. In the remaining studies allocation concealment was either not described or only briefly commented on and we were unable to determine in these instances if concealment was adequate, so we judged them at unclear risk of bias.
Blinding
Eight studies used the double‐blind design, blinding both participants and clinicians (Amminger‐Austria; Choi‐USA; Kantrowitz‐USA; NEURAPRO‐AAE; PRIME‐USA; Vinogradov‐USA; Woods‐1‐USA; Yung‐Australia), so we judged them at low risk of bias.
Nine studies blinded clinicians, but not participants (ADAPT‐Canada; DEPTh‐Australia; EDIE‐2‐UK; EDIE‐NL; EDIE‐UK (intended to be blind, but it was difficult in practice) EDIP‐USA; Miklowitz‐USA; PACE‐Australia; Piskulic‐Canada). Two studies did not blind either participants or clinicians (LIPS‐Germany; Nordentoft‐Denmark). One study did not provide information about blinding of participants and personnel in the manuscript (EIPS‐Germany), but in the study protocol published online it was indicated that there was no masking, that the study was open‐label. We judged all of these studies at high risk of bias.
In eleven studies, raters or attending psychiatrists were blind to the outcome assessments (ADAPT‐Canada; Amminger‐Austria; Choi‐USA; DEPTh‐Australia; EDIE‐NL; EDIP‐USA; NEURAPRO‐AAE; Piskulic‐Canada; PRIME‐USA; Vinogradov‐USA; Yung‐Australia), so we judged them at low risk of bias.
In six studies assessors were not kept blind to outcome assessments (EDIE‐UK intended the raters to be blind, but it was difficult in practice; EIPS‐Germany; LIPS‐Germany; Miklowitz‐USA; Nordentoft‐Denmark; PACE‐Australia), so we judged them at high risk of bias.
In two studies the process regarding blinding of outcome assessors was unclear (Kantrowitz‐USA; Woods‐1‐USA) and in one study blinding breaks were reported in a minority of participants (EDIE‐2‐UK), so we judged these three studies at unclear risk of bias.
Incomplete outcome data
We judged six studies as having low risk of attrition bias because they had attrition under 30% and clearly reported reasons for attrition (Amminger‐Austria; EDIE‐NL; Miklowitz‐USA; NEURAPRO‐AAE; PACE‐Australia; Woods‐1‐USA). We judged eight studies as having unclear risk of attrition bias; two studies had attrition under 30%, but reasons for attrition were unclear (Choi‐USA; Nordentoft‐Denmark), and the other six studies had attrition between 30% and 50% (ADAPT‐Canada; EDIP‐USA; EIPS‐Germany; LIPS‐Germany; Vinogradov‐USA; Yung‐Australia). We judged six studies with high risk of attrition bias because the attrition was above 50% (DEPTh‐Australia; EDIE‐2‐UK; EDIE‐UK; Kantrowitz‐USA; Piskulic‐Canada; PRIME‐USA).
Selective reporting
We found selective reporting in 10 studies, as they did not report in their results all the outcomes that were planned in the registered protocol, or indicated in the methods section of the manuscript if the study protocol registration was not mentioned (ADAPT‐Canada; Choi‐USA; EDIE‐2‐UK; EDIE‐NL; EDIP‐USA; LIPS‐Germany; Miklowitz‐USA; Nordentoft‐Denmark; PRIME‐USA; Woods‐1‐USA); we judged them at unclear risk of bias. We did not identify overt under‐reporting of outcomes in the other included studies so we judged them at low risk of bias, although we did not have access to study protocols to check whether they had recorded other data but not reported them in the final papers.
Other potential sources of bias
We did not find other potential sources of bias in the included studies.
Effects of interventions
See: Table 1; Table 2; Table 3; Table 4; Table 5; Table 6; Table 7; Table 8; Table 9; Table 10; Table 11; Table 12; Table 13
For this review we generated 13 comparisons. In total there are 20 relevant randomised studies. As stated above in Description of studies, we loosely categorised comparisons into three. Group A comparisons explored the absolute effects of the experimental intervention. Group B was a series of comparisons (further subdivided into antipsychotic and CBT) within which we could not be clear whether differential interactive effects were also ongoing in each intervention group. For example it is not clear, for Comparison 5, whether the supportive therapy's effect is changed by being accompanied by the CBT. The combination may be interactive making this comparison more like those in Group C rather than Group A. Group C comparisons explore differential effects between clearly distinct treatments. Again we have subdivided these again into CBT treatments and several others.
Group A: absolute effects
1. Comparison: amino acids versus placebo
This comparison has 10 outcomes.
1.1 Prodromal symptoms: transition to psychosis, end point data
We identified two studies relevant to this outcome, the data from which we divided into two subgroups, with a total of 52 participants. There was no clear difference between amino acids and placebo (RR 0.48, 95% CI 0.08 to 2.98; Analysis 1.1).
1.1. Analysis.

Comparison 1 Group A: amino acids vs placebo, Outcome 1 Prodromal symptoms: transition to psychosis, endpoint data.
1.1.1 Short‐term (16 weeks, D‐serine)
We found one study to be relevant to this subgroup (44 participants). For this subgroup, we did not find evidence of a clear difference between the two treatments (RR 0.60, 95% CI 0.06 to 6.14; Analysis 1.1).
1.1.2 Short‐term (24 weeks, glycine)
We found one study to be relevant to this subgroup (8 participants). There was no clear difference between amino acids and placebo within this subgroup (RR 0.33, 95% CI 0.02 to 6.37; Analysis 1.1).
1.2 Mental state 1 specific: psychosis risk symptoms, average total score, short‐term (at 8 weeks), SOPS (higher score = worse)
We identified one study relevant to this outcome and categorised data into five subgroups.
1.2.1 Total score
There is a single study in this subgroup (8 participants). For this subgroup, we did not find evidence of a clear difference between the two treatments (MD −10.00, 95% CI −22.38 to 2.38; Analysis 1.2).
1.2. Analysis.

Comparison 1 Group A: amino acids vs placebo, Outcome 2 Mental state 1: specific, psychosis risk symptoms, average total score, short‐term (at 8 weeks), SOPS (higher score = worse).
1.2.2 Positive score
There is a single study in this subgroup (8 participants). For this subgroup, we did not find evidence of a clear difference between the two treatments (MD −2.50, 95% CI −7.86 to 2.86; Analysis 1.2).
1.2.3 Negative score
There is a single study in this subgroup (8 participants). There was no clear difference between amino acids and placebo within this subgroup (MD −1.80, 95% CI −4.88 to 1.28; Analysis 1.2).
1.2.4 Disorganisation score
There is a single study in this subgroup (8 participants). For this subgroup, we did not find evidence of a clear difference between the two treatments (MD 1.00, 95% CI −1.57 to 3.57; Analysis 1.2).
1.2.5 General score
We found one study relevant to this subgroup (8 participants). For this outcome, within this subgroup, we did find evidence that amino acids were clearly superior compared with placebo (MD −6.80, 95% CI −9.47 to −4.13; Analysis 1.2).
1.3 Mental state 2, specific: depression, average total score, short‐term (at 8 weeks), MADRS (higher score = worse) skewed data
These continuous data, from a single study, had such large standard deviations as to suggest that analysis within Review Manager 2014 would be inadvisable (please see Analysis 1.3).
1.3. Analysis.
Comparison 1 Group A: amino acids vs placebo, Outcome 3 Mental state 2 specific: depression, average total score, short‐term (at 8 weeks), MADRS (higher score = worse), skewed data.
| Mental state 2 specific: depression, average total score, short‐term (at 8 weeks), MADRS (higher score = worse), skewed data | |||||
|---|---|---|---|---|---|
| Study | Intervention | Mean | SD | N | Note |
| Woods‐1‐USA | Amino acids | 7.2 | 4 | 4 | |
| Woods‐1‐USA | Placebo | 14 | 4.9 | 3 | |
1.4 Mental state 3.a, specific: cognitive symptoms, average total score, short‐term (at 12 weeks), various tests (higher score = better)
For this outcome we found a single study and categorised data into five subgroups.
1.4.1 Immediate verbal memory (AVLT immediate studies sum)
There is a single study in this subgroup (5 participants). There was no clear difference between amino acids and placebo within this subgroup (MD 6.50, 95% CI −2.15 to 15.15; Analysis 1.4).
1.4. Analysis.
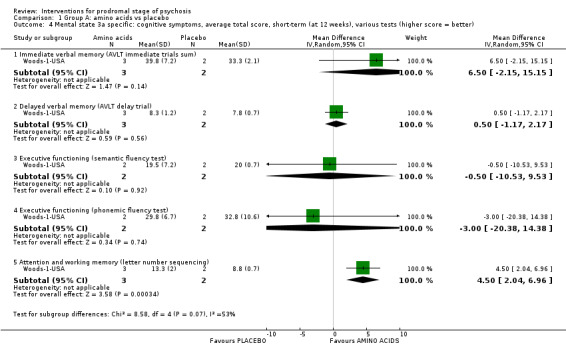
Comparison 1 Group A: amino acids vs placebo, Outcome 4 Mental state 3a specific: cognitive symptoms, average total score, short‐term (at 12 weeks), various tests (higher score = better).
1.4.2 Delayed verbal memory (AVLT delay trial)
We found one study to be relevant to this subgroup (5 participants). For this subgroup, we did not find evidence of a clear difference between the two treatments (MD 0.50, 95% CI −1.17 to 2.17; Analysis 1.4).
1.4.3 Executive functioning (semantic fluency test)
We found one study to be relevant to this subgroup (4 participants). There was no clear difference between amino acids and placebo within this subgroup (MD −0.50, 95% CI −10.53 to 9.53; Analysis 1.4).
1.4.4 Executive functioning (phonemic fluency test)
We found one study to be relevant to this subgroup (4 participants). There was no clear difference between amino acids and placebo within this subgroup (MD −3.00, 95% CI −20.38 to 14.38; Analysis 1.4).
1.4.5 Attention and working memory (letter‐number sequencing)
There is a single study in this subgroup (5 participants). For this outcome, within this subgroup, we found evidence that amino acids were clearly superior in their effects compared with placebo (MD 4.50, 95% CI 2.04 to 6.96; Analysis 1.4).
1.5 Mental state 3.b, specific: cognitive symptoms, average total score, short‐term (at 12 weeks), various tests (higher score = worse)
For this outcome we found a single study, the data from which we divided into six subgroups.
1.5.1 Processing speed (Trails A)
There is a single study in this subgroup (4 participants). There was no clear difference between amino acids and placebo within this subgroup (MD 8.80, 95% CI −8.57 to 26.17; Analysis 1.5).
1.5. Analysis.

Comparison 1 Group A: amino acids vs placebo, Outcome 5 Mental state 3b specific: cognitive symptoms, average total score, short‐term (at 12 weeks), various tests (higher score = worse).
1.5.2 Attention and working memory (Trails B)
There is a single study in this subgroup (4 participants). For this subgroup, we did not find evidence of a clear difference between the two treatments (MD −2.80, 95% CI −48.7 to 43.10; Analysis 1.5).
1.5.3 Processing speed (Stroop Words)
There is a single study in this subgroup (4 participants). There was no clear difference between amino acids and placebo within this subgroup (MD −11.50, 95% CI −27.49 to 4.49; Analysis 1.5).
1.5.4 Processing speed (Stroop Colors)
There is a single study in this subgroup (4 participants). There was no clear difference between amino acids and placebo within this subgroup (MD −6.60, 95% CI −17.45 to 4.25; Analysis 1.5).
1.5.5 Processing speed (Stroop Color‐Words)
There is a single study in this subgroup (4 participants). We found evidence of a clear difference between amino acids and placebo within this subgroup, in favour of amino acids (MD −6.00, 95% CI −9.50 to −2.50; Analysis 1.5).
1.5.6 Executive functioning (WCS perseverative errors)
There is a single study in this subgroup (5 participants). For this outcome, within this subgroup, we found evidence that amino acids were clearly inferior in effect compared with placebo (MD 9.70, 95% CI 4.16 to 15.24; Analysis 1.5).
1.6 Adverse effects 1, specific: treatment‐emergent adverse effects, short‐term (by 8 weeks)
We identified one study relevant to this outcome and categorised data into eight subgroups.
1.6.1 Psychological: irritability
There is a single study in this subgroup (8 participants). There was no clear difference between amino acids and placebo within this subgroup (RR 0.33, 95% CI 0.02 to 6.37; Analysis 1.6).
1.6. Analysis.

Comparison 1 Group A: amino acids vs placebo, Outcome 6 Adverse effects 1 specific: treatment‐emergent adverse effects, short‐term (by 8 weeks).
1.6.2 Psychological: mentation impaired
There is a single study in this subgroup (8 participants). For this subgroup, we did not find evidence of a clear difference between the two treatments (RR 0.33, 95% CI 0.02 to 6.37; Analysis 1.6).
1.6.3 Psychological: hallucinations
We found one study to be relevant to this subgroup (8 participants). For this subgroup, we did not find evidence of a clear difference between the two treatments (RR 0.33, 95% CI 0.02 to 6.37; Analysis 1.6).
1.6.4 Arousal: sedation
We found one study to be relevant to this subgroup (8 participants). There was no clear difference between amino acids and placebo within this subgroup (RR 0.20, 95% CI 0.01 to 3.20; Analysis 1.6).
1.6.5 Arousal: disturbed sleep
There is a single study in this subgroup (8 participants). For this subgroup, we did not find evidence of a clear difference between the two treatments (RR 0.20, 95% CI 0.01 to 3.20; Analysis 1.6).
1.6.6 Arousal: malaise
We found one study to be relevant to this subgroup (8 participants). For this subgroup, we did not find evidence of a clear difference between the two treatments (RR 0.33, 95% CI 0.02 to 6.37; Analysis 1.6).
1.6.7 Sexual: orgasm dysfunction
There is a single study in this subgroup (8 participants). There was no clear difference between amino acids and placebo within this subgroup (RR 3.00, 95% CI 0.16 to 57.36; Analysis 1.6).
1.6.8 Gastrointestinal: stomach discomfort
We found one study to be relevant to this subgroup (8 participants). For this subgroup, we did not find evidence of a clear difference between the two treatments (RR 0.33, 95% CI 0.02 to 6.37; Analysis 1.6).
1.7 Adverse effects 2, specific: cardiovascular, average total score, short‐term (by 8 weeks), blood pressure and pulse rate (higher score = worse)
We identified one study relevant to this outcome and categorised data into three subgroups.
1.7.1 Systolic blood pressure
We found one study to be relevant to this subgroup (8 participants). There was no clear difference between amino acids and placebo within this subgroup (MD 6.00, 95% CI −8.70 to 20.70; Analysis 1.7).
1.7. Analysis.
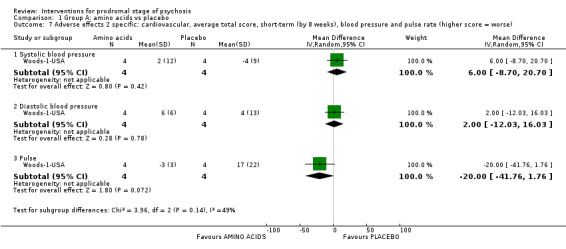
Comparison 1 Group A: amino acids vs placebo, Outcome 7 Adverse effects 2 specific: cardiovascular, average total score, short‐term (by 8 weeks), blood pressure and pulse rate (higher score = worse).
1.7.2 Diastolic blood pressure
We found one study to be relevant to this subgroup (8 participants). For this subgroup, we did not find evidence of a clear difference between the two treatments (MD 2.00, 95% CI −12.03 to 16.03; Analysis 1.7).
1.7.3 Pulse
We found one study to be relevant to this subgroup (8 participants). For this subgroup, we did not find evidence of a clear difference between the two treatments (MD −20.0, 95% CI −41.76 to 1.76; Analysis 1.7).
1.8 Adverse effects 3, specific: weight, average total score, short‐term (by 8 weeks), weight gain (higher score = worse)
For this outcome we found a single study (8 participants). We found evidence of a clear difference between amino acids and placebo, in favour of amino acids (MD −0.67, 95% CI −2.13 to −0.79; Analysis 1.8).
1.8. Analysis.
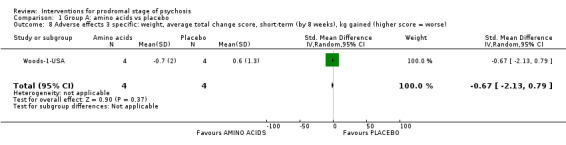
Comparison 1 Group A: amino acids vs placebo, Outcome 8 Adverse effects 3 specific: weight, average total change score, short‐term (by 8 weeks), kg gained (higher score = worse).
1.9 Adverse effects 4, specific: suicidal thoughts, short‐term (by 16 weeks)
For this outcome we found a single study (44 participants). There was no clear difference between amino acids and placebo (RR 3.57, 95% CI 0.15 to 83.14; Analysis 1.9).
1.9. Analysis.

Comparison 1 Group A: amino acids vs placebo, Outcome 9 Adverse effects 4 specific: suicidal thoughts, short‐term (by 16 weeks).
1.10 Satisfaction with treatment: leaving the study early, end point data
For this outcome we found two relevant studies and categorised data into two subgroups (total 52 participants). There was no clear difference between amino acids and placebo (RR 0.96, 95% CI 0.55 to 1.69; Analysis 1.10).
1.10. Analysis.

Comparison 1 Group A: amino acids vs placebo, Outcome 10 Satisfaction with treatment: leaving the study early ‐ end point data.
1.10.1 Short‐term (16 weeks, D‐serine)
There is a single study in this subgroup (44 participants). There was no clear difference between amino acids and placebo within this subgroup (RR 0.92, 95% CI 0.52 to 1.64; Analysis 1.10).
1.10.2 Short‐term (24 weeks, glycine)
There is a single study in this subgroup (8 participants). There was no clear difference between amino acids and placebo within this subgroup (RR 3.0, 95% CI 0.16 to 57.36; Analysis 1.10).
2. Comparison: omega‐3 fatty acids versus placebo
In this comparison, there were 13 outcomes.
2.1 Prodromal symptoms: transition to psychosis
We identified two studies relevant to this outcome, the data from which we divided into two subgroups.
2.1.1 Medium‐term (at 12 months)
We found two studies to be relevant to this subgroup (385 participants). There was no clear difference between omega‐3 fatty acids and placebo within this subgroup (RR 0.50, 95% CI 0.08 to 3.08). For this outcome heterogeneity is high (Chi² = 5.36; df = 1.0; P = 0.02; I² = 81%; Analysis 2.1).
2.1. Analysis.

Comparison 2 Group A: omega‐3 fatty acids vs placebo, Outcome 1 Prodromal symptoms: transition to psychosis.
2.1.2 Long‐term (at 7 years)
There is a single study in this subgroup (81 participants). We found evidence of a clear difference between omega‐3 fatty acids and placebo within this subgroup, in favour of omega‐3 fatty acids (RR 0.24, 95% CI 0.09 to 0.67; Analysis 2.1).
2.2 Global state: antipsychotic prescription, long‐term (at 7 years' follow‐up)
For this outcome we found a single study (69 participants). We found evidence of a clear difference between omega‐3 fatty acids and placebo, in favour of omega‐3 fatty acids (RR 0.54, 95% CI 0.30 to 0.99; Analysis 2.2).
2.2. Analysis.

Comparison 2 Group A: omega‐3 fatty acids vs placebo, Outcome 2 Global state: antipsychotic prescription, long‐term (at 7 years' follow‐up).
2.3 Mental state 1.a, specific: psychotic symptoms, average total score, PANSS (higher score = worse)
We identified one study relevant to this outcome and categorised data into eight subgroups.
2.3.1 General: medium‐term (at 12 months)
We found one study to be relevant to this subgroup (81 participants). For this outcome, within this subgroup, we did not find evidence that omega‐3 fatty acids were clearly different in effect compared with placebo (MD −3.90, 95% CI −8.06 to 0.26; Analysis 2.3).
2.3. Analysis.

Comparison 2 Group A: omega‐3 fatty acids vs placebo, Outcome 3 Mental state 1a specific: psychotic symptoms, average total score, PANSS (higher score = worse).
2.3.2 General: long‐term (up to 7 years)
There is a single study in this subgroup (81 participants). We did not find evidence of a clear difference between omega‐3 fatty acids and placebo within this subgroup (MD −4.70, 95% CI −9.69 to 0.29; Analysis 2.3).
2.3.3 Negative: medium‐term (at 12 months)
There is a single study in this subgroup (81 participants). We found evidence of a clear difference between omega‐3 fatty acids and placebo within this subgroup in favour of omega‐3 fatty acids (MD −2.60, 95% CI −5.09 to −0.11; Analysis 2.3).
2.3.4 Negative: long‐term (up to 7 years)
We found one study to be relevant to this subgroup (81 participants). For this outcome, within this subgroup, we found evidence that omega‐3 fatty acids were clearly superior in effect compared with placebo (MD −3.10, 95% CI −6.15 to −0.05; Analysis 2.3).
2.3.5 Positive: medium‐term (at 12 months)
There is a single study in this subgroup (81 participants). For this outcome, within this subgroup, we found evidence that omega‐3 fatty acids were clearly superior in effect compared with placebo (MD −2.10, 95% CI −4.32 to 0.12; Analysis 2.3).
2.3.6 Positive: long‐term (up to 7 years)
We found one study to be relevant to this subgroup (81 participants). We found evidence of a clear difference between omega‐3 fatty acids and placebo within this subgroup, in favour of omega‐3 fatty acids (MD −3.50, 95% CI −5.99 to −1.01; Analysis 2.3).
2.3.7 Total: medium‐term (at 12 months)
We found one study to be relevant to this subgroup (81 participants). We found evidence of a clear difference between omega‐3 fatty acids and placebo within this subgroup, in favour of omega‐3 fatty acids (MD −8.60, 95% CI −16.36 to −0.84; Analysis 2.3).
2.3.8 Total: long‐term (up to 7 years)
There is a single study in this subgroup (81 participants). We found evidence of a clear difference between omega‐3 fatty acids and placebo within this subgroup, in favour of omega‐3 fatty acids (MD −11.40, 95% CI −20.55 to −2.25; Analysis 2.3).
2.4 Mental state 1.b, specific: negative symptoms, average total score, medium‐term (at 12 months), SANS (higher score = worse)
We identified one study relevant to this outcome (225 participants). We did not find evidence of a clear difference between omega‐3 fatty acids and placebo in this comparison (MD 0.50, 95% CI −2.56 to 3.56; Analysis 2.4).
2.4. Analysis.

Comparison 2 Group A: omega‐3 fatty acids vs placebo, Outcome 4 Mental state 1b specific: negative symptoms, average total score, medium‐term (at 12 months), SANS (higher score = worse).
2.5 Mental state 2, specific: depression, average total score, medium‐term (at 12 months), MADRS (higher score = worse), skewed data
For this outcome we found a single study (225 participants). We did not find evidence of a clear difference between omega‐3 fatty acids and placebo in this comparison (MD −0.3, 95% CI −2.78 to 2.18; Analysis 2.5).
2.5. Analysis.

Comparison 2 Group A: omega‐3 fatty acids vs placebo, Outcome 5 Mental state 2 specific: depression, average total score, medium‐term (at 12 months), MADRS (higher score = worse), skewed data.
2.6 Mental state 3, specific: mania, average total score, medium‐term (at 12 months), YMS (higher score = worse)
We identified one study relevant to this outcome (225 participants). We did not find evidence of a clear difference between omega‐3 fatty acids and placebo in this comparison (MD 0.4, 95% CI −0.35 to 1.15; Analysis 2.6).
2.6. Analysis.

Comparison 2 Group A: omega‐3 fatty acids vs placebo, Outcome 6 Mental state 3 specific: mania, average total score, medium‐term (at 12 months), YMS (higher score = worse).
2.7 Mental state 4, specific: average total scores, various scales (higher score = worse), skewed data
These continuous data (1 RCT) had such large standard deviations as to suggest that analysis within Review Manager 2014 would be inadvisable. Therefore, we have presented them in Analysis 2.7).
2.7. Analysis.
Comparison 2 Group A: omega‐3 fatty acids vs placebo, Outcome 7 Mental state 4 specific: average total scores, various scales (higher score = worse), skewed data.
| Mental state 4 specific: average total scores, various scales (higher score = worse), skewed data | ||||
|---|---|---|---|---|
| Study | Intervention | Mean | SD | N |
| Psychotic symptoms: positive (average total score), long‐term (by up to 7 years) PANSS | ||||
| Amminger‐Austria | Omega‐3 fatty acids | 9.9 | 5.76 | 41 |
| Amminger‐Austria | Placebo | 13.4 | 5.69 | 40 |
| Psychotic symptoms: negative (average total score), medium‐term (at 12 months) PANSS | ||||
| Amminger‐Austria | Omega‐3 fatty acids | 10.2 | 5.76 | 41 |
| Amminger‐Austria | Placebo | 12.8 | 5.69 | 40 |
| Psychotic symptoms: negative (average total score), long‐term (by up to 7 years) PANSS | ||||
| Amminger‐Austria | Omega‐3 fatty acids | 10.9 | 7.04 | 41 |
| Amminger‐Austria | Placebo | 14.0 | 6.96 | 40 |
| Depression: average total score, medium‐term (at 12 months), MADRS | ||||
| Amminger‐Austria | Omega‐3 fatty acids | 9.4 | 12.17 | 41 |
| Amminger‐Austria | Placebo | 13.5 | 12.02 | 40 |
| Depression: average total score, long‐term (by up to 7 years) MADRS | ||||
| Amminger‐Austria | Omega‐3 fatty acids | 10.3 | 12.81 | 41 |
| Amminger‐Austria | Placebo | 16.1 | 12.65 | 40 |
2.8 Functioning 1, global: average total score GAF (higher score = better)
For this outcome we found a single study and categorised data into two subgroups.
2.8.1 Medium‐term (at 12 months)
There is a single study in this subgroup (81 participants). We found evidence of a clear difference between omega‐3 fatty acids and placebo within this subgroup, in favour of omega‐3 fatty acids (MD 11.5, 95% CI 5.12 to 17.88; Analysis 2.8).
2.8. Analysis.

Comparison 2 Group A: omega‐3 fatty acids vs placebo, Outcome 8 Functioning 1 global: average total score, GAF (higher score = better).
2.8.2 Long‐term (at up to 7 years)
We found one study to be relevant to this subgroup (81 participants). We found evidence of a clear difference between omega‐3 fatty acids and placebo, in favour of omega‐3 fatty acids (MD 9.50, 95% CI 2.02 to 16.98; Analysis 2.8).
2.9 Functioning 2, specific: role functioning, average total score, medium‐term (at 12 months), GFR (higher score = better)
We identified one study relevant to this outcome (225 participants). We found no clear difference between omega‐3 fatty acids and placebo (MD 0.00, 95% CI −0.49 to 0.49; Analysis 2.9).
2.9. Analysis.
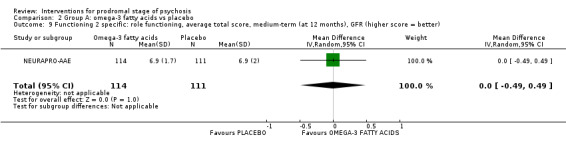
Comparison 2 Group A: omega‐3 fatty acids vs placebo, Outcome 9 Functioning 2 specific: role functioning, average total score, medium‐term (at 12 months), GFR (higher score = better).
2.10 Functioning 3.a, specific: social functioning, average total score, medium‐term (at 12 months), GFS (higher score = better)
We identified one study relevant to this outcome (225 participants). For this outcome, we did not find evidence that omega‐3 fatty acids were clearly different in effect compared with placebo (MD −0.20, 95% CI −0.59 to 0.19; Analysis 2.10).
2.10. Analysis.

Comparison 2 Group A: omega‐3 fatty acids vs placebo, Outcome 10 Functioning 3a specific: social functioning, average total score, medium‐term (at 12 months), GFS (higher score = better).
2.11 Functioning 3.b, specific: social functioning, average total score, medium‐term (at 12 months), SOFAS, (higher score = better)
For this outcome we found a single study (225 participants). There was no clear difference between omega‐3 fatty acids and placebo (MD 0.10, 95% CI −4.60 to 4.80; Analysis 2.11).
2.11. Analysis.
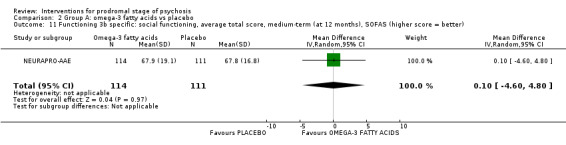
Comparison 2 Group A: omega‐3 fatty acids vs placebo, Outcome 11 Functioning 3b specific: social functioning, average total score, medium‐term (at 12 months), SOFAS (higher score = better).
2.12 Adverse effects, specific: medium‐term (by 12 months), UKU checklist
We identified two studies relevant to this outcome and categorised data into 23 subgroups.
2.12.1 Arousal: concentration difficulties
We found one study to be relevant to this subgroup (81 participants). For this subgroup, we did not find evidence of a clear difference between omega‐3 fatty acids and placebo (RR 0.20, 95% CI 0.02 to 1.60; Analysis 2.12).
2.12. Analysis.

Comparison 2 Group A: omega‐3 fatty acids vs placebo, Outcome 12 Adverse effects, specific: medium‐term (by 12 months), UKU checklist.
2.12.2 Arousal: increased fatigability
We found one study to be relevant to this subgroup (81 participants). There was no clear difference between omega‐3 fatty acids and placebo within this subgroup (RR 1.46, 95% CI 0.26 to 8.3; Analysis 2.12).
2.12.3 Arousal: sleep: reduced duration of sleep
We found one study to be relevant to this subgroup (81 participants). For this subgroup, we did not find evidence of a clear difference between omega‐3 fatty acids and placebo (RR 0.98, 95% CI 0.21 to 4.55; Analysis 2.12).
2.12.4 Arousal: sleep‐related: unspecified
There is a single study in this subgroup (304 participants). For this subgroup, we did not find evidence of a clear difference between omega‐3 fatty acids and placebo (RR 0.83, 95% CI 0.49 to 1.42; Analysis 2.12).
2.12.5 Autonomic nervous system: orthostatic dizziness
We found one study to be relevant to this subgroup (81 participants). For this subgroup, we did not find evidence of a clear difference between omega‐3 fatty acids and placebo (RR 0.20, 95% CI 0.01 to 3.94; Analysis 2.12).
2.12.6 Autonomic nervous system: sweating increase
There is a single study in this subgroup (81 participants). For this subgroup, we did not find evidence of a clear difference between omega‐3 fatty acids and placebo (RR 0.20, 95% CI 0.01 to 3.94; Analysis 2.12).
2.12.7 Autonomic nervous system: unspecified
We found one study to be relevant to this subgroup (304 participants). There was no clear difference between omega‐3 fatty acids and placebo within this subgroup (RR 1.56, 95% CI 0.79 to 3.11; Analysis 2.12).
2.12.8 Gastrointestinal: diarrhoea
We found one study to be relevant to this subgroup (81 participants). For this subgroup, we did not find evidence of a clear difference between omega‐3 fatty acids and placebo (RR 0.24, 95% CI 0.03 to 2.09; Analysis 2.12).
2.12.9 Gastrointestinal: nausea/vomiting
There is a single study in this subgroup (81 participants). For this subgroup, we did not find evidence of a clear difference between omega‐3 fatty acids and placebo (RR 0.98, 95% CI 0.21 to 4.55; Analysis 2.12).
2.12.10 Gastrointestinal: unspecified
We found one study to be relevant to this subgroup (304 participants). For this subgroup, we did not find evidence of a clear difference between omega‐3 fatty acids and placebo (RR 1.28, 95% CI 0.91 to 1.79; Analysis 2.12).
2.12.11 Haematological: increased bleeding
There is a single study in this subgroup (304 participants). For this subgroup, we did not find evidence of a clear difference between omega‐3 fatty acids and placebo (RR 0.33, 95% CI 0.01 to 8.01; Analysis 2.12).
2.12.12 Hormonal: unspecified
There is a single study in this subgroup (304 participants). There was no clear difference between omega‐3 fatty acids and placebo within this subgroup (RR 0.61, 95% CI 0.26 to 1.42; Analysis 2.12).
2.12.13 Neurological: extrapyramidal
There is a single study in this subgroup (304 participants). There was no clear difference between omega‐3 fatty acids and placebo within this subgroup (RR 2.57, 95% CI 0.94 to 7.02; Analysis 2.12).
2.12.14 Neurological: failing memory
We found one study to be relevant to this subgroup (81 participants). For this subgroup, we did not find evidence of a clear difference between omega‐3 fatty acids and placebo (RR 0.20, 95% CI 0.01 to 3.94; Analysis 2.12).
2.12.15 Neurological: tension headache
There is a single study in this subgroup (81 participants). There was no clear difference between omega‐3 fatty acids and placebo within this subgroup (RR 0.24, 95% CI 0.03 to 2.09; Analysis 2.12).
2.12.16 Neurological: unspecified
There is a single study in this subgroup (304 participants). There was no clear difference between omega‐3 fatty acids and placebo within this subgroup (RR 1.85, 95% CI 0.81 to 4.24; Analysis 2.12).
2.12.17 Psychological: depression
We found one study to be relevant to this subgroup (81 participants). For this subgroup, we did not find evidence of a clear difference between omega‐3 fatty acids and placebo (RR 0.39, 95% CI 0.08 to 1.90; Analysis 2.12).
2.12.18 Psychological: emotional indifference
We found one study to be relevant to this subgroup (81 participants). For this subgroup, we did not find evidence of a clear difference between omega‐3 fatty acids and placebo (RR 0.49, 95% CI 0.09 to 2.52; Analysis 2.12).
2.12.19 Psychological: tension/inner unrest
There is a single study in this subgroup (81 participants). There was no clear difference between omega‐3 fatty acids and placebo within this subgroup (RR 0.78, 95% CI 0.23 to 2.70; Analysis 2.12).
2.12.20 Psychological: unspecified
We found one study to be relevant to this subgroup (304 participants). There was no clear difference between omega‐3 fatty acids and placebo within this subgroup (RR 1.32, 95% CI 0.70 to 2.47; Analysis 2.12).
2.12.21 Sexual: unspecified
There is a single study in this subgroup (304 participants). There was no clear difference between omega‐3 fatty acids and placebo within this subgroup (RR 6.91, 95% CI 0.86 to 55.48; Analysis 2.12).
2.12.22 Skin: unspecified
There is a single study in this subgroup (304 participants). There was no clear difference between omega‐3 fatty acids and placebo within this subgroup (RR 0.70, 95% CI 0.23 to 2.17; Analysis 2.12).
2.12.23 Other: unspecified
We found one study to be relevant to this subgroup (304 participants). There was no clear difference between omega‐3 fatty acids and placebo within this subgroup (RR 1.12, 95% CI 0.66 to 1.90; Analysis 2.12).
2.13 Satisfaction with treatment: leaving the study early
We identified two studies relevant to this outcome, the data from which we divided into two subgroups.
2.13.1 Medium‐term (by 12 months, end point)
There are two relevant studies in this subgroup (385 participants). There was no clear difference between omega‐3 fatty acids and placebo within this subgroup (RR 0.98, 95% CI 0.68 to 1.42; Analysis 2.13).
2.13. Analysis.

Comparison 2 Group A: omega‐3 fatty acids vs placebo, Outcome 13 Satisfaction with treatment: leaving the study early.
2.13.2 Long‐term (by 7 years, additional follow‐up)
We found one study to be relevant to this subgroup (81 participants). For this subgroup, we did not find evidence of a clear difference between omega‐3 fatty acids and placebo (RR 1.46, 95% CI 0.45 to 4.80; Analysis 2.13).
Group B: comparisons where it is unclear how interaction has affected the interventions
B.i. Antipsychotic drugs
3. Comparison: amisulpiride + needs‐focused intervention versus needs‐focused intervention
This comparison has seven outcomes.
3.1 Mental state, specific: average end point scores, short‐term (at 12 weeks), various scales (higher score = worse), skewed data
These continuous data, from a single study, had such large standard deviations as to suggest that analysis within Review Manager 2014 would be inadvisable (please see Analysis 3.1).
3.1. Analysis.
Comparison 3 Group B: antipsychotic drugs, amisulpiride + needs‐focused intervention (NFI) vs NFI, Outcome 1 Mental state, specific: average endpoint scores, short‐term (at 12 weeks), various scales (higher score = worse), skewed data.
| Mental state, specific: average endpoint scores, short‐term (at 12 weeks), various scales (higher score = worse), skewed data | |||||
|---|---|---|---|---|---|
| Study | Intervention | Mean | SD | N | Note |
| Psychotic symptoms: positive (endpoint score) PANSS | |||||
| LIPS‐Germany | Amisulpiride + Needs focused interventions | 9.7 | 3.4 | 58 | |
| LIPS‐Germany | Needs focused interventions | 11.8 | 4.5 | 44 | |
| Psychotic symptoms: negative (endpoint score) PANSS | |||||
| LIPS‐Germany | Amisulpiride + Needs focused interventions | 12.2 | 5 | 58 | |
| LIPS‐Germany | Needs focused interventions | 13.5 | 5 | 44 | |
| Psychotic symptoms: general (endpoint score) PANSS | |||||
| LIPS‐Germany | Amisulpiride + Needs focused interventions | 25.8 | 8.7 | 58 | |
| LIPS‐Germany | Needs focused interventions | 29.2 | 8.9 | 44 | |
| Depression (endpoint score) MADRS | |||||
| LIPS‐Germany | Amisulpiride + Needs focused interventions | 11.8 | 9 | 58 | |
| LIPS‐Germany | Needs focused interventions | 12.9 | 8.4 | 44 | |
3.2 Functioning, global: average end point score, short‐term (at 12 weeks), GAF (higher score = better)
For this outcome we found a single study (102 participants). We found evidence of a clear difference between amisulpiride + needs‐focused intervention (NFI) and NFI alone in this comparison, in favour of amisulpiride + NFI (MD 6.10, 95% CI 0.44 to 11.76; Analysis 3.2).
3.2. Analysis.
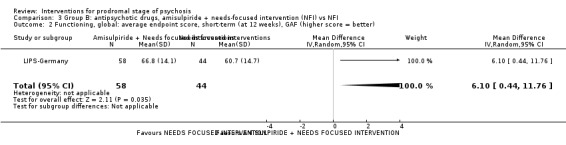
Comparison 3 Group B: antipsychotic drugs, amisulpiride + needs‐focused intervention (NFI) vs NFI, Outcome 2 Functioning, global: average endpoint score, short‐term (at 12 weeks), GAF (higher score = better).
3.3 Adverse effects 1.a, specific: akathisia, short‐term (at 12 weeks), ESRS
For this outcome we found a single study (104 participants). There was no clear difference between amisulpiride + NFI and NFI (RR 2.82, 95% CI 0.33 to 24.36; Analysis 3.3).
3.3. Analysis.
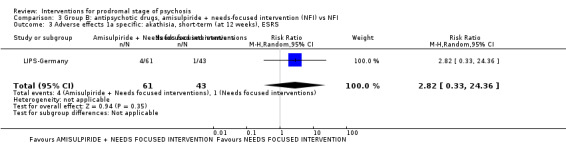
Comparison 3 Group B: antipsychotic drugs, amisulpiride + needs‐focused intervention (NFI) vs NFI, Outcome 3 Adverse effects 1a specific: akathisia, short‐term (at 12 weeks), ESRS.
3.4 Adverse effects 1.b, specific: akathisia, average end point score, short‐term (at 12 weeks), ESRS (higher score = worse), skewed data
These continuous data (1 RCT) were too skewed to report in a graph (please see Analysis 3.4).
3.4. Analysis.
Comparison 3 Group B: antipsychotic drugs, amisulpiride + needs‐focused intervention (NFI) vs NFI, Outcome 4 Adverse effects 1b specific: akathisia (average endpoint score), short‐term (at 12 weeks), ESRS (higher score = worse), skewed data.
| Adverse effects 1b specific: akathisia (average endpoint score), short‐term (at 12 weeks), ESRS (higher score = worse), skewed data | |||||
|---|---|---|---|---|---|
| Study | Intervention | Mean | SD | N | Note |
| LIPS‐Germany | Amisulpiride + Needs focused interventions | 0.5 | 1.3 | 61 | |
| LIPS‐Germany | Needs focused interventions | 0.2 | 0.8 | 43 | |
3.5 Adverse effects 2, specific: increased prolactin levels, short‐term (at 12 weeks)
For this outcome we found a single study (78 participants). We found evidence of a clear difference between amisulpiride + NFI and NFI, in favour of NFI (RR 3.97, 95% CI 2.02 to 7.80; Analysis 3.5).
3.5. Analysis.

Comparison 3 Group B: antipsychotic drugs, amisulpiride + needs‐focused intervention (NFI) vs NFI, Outcome 5 Adverse effects 2 specific: increased prolactin levels, short‐term (at 12 weeks).
3.6 Adverse effects 3, specific: severity of at least moderate and a frequency of at least 5%, short‐term (at 12 weeks), UKU
For this outcome we found a single study, the data from which we divided into subgroups.
3.6.1 Psychological: concentration difficulties
There is a single study in this subgroup (101 participants). There was no clear difference between amisulpiride + NFI and NFI within this subgroup (RR 1.01, 95% CI 0.78 to 1.31; Analysis 3.6).
3.6. Analysis.
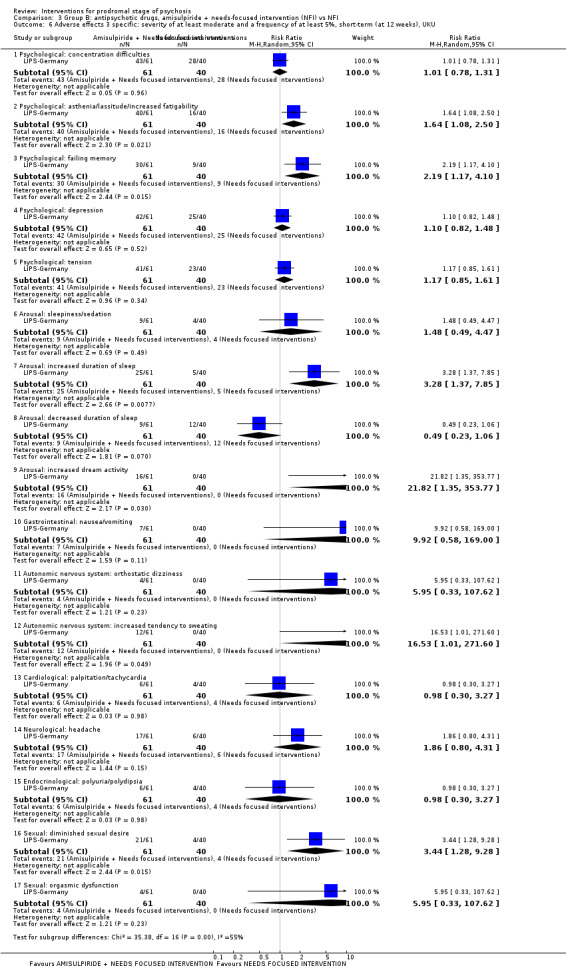
Comparison 3 Group B: antipsychotic drugs, amisulpiride + needs‐focused intervention (NFI) vs NFI, Outcome 6 Adverse effects 3 specific: severity of at least moderate and a frequency of at least 5%, short‐term (at 12 weeks), UKU.
3.6.2 Psychological: asthenia/lassitude/increased fatigability
There is a single study in this subgroup (101 participants). We found evidence of a clear difference between amisulpiride + NFI and NFI within this subgroup, in favour of NFI (RR 1.64, 95% CI 1.08 to 2.50; Analysis 3.6).
3.6.3 Psychological: failing memory
We found one study to be relevant to this subgroup (101 participants). For this outcome, within this subgroup, we found evidence that amisulpiride + NFI was inferior compared to NFI (RR 2.19, 95% CI 1.17 to 4.10; Analysis 3.6).
3.6.4 Psychological: depression
There is a single study in this subgroup (101 participants). There was no clear difference between amisulpiride + NFI and NFI within this subgroup (RR 1.10, 95% CI 0.82 to 1.48; Analysis 3.6).
3.6.5 Psychological: tension
There is a single study in this subgroup (101 participants). There was no clear difference between amisulpiride + NFI and NFI within this subgroup (RR 1.17, 95% CI 0.85 to 1.61; Analysis 3.6).
3.6.6 Arousal: sleepiness/sedation
There is a single study in this subgroup (101 participants). For this subgroup, we did not find evidence of a clear difference between the two treatments (RR 1.48, 95% CI 0.49 to 4.47; Analysis 3.6).
3.6.7 Arousal: increased duration of sleep
We found one study to be relevant to this subgroup (101 participants). We found evidence of a clear difference between amisulpiride + NFI and NFI within this subgroup, in favour of NFI (RR 3.28, 95% CI 1.37 to 7.85; Analysis 3.6).
3.6.8 Arousal: decreased duration of sleep
We found one study to be relevant to this subgroup (101 participants). There was no clear difference between amisulpiride + NFI and NFI within this subgroup (RR 0.49, 95% CI 0.23 to 1.06; Analysis 3.6).
3.6.9 Arousal: increased dream activity
We found one study to be relevant to this subgroup (101 participants). For this outcome, within this subgroup, we found evidence that amisulpiride + NFI was inferior to NFI (RR 21.82, 95% CI 1.35 to 353.77; Analysis 3.6).
3.6.10 Gastrointestinal: nausea/vomiting
We found one study to be relevant to this subgroup (101 participants). There was no clear difference between amisulpiride + NFI and NFI within this subgroup (RR 9.92, 95% CI 0.58 to 169.0; Analysis 3.6).
3.6.11 Autonomic nervous system: orthostatic dizziness
There is a single study in this subgroup (101 participants). There was no clear difference between amisulpiride + NFI and NFI within this subgroup (RR 5.95, 95% CI 0.33 to 107.62; Analysis 3.6).
3.6.12 Autonomic nervous system: increased tendency to sweating
There is a single study in this subgroup (101 participants). For this outcome, within this subgroup, we found evidence that amisulpiride + NFI was inferior to NFI (RR 16.53, 95% CI 1.01 to 271.60). Analysis 3.6).
3.6.13 Cardiological: palpitation/tachycardia
There is a single study in this subgroup (101 participants). For this subgroup, we did not find evidence of a clear difference between the two treatments (RR 0.98, 95% CI 0.30 to 3.27; Analysis 3.6).
3.6.14 Neurological: headache
We found one study to be relevant to this subgroup (101 participants). There was no clear difference between amisulpiride + NFI and NFI within this subgroup (RR 1.86, 95% CI 0.8 to 4.31; Analysis 3.6).
3.6.15 Endocrinological: polyuria/polydipsia
We found one study to be relevant to this subgroup (101 participants). For this subgroup, we did not find evidence of a clear difference between the two treatments (RR 0.98, 95% CI 0.30 to 3.27; Analysis 3.6).
3.6.16 Sexual: diminished sexual desire
There is a single study in this subgroup (101 participants). We found evidence of a clear difference between amisulpiride + NFI and NFI within this subgroup, in favour of NFI (RR 3.44, 95% CI 1.28 to 9.28; Analysis 3.6).
3.6.17 Sexual: orgasmic dysfunction
There is a single study in this subgroup (101 participants). For this subgroup, we did not find evidence of a clear difference between the two treatments (RR 5.95, 95% CI 0.33 to 107.62; Analysis 3.6).
3.7 Adverse effects 4, specific: suicidal thoughts
For this important outcome we identified one small study (102 participants). We identified no clear difference between groups (RR 0.25, 95% CI 0.01 to 6.10; Analysis 3.7).
3.7. Analysis.
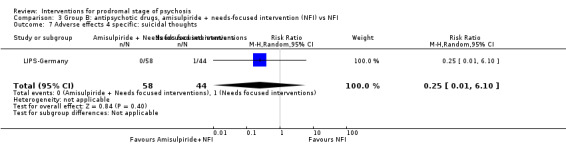
Comparison 3 Group B: antipsychotic drugs, amisulpiride + needs‐focused intervention (NFI) vs NFI, Outcome 7 Adverse effects 4 specific: suicidal thoughts.
3.8 Satisfaction with treatment: leaving the study early, end point data
For this outcome we found a single study (124 participants). We found evidence of a clear difference between amisulpiride + NFI and NFI (RR 0.59, 95% CI 0.38 to 0.94; Analysis 3.8).
3.8. Analysis.

Comparison 3 Group B: antipsychotic drugs, amisulpiride + needs‐focused intervention (NFI) vs NFI, Outcome 8 Satisfaction with treatment: leaving the study early, end point data.
4. Comparison: olanzapine + supportive intervention versus placebo + supportive intervention
This comparison has 12 outcomes.
4.1 Prodromal symptoms: transition to psychosis, end point data, medium‐term (by 12 months)
We identified one study relevant to this outcome (60 participants). We did not find evidence of a clear difference between the two treatments in this comparison (RR 0.58, 95% CI 0.28 to 1.18; Analysis 4.1).
4.1. Analysis.
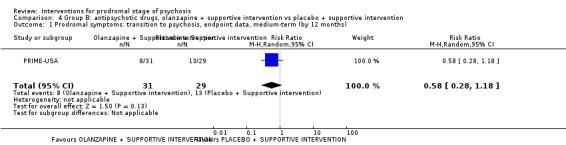
Comparison 4 Group B: antipsychotic drugs, olanzapine + supportive intervention vs placebo + supportive intervention, Outcome 1 Prodromal symptoms: transition to psychosis, endpoint data, medium‐term (by 12 months).
4.2 Global state, global: illness severity, average total score, medium‐term (at 12 months), CGI (higher score = worse)
We identified one study relevant to this outcome (59 participants). For this outcome, we did not find evidence that olanzapine + supportive intervention was different in its effects compared with placebo + supportive intervention (MD −0.23, 95% CI −0.82 to 0.36; Analysis 4.2).
4.2. Analysis.

Comparison 4 Group B: antipsychotic drugs, olanzapine + supportive intervention vs placebo + supportive intervention, Outcome 2 Global state, global: illness severity, average total score, medium‐term (at 12 months), CGI (higher score = worse).
4.3 Mental state, specific: average total scores, medium‐term (at 12 months), various scales (higher score = worse), skewed data
These continuous data (1 RCT) were too skewed to report in a graph (please see Analysis 4.3).
4.3. Analysis.
Comparison 4 Group B: antipsychotic drugs, olanzapine + supportive intervention vs placebo + supportive intervention, Outcome 3 Mental state specific: average total scores, medium‐term (at 12 months), various scales (higher score = worse), skewed data.
| Mental state specific: average total scores, medium‐term (at 12 months), various scales (higher score = worse), skewed data | |||||
|---|---|---|---|---|---|
| Study | Intervention | Mean | SD | N | Note |
| Psychosis risk symptoms: total, average total change score, SOPS | |||||
| PRIME‐USA | Olanzapine + Supportive intervention | 33.8 | 17.17 | 30 | |
| PRIME‐USA | Placebo + Supportive intervention | 36.56 | 19.08 | 29 | |
| Psychosis risk symptoms: positive, average total change score, SOPS | |||||
| PRIME‐USA | Olanzapine + Supportive intervention | 7.2 | 5.78 | 30 | |
| PRIME‐USA | Placebo + Supportive intervention | 9.93 | 7.6 | 29 | |
| Psychosis risk symptoms: negative, average total change score, SOPS | |||||
| PRIME‐USA | Olanzapine + Supportive intervention | 13.8 | 6.38 | 30 | |
| PRIME‐USA | Placebo + Supportive intervention | 13.52 | 6.54 | 29 | |
| Psychosis risk symptoms: disorganisation, average total change score, SOPS | |||||
| PRIME‐USA | Olanzapine + Supportive intervention | 6 | 4.05 | 30 | |
| PRIME‐USA | Placebo + Supportive intervention | 6.49 | 4.54 | 29 | |
| Psychosis risk symptoms: general, average total change score, SOPS | |||||
| PRIME‐USA | Olanzapine + Supportive intervention | 6.8 | 3.66 | 30 | |
| PRIME‐USA | Placebo + Supportive intervention | 6.62 | 4.21 | 29 | |
| Psychosis risk symptoms: total, average total change score, PANSS | |||||
| PRIME‐USA | Olanzapine + Supportive intervention | 61.93 | 22.12 | 30 | |
| PRIME‐USA | Placebo + Supportive intervention | 61.45 | 21.65 | 29 | |
| Psychotic symptoms: positive, average total change score, PANSS | |||||
| PRIME‐USA | Olanzapine + Supportive intervention | 13.6 | 5.65 | 30 | |
| PRIME‐USA | Placebo + Supportive intervention | 14.17 | 6.74 | 29 | |
| Psychotic symptoms: negative, average total change score, PANSS | |||||
| PRIME‐USA | Olanzapine + Supportive intervention | 16.97 | 6.55 | 30 | |
| PRIME‐USA | Placebo + Supportive intervention | 16.45 | 5.66 | 29 | |
| Psychotic symptoms: general, average total change score, PANSS | |||||
| PRIME‐USA | Olanzapine + Supportive intervention | 31.37 | 12.07 | 30 | |
| PRIME‐USA | Placebo + Supportive intervention | 30.83 | 11.35 | 29 | |
| Depression: average total change score, MADRS | |||||
| PRIME‐USA | Olanzapine + Supportive intervention | 12.57 | 9.01 | 30 | |
| PRIME‐USA | Placebo + Supportive intervention | 11.89 | 8.6 | 29 | |
| Mania: average total change score, YMS | |||||
| PRIME‐USA | Olanzapine + Supportive intervention | 4.54 | 5.74 | 30 | |
| PRIME‐USA | Placebo + Supportive intervention | 5.45 | 5.48 | 29 | |
4.4 Functioning, global: average total score, medium‐term (at 12 months), GAF (higher score = better)
We identified one study relevant to this outcome (59 participants). There was no clear difference between olanzapine + supportive intervention and placebo + supportive intervention (MD 2.43, 95% CI −4.77 to 9.63; Analysis 4.4).
4.4. Analysis.

Comparison 4 Group B: antipsychotic drugs, olanzapine + supportive intervention vs placebo + supportive intervention, Outcome 4 Functioning, global: average total score, medium‐term (at 12 months), GAF (higher score = better).
4.5 Adverse effects 1, specific: average total score, short‐term (at 8 weeks), various scales (higher score = worse), skewed data
These continuous data, from a single study, had such large standard deviations as to suggest that analysis within Review Manager 2014 would be inadvisable (please see Analysis 4.5).
4.5. Analysis.
Comparison 4 Group B: antipsychotic drugs, olanzapine + supportive intervention vs placebo + supportive intervention, Outcome 5 Adverse effects 1 specific: average total score, short‐term (at 8 weeks), various scales (higher score = worse), skewed data.
| Adverse effects 1 specific: average total score, short‐term (at 8 weeks), various scales (higher score = worse), skewed data | |||||
|---|---|---|---|---|---|
| Study | Intervention | Mean | SD | N | Note |
| Extrapyramidal symptoms: average total change score, Simpson‐Angus scale | |||||
| PRIME‐USA | Olanzapine + Supportive intervention | 1 | 1.32 | 30 | |
| PRIME‐USA | Placebo + Supportive intervention | 0.9 | 1.39 | 29 | |
| Akathisia: average total change score, Barnes akathisia scale | |||||
| PRIME‐USA | Olanzapine + Supportive intervention | 0.9 | 2.3 | 30 | |
| PRIME‐USA | Placebo + Supportive intervention | 0.4 | 1.92 | 29 | |
| Abnormal involuntary movements: average total change score, AIMS | |||||
| PRIME‐USA | Olanzapine + Supportive intervention | 0.9 | 2.4 | 30 | |
| PRIME‐USA | Placebo + Supportive intervention | 0.3 | 1.05 | 29 | |
4.6 Adverse effects 2.a, specific: cardiovascular, average total score, short‐term (at 8 weeks), blood pressure and pulse rate (higher score = worse)
We identified one study relevant to this outcome, the data from which we divided into six subgroups.
4.6.1 Sitting systolic blood pressure
There is a single study in this subgroup (59 participants). For this subgroup, we did not find evidence of a clear difference between the two treatments (MD 1.00, 95% CI −4.28 to 6.28; Analysis 4.6).
4.6. Analysis.

Comparison 4 Group B: antipsychotic drugs, olanzapine + supportive intervention vs placebo + supportive intervention, Outcome 6 Adverse effects 2a specific: cardiovascular, average total change score, short‐term (at 8 weeks), blood pressure and pulse rate (higher score = worse).
4.6.2 Sitting diastolic blood pressure
We found one study to be relevant to this subgroup (59 participants). There was no clear difference between olanzapine + supportive intervention and placebo + supportive intervention within this subgroup (MD 2.30, 95% CI −7.43 to 2.83; Analysis 4.6).
4.6.3 Sitting pulse
We found one study to be relevant to this subgroup (59 participants). There was no clear difference between olanzapine + supportive intervention and placebo + supportive intervention within this subgroup (MD 8.20, 95% CI −0.03 to 16.37; Analysis 4.6).
4.6.4 Standing systolic blood pressure
We found one study to be relevant to this subgroup (59 participants). There was no clear difference between olanzapine + supportive intervention and placebo + supportive intervention within this subgroup (MD −1.80, 95% CI −6.96 to 3.36; Analysis 4.6).
4.6.5 Standing diastolic blood pressure
There is a single study in this subgroup (59 participants). For this subgroup, we did not find evidence of a clear difference between the two treatments (MD −1.80, 95% CI −6.96 to 3.36; Analysis 4.6).
4.6.6 Standing pulse
There is a single study in this subgroup (59 participants). For this subgroup, we did not find evidence of a clear difference between the two treatments (MD 7.90, 95% CI −0.74 to 16.54; Analysis 4.6).
4.7 Adverse effects 2.b, specific: cardiovascular, average total score, medium‐term (at 12 months), pulse rate (higher score = worse)
For this outcome we found a single study and categorised data into two subgroups.
4.7.1 Sitting pulse
There is a single study in this subgroup (58 participants). For this subgroup, we found evidence of a difference between the two treatments, in favour of placebo + supportive intervention (MD 9.27, 95% CI 1.49 to 17.05; Analysis 4.7).
4.7. Analysis.

Comparison 4 Group B: antipsychotic drugs, olanzapine + supportive intervention vs placebo + supportive intervention, Outcome 7 Adverse effects 2b specific: cardiovascular, average total score, medium‐term (at 12 months), pulse rate (higher score = worse).
4.7.2 Standing pulse
We found one study to be relevant to this subgroup (57 participants). For this subgroup, we did not find evidence of a clear difference between the two treatments (MD 6.94, 95% CI −2.61 to 16.49; Analysis 4.7).
4.8 Adverse effects 3, specific: treatment‐emergent adverse effects, short‐term (at 8 weeks)
We identified one study relevant to this outcome and categorised data into eight subgroups.
4.8.1 Arousal: somnolence
We found one study to be relevant to this subgroup (60 participants). There was no clear difference between olanzapine + supportive intervention and placebo + supportive intervention within this subgroup (RR 2.25, 95% CI 0.90 to 5.59; Analysis 4.8).
4.8. Analysis.

Comparison 4 Group B: antipsychotic drugs, olanzapine + supportive intervention vs placebo + supportive intervention, Outcome 8 Adverse effects 3 specific: treatment‐emergent adverse effects, short‐term (at 8 weeks).
4.8.2 Gastrointestinal: weight gain
There is a single study in this subgroup (60 participants). For this outcome, within this subgroup, we found evidence that olanzapine + supportive intervention was clearly different in its effects compared with placebo + supportive intervention, in favour of the control group (RR 10.29, 95% CI 1.42 to 74.79; Analysis 4.8).
4.8.3 Gastrointestinal: increased appetite
We found one study to be relevant to this subgroup (60 participants). For this subgroup, we did not find evidence of a clear difference between the two treatments (RR 1.87, 95% CI 0.51 to 6.80; Analysis 4.8).
4.8.4 Psychological: anxiety
There is a single study in this subgroup (60 participants). There was no clear difference between olanzapine + supportive intervention and placebo + supportive intervention within this subgroup (RR 4.68, 95% CI 0.58 to 37.68; Analysis 4.8).
4.8.5 Psychological: nervousness
We found one study to be relevant to this subgroup (60 participants). For this subgroup, we did not find evidence of a clear difference between the two treatments (RR 1.87, 95% CI 0.37 to 9.46; Analysis 4.8).
4.8.6 Psychological: asthenia
We found one study to be relevant to this subgroup (60 participants). For this subgroup, we did not find evidence of a clear difference between the two treatments (RR 3.74, 95% CI 0.44 to 31.55; Analysis 4.8).
4.8.7 Psychological: abnormal thoughts
We found one study to be relevant to this subgroup (60 participants). For this subgroup, we did not find evidence of a clear difference between the two treatments (RR 1.40, 95% CI 0.25 to 7.81; Analysis 4.8).
4.8.8 Muscoloskeletal: joint disorder
There is a single study in this subgroup (60 participants). For this subgroup, we did not find evidence of a clear difference between the two treatments (RR 0.94, 95% CI 0.20 to 4.27; Analysis 4.8).
4.9 Adverse effects 4.a, specific: weight, average total weight change, kg gained (higher scores = worse)
For this outcome we found a single study (59 participants) with both short‐ and medium‐term data. For this outcome, we found evidence that olanzapine + supportive intervention was clearly inferior in its effects compared with placebo + supportive intervention by 12 months (MD 8.49, 95% CI 4.90 to 12.08; Analysis 4.9).
4.9. Analysis.
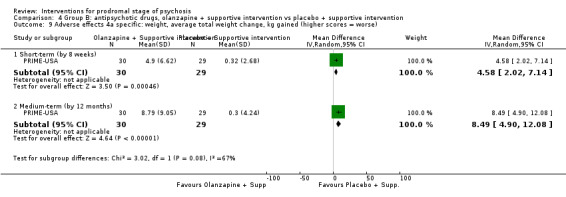
Comparison 4 Group B: antipsychotic drugs, olanzapine + supportive intervention vs placebo + supportive intervention, Outcome 9 Adverse effects 4a specific: weight, average total weight change, kg gained (higher scores = worse).
4.10 Adverse effects 4.b, specific: weight gain, medium‐term (at 12 months)
For this outcome we found a single study (60 participants). For this outcome, we found evidence that olanzapine + supportive intervention was clearly inferior in its effects compared with placebo + supportive intervention (RR 3.55, 95% CI 1.53 to 8.28; Analysis 4.10).
4.10. Analysis.
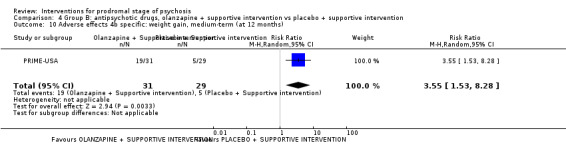
Comparison 4 Group B: antipsychotic drugs, olanzapine + supportive intervention vs placebo + supportive intervention, Outcome 10 Adverse effects 4b specific: weight gain, medium‐term (at 12 months).
4.11 Adverse effects 5, specific: fatigue, medium‐term (at 12 months)
We identified one study relevant to this outcome (60 participants). We found evidence of a clear difference between olanzapine + supportive intervention and placebo + supportive intervention, in favour of the control group (RR 8.42, 95% CI 1.14 to 62.4; Analysis 4.11).
4.11. Analysis.

Comparison 4 Group B: antipsychotic drugs, olanzapine + supportive intervention vs placebo + supportive intervention, Outcome 11 Adverse effects 5 specific: fatigue, medium‐term (at 12 months).
4.12 Satisfaction with treatment: leaving the study early, end point data, medium‐term (by 12 months)
For this outcome we found a single study involving 60 participants. We did not find evidence of a clear difference between the two treatments in this comparison (RR 1.59, 95% CI 0.88 to 2.88; Analysis 4.12).
4.12. Analysis.

Comparison 4 Group B: antipsychotic drugs, olanzapine + supportive intervention vs placebo + supportive intervention, Outcome 12 Satisfaction with treatment: leaving the study early, endpoint data, medium‐term (by 12 months).
B.ii. Cognitive behavioural therapy
5. Comparison: cognitive behavioural therapy + supportive therapy versus supportive therapy
This comparison has 11 outcomes.
5.1 Prodromal symptoms: transition to psychosis
We identified five studies relevant to this outcome and categorised data into four subgroups.
5.1.1 Medium‐term (by 12 months)
We found five studies to be relevant to this subgroup (728 participants). We found evidence of a clear difference between cognitive behavioural therapy (CBT) + supportive therapy and supportive therapy within this subgroup, favouring a combination of CBT and supportive therapy (RR 0.47, 95% CI 0.29 to 0.76; Analysis 5.1).
5.1. Analysis.

Comparison 5 Group B: cognitive behavioural therapy (CBT), CBT + supportive therapy vs supportive therapy, Outcome 1 Prodromal symptoms: transition to psychosis.
5.1.2 Long‐term (by 18 months)
We found two studies to be relevant to this subgroup (252 participants). We found evidence of a clear difference between CBT + supportive therapy and supportive therapy within this subgroup, favouring a combination of CBT and supportive therapy (RR 0.45, 95% CI 0.23 to 0.89; Analysis 5.1).
5.1.3 Long‐term (by 24 months)
We found one study to be relevant to this subgroup (128 participants). For this outcome, within this subgroup, we found evidence that CBT + supportive therapy was superior in its effects compared with supportive therapy (RR 0.32, 95% CI 0.11 to 0.92; Analysis 5.1).
5.1.4 Long‐term (by 4 years: additional follow‐up)
There is a single study in this subgroup (201 participants). For this subgroup, we did not find evidence of a clear difference between the two treatments (RR 0.58, 95% CI 0.31 to 1.12; Analysis 5.1).
5.2 Global state, specific: personal beliefs, average scores, long‐term (at 18 months), PBIQ‐R (higher score = worse)
For this outcome we found a single study, the data from which we divided into five subgroups.
5.2.1 Control
There is a single study in this subgroup (140 participants). We did not find a clear difference between CBT + supportive therapy and supportive therapy within this subgroup (MD −0.70, 95% CI −1.79 to 0.39; Analysis 5.2).
5.2. Analysis.
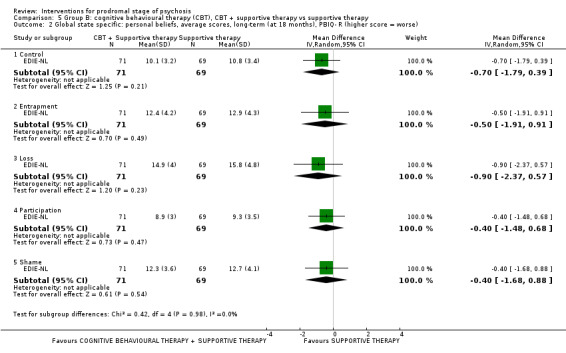
Comparison 5 Group B: cognitive behavioural therapy (CBT), CBT + supportive therapy vs supportive therapy, Outcome 2 Global state specific: personal beliefs, average scores, long‐term (at 18 months), PBIQ‐ R (higher score = worse).
5.2.2 Entrapment
We found one study to be relevant to this subgroup (140 participants). For this outcome, within this subgroup, we did not find evidence that CBT + supportive therapy was clearly different in its effects compared with supportive therapy (MD −0.50, 95% CI −1.91 to 0.91; Analysis 5.2).
5.2.3 Loss
There is a single study in this subgroup (140 participants). For this outcome, within this subgroup, we did not find evidence that CBT + supportive therapy was clearly different in its effects compared with supportive therapy (MD −0.90, 95% CI −2.37 to 0.57; Analysis 5.2).
5.2.4 Participation
We found one study to be relevant to this subgroup (140 participants). For this outcome, within this subgroup, we did not find evidence that CBT + supportive therapy was clearly different in its effects compared with supportive therapy (MD −0.40, 95% CI −1.48 to 0.68; Analysis 5.2).
5.2.5 Shame
We found one study to be relevant to this subgroup (140 participants). We did not find evidence of a clear difference between CBT + supportive therapy and supportive therapy within this subgroup (MD −0.40, 95% CI −1.68 to 0.88; Analysis 5.2).
5.3 Mental state 1, specific: social anxiety, average total score, long‐term (at 18 months), SAS (higher score = worse)
For this outcome we found a single study (28 participants). There was no clear difference between CBT + supportive therapy and supportive therapy (MD −3.60, 95% CI −12.34 to 5.14; Analysis 5.3).
5.3. Analysis.

Comparison 5 Group B: cognitive behavioural therapy (CBT), CBT + supportive therapy vs supportive therapy, Outcome 3 Mental state 1 specific: social anxiety, average total score, long‐term (at 18 months), SAS (higher score = worse).
5.4 Mental state 2, specific: average scores, various scales (higher score = worse), skewed data
These continuous data, from four studies, had such large standard deviations as to suggest that analysis within Review Manager 2014 would be inadvisable (see Analysis 5.4).
5.4. Analysis.
Comparison 5 Group B: cognitive behavioural therapy (CBT), CBT + supportive therapy vs supportive therapy, Outcome 4 Mental state 2 specific: average scores, various scales, higher score = worse, skewed data).
| Mental state 2 specific: average scores, various scales, higher score = worse, skewed data) | |||||
|---|---|---|---|---|---|
| Study | Intervention | Mean | SD | N | Note |
| Psychotic symptoms: total, average total score, medium‐term (at 12 months), PANSS | |||||
| EIPS‐Germany | CBT + Supportive therapy | 39.4 | 10.2 | 33 | |
| EIPS‐Germany | Supportive therapy | 39.1 | 9.9 | 35 | |
| Depression, average total score, medium‐term (at 12 months), BDI‐PC | |||||
| EDIE‐2‐UK | CBT + Supportive therapy | 5.41 | 5.12 | 93 | |
| EDIE‐2‐UK | Supportive therapy | 5.72 | 4.92 | 90 | |
| Depression, average total score, medium‐term (at 12 months), MADRS | |||||
| EIPS‐Germany | CBT + Supportive therapy | 10.3 | 8.8 | 32 | |
| EIPS‐Germany | Supportive therapy | 10.5 | 8.4 | 32 | |
| Depression, average total score, long‐term (at 18 months), BDI‐II | |||||
| EDIE‐NL | CBT + Supportive therapy | 9.6 | 9.4 | 71 | |
| EDIE‐NL | Supportive therapy | 11.3 | 11.1 | 69 | |
| Depression, average total score, long‐term (at 18 months), CDSS | |||||
| ADAPT‐Canada | CBT + Supportive therapy | 2.6 | 3.5 | 15 | |
| ADAPT‐Canada | Supportive therapy | 1.9 | 4.2 | 13 | |
| EDIE‐NL | CBT + Supportive therapy | 2.6 | 3.7 | 71 | |
| EDIE‐NL | Supportive therapy | 3.3 | 4.4 | 69 | |
| Psychotic symptoms: positive, average total score, medium‐term (at 12 months), PANSS | |||||
| EIPS‐Germany | CBT + Supportive therapy | 8.03 | 2.21 | 53 | |
| EIPS‐Germany | Supportive therapy | 7.67 | 1.33 | 52 | |
| Psychotic symptoms: negative, average total score, medium‐term (at 12 months), PANSS | |||||
| EIPS‐Germany | CBT + Supportive therapy | 8.19 | 1.7 | 53 | |
| EIPS‐Germany | Supportive therapy | 8.33 | 1.97 | 52 | |
| Psychosis risk symptoms: positive, average total score, long‐term (at 18 months), SOPS | |||||
| ADAPT‐Canada | CBT + Supportive therapy | 4.6 | 4.6 | 15 | |
| ADAPT‐Canada | Supportive therapy | 4.5 | 4.1 | 13 | |
| Psychosis risk symptoms: negative, average total score, long‐term (at 18 months), SOPS | |||||
| ADAPT‐Canada | CBT + Supportive therapy | 4.4 | 4.3 | 15 | |
| ADAPT‐Canada | Supportive therapy | 4.9 | 5.3 | 13 | |
| Social interaction and anxiety: average total score, medium‐term (at 12 months), SIAS | |||||
| EDIE‐2‐UK | CBT + Supportive therapy | 32.51 | 17.08 | 91 | |
| EDIE‐2‐UK | Supportive therapy | 29.99 | 16.6 | 87 | |
| Social interaction and anxiety: average total score, long‐term (at 18 months), SIAS | |||||
| ADAPT‐Canada | CBT + Supportive therapy | 26.6 | 15.9 | 15 | |
| ADAPT‐Canada | Supportive therapy | 29.1 | 18.6 | 13 | |
| EDIE‐NL | CBT + Supportive therapy | 22.2 | 13.8 | 71 | |
| EDIE‐NL | Supportive therapy | 20.3 | 15.2 | 69 | |
5.5 Functioning 1, global: average total score, GAF (higher score = better)
For this outcome we found three relevant studies and categorised data into two subgroups.
5.5.1 Medium‐term (at 12 months)
We found two studies to be relevant to this subgroup (294 participants). There was no clear difference between CBT + supportive therapy and supportive therapy within this subgroup (MD 5.97, 95% CI −1.33 to 13.27). For this outcome heterogeneity is high (Chi² = 5.54; df = 1.0; P = 0.02; I² = 82%; Analysis 5.5).
5.5. Analysis.

Comparison 5 Group B: cognitive behavioural therapy (CBT), CBT + supportive therapy vs supportive therapy, Outcome 5 Functioning 1 global: average total score, GAF, (higher score = better).
5.5.2 Long‐term (at 18 months)
There is a single study in this subgroup (28 participants). There was no clear difference between CBT + supportive therapy and supportive therapy within this subgroup (MD −3.20, 95% CI −14.05 to 7.65; Analysis 5.5).
5.6 Functioning 2.a, specific: social functioning, average total score, medium‐term (at 12 months), SAS II (higher score = worse)
There is a single study in this outcome (67 participants). We did not find evidence of a clear difference between CBT + supportive therapy and supportive therapy within this outcome (MD 0.40, 95% CI −0.07 to 0.87; Analysis 5.6). The results were imprecise as the confidence interval includes both no effect and appreciable benefit.
5.6. Analysis.

Comparison 5 Group B: cognitive behavioural therapy (CBT), CBT + supportive therapy vs supportive therapy, Outcome 6 Functioning 2.a specific: social functioning, average total score, medium‐term (at 12 months), SAS II (higher score = worse).
5.7 Functioning 2.b.i, specific: social functioning, average total score, long‐term (at 18 months), SFS (higher score = better)
We identified one study relevant to this outcome (28 participants). There was no clear difference between CBT + supportive therapy and supportive therapy (MD 9.10, 95% CI −5.65 to 23.85; Analysis 5.7).
5.7. Analysis.

Comparison 5 Group B: cognitive behavioural therapy (CBT), CBT + supportive therapy vs supportive therapy, Outcome 7 Functioning 2.b.i. specific: social functioning, average total score, long‐term (at 18 months), SFS (higher score = better).
5.8 Functioning 2.b.ii, specific: social functioning, average total score, medium‐term (at 18 months), SOFAS (higher score = better)
For this outcome we found a single study (140 participants). There was no clear difference between CBT + supportive therapy and supportive therapy (MD 2.00, 95% CI −2.39 to 6.39; Analysis 5.8).
5.8. Analysis.

Comparison 5 Group B: cognitive behavioural therapy (CBT), CBT + supportive therapy vs supportive therapy, Outcome 8 Functioning 2.b.ii. specific: social functioning, average total score, medium‐term (at 18 months), SOFAS (higher score = better).
5.9 Quality of life: average total score, long‐term (at 18 months), MANSA (higher score = better)
For this outcome we found a single study (140 participants). There was no clear difference between CBT + supportive therapy and supportive therapy (MD 1.50, 95% CI −2.93 to 5.93; Analysis 5.9).
5.9. Analysis.
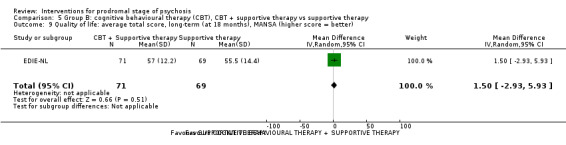
Comparison 5 Group B: cognitive behavioural therapy (CBT), CBT + supportive therapy vs supportive therapy, Outcome 9 Quality of life: average total score, long‐term (at 18 months), MANSA (higher score = better).
5.10 Cost: cumulative (USD) skewed data
These continuous data, from a single study, had such large standard deviations as to suggest that analysis within Review Manager 2014 would be inadvisable (see Analysis 5.10).
5.10. Analysis.
Comparison 5 Group B: cognitive behavioural therapy (CBT), CBT + supportive therapy vs supportive therapy, Outcome 10 Cost: cumulative, USD, skewed data.
| Cost: cumulative, USD, skewed data | |||||
|---|---|---|---|---|---|
| Study | Intervention | Mean | SD | N | Notes |
| Antipsychotic medication: 0‐18 months | |||||
| EDIE‐NL | CBT + supportive therapy | 3.2 | 15.12 | 95 | |
| EDIE‐NL | Supportive therapy | 5.11 | 15.17 | 101 | |
| Antipsychotic medication: by 4 years | |||||
| EDIE‐NL | CBT + supportive therapy | 35.86 | 96.21 | 95 | |
| EDIE‐NL | Supportive therapy | 48.28 | 111.91 | 101 | |
| Productivity costs: 0‐18 months | |||||
| EDIE‐NL | CBT + supportive therapy | ‐27.56 | 3936.82 | 95 | |
| EDIE‐NL | Supportive therapy | ‐843.49 | 3947.99 | 101 | |
| Service use: 0‐18 months | |||||
| EDIE‐NL | CBT + supportive therapy | 5829.76 | 10093.17 | 95 | |
| EDIE‐NL | Supportive therapy | 9505.17 | 16187.02 | 101 | |
| Service use: by 4 years | |||||
| EDIE‐NL | CBT + supportive therapy | 16506.54 | 24362.36 | 95 | |
| EDIE‐NL | Supportive therapy | 24452.73 | 40552.75 | 101 | |
| Travel: 0‐18 months | |||||
| EDIE‐NL | CBT + supportive therapy | 179.51 | 163.05 | 95 | |
| EDIE‐NL | Supportive therapy | 185.07 | 244.46 | 101 | |
| Travel: by 4 years | |||||
| EDIE‐NL | CBT + supportive therapy | 312.85 | 265.89 | 95 | |
| EDIE‐NL | Supportive therapy | 397.46 | 411.31 | 101 | |
| Total: 0‐18 months | |||||
| EDIE‐NL | CBT + supportive therapy | 8007.44 | 11225.57 | 95 | |
| EDIE‐NL | Supportive therapy | 8851.86 | 17179.7 | 101 | |
| Total: by 4 years | |||||
| EDIE‐NL | CBT + supportive therapy | 19121.35 | 24507.61 | 95 | |
| EDIE‐NL | Supportive therapy | 24898.47 | 40936.54 | 101 | |
5.11 Satisfaction with treatment: leaving the study early, end point data
For this outcome we found five relevant studies, the data from which we divided into two subgroups.
5.11.1 By between 1 year to 2 years
We found four studies to be relevant to this subgroup (668 participants). For this subgroup, we did not find evidence of a clear difference between the two treatments (RR 0.98, 95% CI 0.87 to 1.10; Analysis 5.11).
5.11. Analysis.
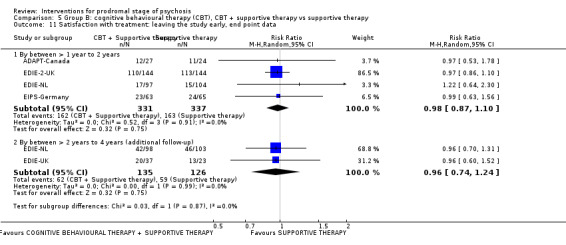
Comparison 5 Group B: cognitive behavioural therapy (CBT), CBT + supportive therapy vs supportive therapy, Outcome 11 Satisfaction with treatment: leaving the study early, end point data.
5.11.2 By between 2 years to 4 years (additional follow‐up)
We found two studies to be relevant to this subgroup (261 participants). For this subgroup, we did not find evidence of a clear difference between the two treatments (RR 0.96, 95% CI 0.74 to 1.24; Analysis 5.11).
6. Comparison: cognitive behavioural therapy + risperidone versus cognitive behavioural therapy + placebo
This comparison has seven outcomes.
6.1 Prodromal symptoms: transition to psychosis, end point data
We identified one study relevant to this outcome (87 participants). We did not find evidence of a clear difference between the two treatments in this comparison (RR 1.02, 95% CI 0.39 to 2.67; Analysis 6.1).
6.1. Analysis.

Comparison 6 Group B: cognitive behavioural therapy (CBT), CBT + risperidone vs CBT + placebo, Outcome 1 Prodromal symptoms: transition to psychosis, end point data.
6.2 Mental state, specific: average end point scores, medium‐term (at 12 months), various scales (higher score = worse), skewed data
These continuous data, from a single study, were too skewed to report in a graph (please see Analysis 6.2).
6.2. Analysis.
Comparison 6 Group B: cognitive behavioural therapy (CBT), CBT + risperidone vs CBT + placebo, Outcome 2 Mental state specific: average end point scores, medium‐term (at 12 months), various scales (higher score = worse), skewed data.
| Mental state specific: average end point scores, medium‐term (at 12 months), various scales (higher score = worse), skewed data | |||||
|---|---|---|---|---|---|
| Study | Intervention | Mean | SD | N | Note |
| Psychopathology: total, end point data, BPRS | |||||
| Yung‐Australia | Risperidone + CBT | 14 | 9.3 | 24 | |
| Yung‐Australia | Placebo + CBT | 16.5 | 11.1 | 27 | |
| Negative symptoms: attention, end point data, SANS | |||||
| Yung‐Australia | Risperidone + CBT | 1.7 | 1.6 | 24 | |
| Yung‐Australia | Placebo + CBT | 1.8 | 1.9 | 27 | |
| Negative symptoms: total, end point data, SANS | |||||
| Yung‐Australia | Risperidone + CBT | 17.8 | 13.8 | 24 | |
| Yung‐Australia | Placebo + CBT | 16.3 | 11.6 | 27 | |
6.3 Functioning, global: average end point score, medium‐term (at 12 months), GAF (higher score = better)
We identified one study relevant to this outcome (52 participants). There was no clear difference between CBT + risperidone and CBT + placebo (MD −2.00, 95% CI −6.55 to 2.55; Analysis 6.3).
6.3. Analysis.

Comparison 6 Group B: cognitive behavioural therapy (CBT), CBT + risperidone vs CBT + placebo, Outcome 3 Functioning global: average end point score, medium‐term (at 12 months), GAF (higher score = better).
6.4 Adverse effects 1, specific: doctors' assessment of adverse effects, medium‐term (at 12 months), UKU
We identified one study relevant to this outcome (65 participants). We did not find evidence of a clear difference between the two treatments in this comparison (RR 1.03, 95% CI 0.55 to 1.91; Analysis 6.4).
6.4. Analysis.

Comparison 6 Group B: cognitive behavioural therapy (CBT), CBT + risperidone vs CBT + placebo, Outcome 4 Adverse effects 1 specific: doctors' assessment of adverse effects, medium‐term (at 12 months), UKU.
6.5 Adverse effects 2, specific: adverse effects reported by participants, medium‐term (at 12 months), UKU
For this outcome we found a single study, with a total of 65 participants. There was no clear difference between CBT + risperidone and CBT + placebo (RR 2.01, 95% CI 0.9 to 4.53; Analysis 6.5).
6.5. Analysis.

Comparison 6 Group B: cognitive behavioural therapy (CBT), CBT + risperidone vs CBT + placebo, Outcome 5 Adverse effects 2 specific: adverse effects reported by participants, medium‐term (at 12 months), UKU.
6.6 Quality of life: average end point score, medium‐term (at 12 months), QLS (higher score = better)
We identified one study relevant to this outcome (51 participants). We did not find evidence of a clear difference between the two treatments in this comparison (MD 5.70, 95% CI −7.86 to 19.26; Analysis 6.6).
6.6. Analysis.
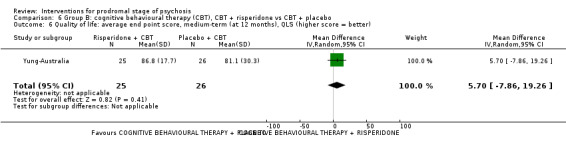
Comparison 6 Group B: cognitive behavioural therapy (CBT), CBT + risperidone vs CBT + placebo, Outcome 6 Quality of life: average end point score, medium‐term (at 12 months), QLS (higher score = better).
6.7 Satisfaction with treatment: leaving the study early, end point data
We identified one study relevant to this outcome (87 participants). There was no clear difference between CBT + risperidone and CBT + placebo (RR 1.09, 95% CI 0.62 to 1.92; Analysis 6.7).
6.7. Analysis.

Comparison 6 Group B: cognitive behavioural therapy (CBT), CBT + risperidone vs CBT + placebo, Outcome 7 Satisfaction with treatment: leaving the study early, end point data.
7. Comparison: cognitive behavioural therapy (specific preventive intervention) + needs‐based intervention + risperidone versus needs‐based intervention
This comparison has six outcomes.
7.1 Prodromal symptoms: transition to psychosis, end point data
We identified one study relevant to this outcome, the data from which we divided into two subgroups.
7.1.1 Medium‐term (at 12 months)
There is a single study in this subgroup (59 participants). There was no clear difference between CBT (specific preventive intervention (SPI)) + needs‐based intervention (NBI) + risperidone and NBI within this subgroup (RR 0.54, 95% CI 0.23 to 1.30; Analysis 7.1).
7.1. Analysis.

Comparison 7 Group B: cognitive behavioural therapy (CBT), CBT (specific preventive intervention (SPI) + needs‐based intervention (NBI) + risperidone vs NBI, Outcome 1 Prodromal symptoms: transition to psychosis, end point data.
7.1.2 Long‐term (up to 4 years)
We found one study to be relevant to this subgroup (59 participants). There was no clear difference between CBT (SPI) + NBI + risperidone and NBI within this subgroup (RR 0.75, 95% CI 0.39 to 1.46; Analysis 7.1).
7.2 Mental state, specific: average end point scores, various scales (high score = worse), skewed data
These continuous data, from a single study, had such large standard deviations as to suggest that analysis within Review Manager 2014 would be inadvisable (please see Analysis 7.2).
7.2. Analysis.
Comparison 7 Group B: cognitive behavioural therapy (CBT), CBT (specific preventive intervention (SPI) + needs‐based intervention (NBI) + risperidone vs NBI, Outcome 2 Mental state specific: average end point scores, various scales (high score = worse), skewed data.
| Mental state specific: average end point scores, various scales (high score = worse), skewed data | ||||
|---|---|---|---|---|
| Study | Intervention | Mean | SD | N |
| Anxiety: immediately post‐treatment, HRSA | ||||
| PACE‐Australia | Specific treatment intervention (SPI) | 10.73 | 5.67 | 23 |
| PACE‐Australia | Needs‐based intervention (NBI) | 11.41 | 9.92 | 17 |
| Anxiety: medium‐term (at 12 months), HRSA | ||||
| PACE‐Australia | Specific treatment intervention (SPI) | 11.59 | 9.73 | 23 |
| PACE‐Australia | Needs‐based intervention (NBI) | 12.57 | 10.68 | 17 |
| Anxiety: long‐term (at 4 years), HRSA | ||||
| PACE‐Australia | Specific treatment intervention (SPI) | 17.52 | 8.78 | 23 |
| PACE‐Australia | Needs‐based intervention (NBI) | 18.82 | 10.29 | 17 |
| Depression: immediately post‐treatment, HRSD | ||||
| PACE‐Australia | Specific treatment intervention (SPI) | 14.55 | 8.6 | 23 |
| PACE‐Australia | Needs‐based intervention (NBI) | 14.65 | 10.58 | 17 |
| Depression: medium‐term (at 12 months), HRSD | ||||
| PACE‐Australia | Specific treatment intervention (SPI) | 12.5 | 9.08 | 23 |
| PACE‐Australia | Needs‐based intervention (NBI) | 13.14 | 9.2 | 17 |
| Depression: long‐term (at 4 years), HRSD | ||||
| PACE‐Australia | Specific treatment intervention (SPI) | 22.91 | 11.25 | 23 |
| PACE‐Australia | Needs‐based intervention (NBI) | 25.82 | 13.42 | 17 |
| Mania: immediately post‐treatment, YMS | ||||
| PACE‐Australia | Specific treatment intervention (SPI) | 3.32 | 8.25 | 23 |
| PACE‐Australia | Needs‐based intervention (NBI) | 2.29 | 4.58 | 17 |
| Mania: medium‐term (at 12 months), YMS | ||||
| PACE‐Australia | Specific treatment intervention (SPI) | 1.19 | 3.01 | 23 |
| PACE‐Australia | Needs‐based intervention (NBI) | 1.64 | 3.37 | 17 |
| Mania: long‐term (at 4 years), YMS | ||||
| PACE‐Australia | Specific treatment intervention (SPI) | 10.43 | 9.13 | 23 |
| PACE‐Australia | Needs‐based intervention (NBI) | 8.55 | 7.18 | 17 |
| Negative symptoms: immediately post‐treatment, SANS | ||||
| PACE‐Australia | Specific treatment intervention (SPI) | 20.59 | 14.68 | 23 |
| PACE‐Australia | Needs‐based intervention (NBI) | 25.76 | 25.95 | 17 |
| Negative symptoms: medium‐term (at 12 months), SANS | ||||
| PACE‐Australia | Specific treatment intervention (SPI) | 23.05 | 19.95 | 23 |
| PACE‐Australia | Needs‐based intervention (NBI) | 22.5 | 16.02 | 17 |
| Negative symptoms: long‐term (at 4 years), SANS | ||||
| PACE‐Australia | Specific treatment intervention (SPI) | 31.74 | 16.25 | 23 |
| PACE‐Australia | Needs‐based intervention (NBI) | 27.0 | 22.84 | 17 |
| Psychopathology: total, immediately post‐treatment, BPRS | ||||
| PACE‐Australia | Specific treatment intervention (SPI) | 15.86 | 8.36 | 23 |
| PACE‐Australia | Needs‐based intervention (NBI) | 16.35 | 11.64 | 17 |
| Psychopathology: total, medium‐term (at 12 months), BPRS | ||||
| PACE‐Australia | Specific treatment intervention (SPI) | 17.77 | 9.01 | 23 |
| PACE‐Australia | Needs‐based intervention (NBI) | 17.07 | 10.51 | 17 |
| Psychopathology: total, long‐term (at 4 years), BPRS | ||||
| PACE‐Australia | Specific treatment intervention (SPI) | 26.33 | 11.39 | 23 |
| PACE‐Australia | Needs‐based intervention (NBI) | 22.47 | 11.28 | 17 |
7.3 Functioning, global: average end point score, GAF (higher score = better)
We identified one study relevant to this outcome and categorised data into two subgroups.
7.3.1 Medium‐term (at 12 months)
We found one study to be relevant to this subgroup (40 participants). There was no clear difference between CBT (SPI) + NBI + risperidone and NBI within this subgroup (MD −0.62, 95% CI −5.81 to 4.57; Analysis 7.3).
7.3. Analysis.

Comparison 7 Group B: cognitive behavioural therapy (CBT), CBT (specific preventive intervention (SPI) + needs‐based intervention (NBI) + risperidone vs NBI, Outcome 3 Functioning global: average end point score, GAF (higher score = better).
7.3.2 Long‐term (up to 4 years)
We found one study to be relevant to this subgroup (40 participants). For this subgroup, we did not find evidence of a clear difference between the two treatments (MD −2.40, 95% CI −12.32 to 7.52; Analysis 7.3).
7.4 Quality of life: average end point score, QLS (higher score = better)
For this outcome we found a single study, the data from which we divided into three subgroups.
7.4.1 immediately post‐treatment
We found one study to be relevant to this subgroup (40 participants). There was no clear difference between CBT (SPI) + NBI + risperidone and NBI within this subgroup (MD 2.83, 95% CI −13.07 to 18.73; Analysis 7.4).
7.4. Analysis.

Comparison 7 Group B: cognitive behavioural therapy (CBT), CBT (specific preventive intervention (SPI) + needs‐based intervention (NBI) + risperidone vs NBI, Outcome 4 Quality of life: average end point score, QLS (higher score = better).
7.4.2 Medium‐term (at 12 months)
We found one study to be relevant to this subgroup (40 participants). For this subgroup, we did not find evidence of a clear difference between the two treatments (MD −2.12, 95% CI −15.43 to 11.19; Analysis 7.4).
7.4.3 Long‐term (up to 4 years)
There is a single study in this subgroup (40 participants). For this subgroup, we did not find evidence of a clear difference between the two treatments (MD −2.03, 95% CI −16.90 to 12.84; Analysis 7.4).
7.5 Cost: average cost of treatment (AUD), skewed data
These continuous data (1 RCT) had such large standard deviations as to suggest that analysis within Review Manager 2014 would be inadvisable (please see Analysis 7.5).
7.5. Analysis.
Comparison 7 Group B: cognitive behavioural therapy (CBT), CBT (specific preventive intervention (SPI) + needs‐based intervention (NBI) + risperidone vs NBI, Outcome 5 Cost: average cost of treatment, AUD, skewed data.
| Cost: average cost of treatment, AUD, skewed data | ||||
|---|---|---|---|---|
| Study | Intervention | Mean | SD | N |
| Inpatient costs: post‐treatment | ||||
| PACE‐Australia | SPI | 367.6 | 1109.8 | 31 |
| PACE‐Australia | NPI | 1235.9 | 3477.9 | 28 |
| Inpatient costs: medium‐term (at 12 months) | ||||
| PACE‐Australia | SPI | 272.3 | 977.9 | 31 |
| PACE‐Australia | NPI | 226.1 | 847.8 | 28 |
| Inpatient costs: long‐term (at 36 months) | ||||
| PACE‐Australia | SPI | 757.1 | 3078.3 | 31 |
| PACE‐Australia | NPI | 866.6 | 2353.2 | 28 |
| Outpatient costs: post‐treatment | ||||
| PACE‐Australia | SPI | 2584.8 | 2522.4 | 25 |
| PACE‐Australia | NPI | 1084.0 | 940.0 | 27 |
| Outpatient costs: medium‐term (at 12 months) | ||||
| PACE‐Australia | SPI | 1328.8 | 1795.7 | 24 |
| PACE‐Australia | NPI | 1039.5 | 1384.8 | 23 |
| Pharmacology costs: post‐treatment | ||||
| PACE‐Australia | SPI | 223.3 | 235.4 | 25 |
| PACE‐Australia | NPI | 122.0 | 140.4 | 27 |
| Outpatient costs: long‐term (at 36 months) | ||||
| PACE‐Australia | SPI | 4101.6 | 8334.0 | 24 |
| PACE‐Australia | NPI | 10423.1 | 25277.3 | 17 |
| Pharmacology costs: medium‐term (at 12 months) | ||||
| PACE‐Australia | SPI | 119.8 | 300.6 | 24 |
| PACE‐Australia | NPI | 114.1 | 156.0 | 23 |
| Pharmacology costs: long‐term (at 36 months) | ||||
| PACE‐Australia | SPI | 588.2 | 1011.0 | 24 |
| PACE‐Australia | NPI | 446.6 | 883.2 | 17 |
| Total costs: post‐treatment | ||||
| PACE‐Australia | SPI | 3087.1 | 2926.2 | 25 |
| PACE‐Australia | NPI | 2487.6 | 3754.0 | 27 |
| Total costs: medium‐term (at 12 months) | ||||
| PACE‐Australia | SPI | 1800.3 | 2234.0 | 24 |
| PACE‐Australia | NPI | 1428.8 | 2330.3 | 23 |
| Total costs: long‐term (at 36 months) | ||||
| PACE‐Australia | SPI | 5667.6 | 11432.8 | 24 |
| PACE‐Australia | NPI | 11613.8 | 27120.7 | 17 |
7.6 Satisfaction with treatment: leaving the study early
For this outcome we found a single study and categorised data into two subgroups (59 participants). At medium‐term follow‐up (12 months) there were no dropouts in either group. At long‐term follow‐up (up to 4 years), we did not find evidence of a clear difference between the two treatments in this comparison (RR 0.57, 95% CI 0.26 to 1.28; Analysis 7.6).
7.6. Analysis.
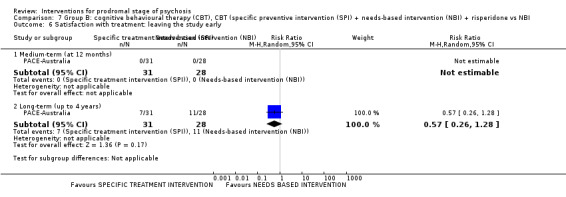
Comparison 7 Group B: cognitive behavioural therapy (CBT), CBT (specific preventive intervention (SPI) + needs‐based intervention (NBI) + risperidone vs NBI, Outcome 6 Satisfaction with treatment: leaving the study early.
Group C: differential effects
C.i Cognitive behavioural therapy
8. Comparison: cognitive behavioural therapy + placebo versus supportive therapy + placebo
There are seven outcomes in this comparison.
8.1 Prodromal symptoms: transition to psychosis, end point data
We found a single study relevant to this outcome (72 participants). There was no clear difference between CBT + placebo and supportive therapy + placebo (RR 0.74, 95% CI 0.28 to 1.98; Analysis 8.1).
8.1. Analysis.

Comparison 8 Group C: cognitive behavioural therapy (CBT), CBT + placebo vs supportive therapy + placebo, Outcome 1 Prodromal symptoms: transition to psychosis, end point data.
8.2 Mental state, specific: average end point scores, medium‐term (at 12 months), various scales (higher score = worse), skewed data
These continuous data, from a single study, had such large standard deviations as to suggest that data were very skewed and analysis within Review Manager 2014 would be inadvisable (Analysis 8.2).
8.2. Analysis.
Comparison 8 Group C: cognitive behavioural therapy (CBT), CBT + placebo vs supportive therapy + placebo, Outcome 2 Mental state specific: average end point scores, medium‐term (at 12 months), various scales (higher score = worse), skewed data.
| Mental state specific: average end point scores, medium‐term (at 12 months), various scales (higher score = worse), skewed data | |||||
|---|---|---|---|---|---|
| Study | Intervention | Mean | SD | N | Note |
| Psychopathology: total, end point data, BPRS | |||||
| Yung‐Australia | Placebo + CBT | 16.5 | 11.1 | 27 | |
| Yung‐Australia | Placebo + Supportive therapy | 15.3 | 10.1 | 18 | |
| Negative symptoms: attention, end‐point data, SANS | |||||
| Yung‐Australia | Placebo + CBT | 1.8 | 1.9 | 27 | |
| Yung‐Australia | Placebo + Supportive therapy | 1.4 | 1.9 | 18 | |
| Negative symptoms: total, end point data, SANS | |||||
| Yung‐Australia | Placebo + CBT | 16.3 | 11.6 | 27 | |
| Yung‐Australia | Placebo + Supportive therapy | 13.9 | 13.9 | 18 | |
8.3 Functioning, global: average end point scores, medium‐term (at 12 months), GAF (higher score = better)
We identified one study relevant to this outcome (45 participants). We did not find evidence of a clear difference between the two treatments (MD 2.20, 95% CI −4.59 to 8.99; Analysis 8.3).
8.3. Analysis.

Comparison 8 Group C: cognitive behavioural therapy (CBT), CBT + placebo vs supportive therapy + placebo, Outcome 3 Functioning global: average end point scores, medium‐term (at 12 months), GAF (higher score = better).
8.4 Adverse effects 1, specific: doctors' assessment of adverse effects, medium‐term (at 12 months), UKU
We identified one study relevant to this outcome (51 participants). We did not find evidence of a clear difference between the two treatments in this comparison (RR 1.39, 95% CI 0.61 to 3.18; Analysis 8.4).
8.4. Analysis.

Comparison 8 Group C: cognitive behavioural therapy (CBT), CBT + placebo vs supportive therapy + placebo, Outcome 4 Adverse effects 1 specific: doctors' assessment of adverse effects, medium‐term (at 12 months), UKU.
8.5 Adverse effects 2, specific: adverse effects reported by participants, medium‐term (at 12 months), UKU
We identified one study relevant to this outcome (51 participants). There was no clear difference between CBT + placebo and supportive therapy + placebo (RR 0.91, 95% CI 0.32 to 2.60; Analysis 8.5).
8.5. Analysis.

Comparison 8 Group C: cognitive behavioural therapy (CBT), CBT + placebo vs supportive therapy + placebo, Outcome 5 Adverse effects 2 specific: adverse effects reported by participants, medium‐term (at 12 months), UKU.
8.6 Quality of life: average end point scores, medium‐term (at 12 months), QLS (higher score = better)
We identified one study relevant to this outcome (44 participants). There was no clear difference between CBT + placebo and supportive therapy + placebo (MD −3.30, 95% CI, −18.76 to 12.16; Analysis 8.6).
8.6. Analysis.
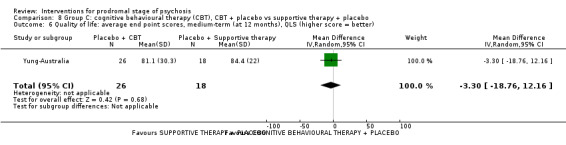
Comparison 8 Group C: cognitive behavioural therapy (CBT), CBT + placebo vs supportive therapy + placebo, Outcome 6 Quality of life: average end point scores, medium‐term (at 12 months), QLS (higher score = better).
8.7 Satisfaction with treatment: leaving the study early, end point data
For this outcome we found a single study involving 72 participants. We did not find evidence of a clear difference between the two treatments in this comparison (RR 1.06, 95% CI 0.54 to 2.09; Analysis 8.7).
8.7. Analysis.

Comparison 8 Group C: cognitive behavioural therapy (CBT), CBT + placebo vs supportive therapy + placebo, Outcome 7 Satisfaction with treatment: leaving the study early, end point data.
9. Comparison: cognitive behavioural therapy + supportive intervention versus non‐directive reflective listening + supportive intervention
Studies reported data on four outcomes.
9.1 Prodromal symptoms: transition to psychosis, end point data
We found a single study reporting this outcome (57 participants). We did not find evidence of a clear difference between the two treatments in this comparison (RR 6.32, 95% CI 0.34 to 117.09; Analysis 9.1).
9.1. Analysis.

Comparison 9 Group C: cognitive behavioural therapy (CBT), CBT + supportive intervention vs non‐directive reflective listening + supportive intervention, Outcome 1 Prodromal symptoms: transition to psychosis, end point data.
9.2 Functioning 1, global: average total score, short‐term (at 6 months), GAF (higher score = better)
We identified one study relevant to this outcome (34 participants). There was no clear difference between CBT + supportive intervention and non‐directive reflective listening (NDRL) + supportive intervention (MD −4.48, 95% CI −12.81 to 3.85; Analysis 9.2).
9.2. Analysis.
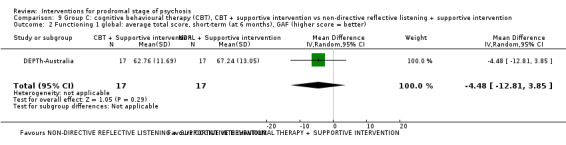
Comparison 9 Group C: cognitive behavioural therapy (CBT), CBT + supportive intervention vs non‐directive reflective listening + supportive intervention, Outcome 2 Functioning 1 global: average total score, short‐term (at 6 months), GAF (higher score = better).
9.3 Functioning 2, specific: social functioning, average total score, short‐term (at 6 months), SOFAS (higher score = better)
For this outcome we found a single study (34 participants). We did not find evidence of a clear difference between the two treatments in this comparison (MD −6.47, 95% CI −15.30 to 2.36; Analysis 9.3).
9.3. Analysis.

Comparison 9 Group C: cognitive behavioural therapy (CBT), CBT + supportive intervention vs non‐directive reflective listening + supportive intervention, Outcome 3 Functioning 2 specific: social functioning, average total score, short‐term (at 6 months), SOFAS (higher score = better).
9.4 Satisfaction with treatment: leaving the study early, end point data
One study was relevant (57 participants). We did not find evidence of a clear difference between the two treatments in this comparison (RR 1.35, 95% CI 0.81 to 2.25; Analysis 9.4).
9.4. Analysis.

Comparison 9 Group C: cognitive behavioural therapy (CBT), CBT + supportive intervention vs non‐directive reflective listening + supportive intervention, Outcome 4 Satisfaction with treatment: leaving the study early, end point data.
10. Comparison: cognitive behavioural therapy + risperidone versus supportive therapy + placebo
In this comparison, there were seven outcomes.
10.1 Prodromal symptoms: transition to psychosis, end point data
We identified one study relevant to this outcome (71 participants). There was no clear difference between CBT + risperidone and supportive therapy + placebo (RR 0.76, 95% CI 0.28 to 2.03; Analysis 10.1).
10.1. Analysis.

Comparison 10 Group C: cognitive behavioural therapy (CBT), CBT + risperidone vs supportive therapy + placebo, Outcome 1 Prodromal symptoms: transition to psychosis, end point data.
10.2 Mental state, specific: average end point scores, medium‐term (at 12 months), various scales (higher score = worse), skewed data
These continuous data, from a single study, were too skewed to report in a graph (please see Analysis 10.2).
10.2. Analysis.
Comparison 10 Group C: cognitive behavioural therapy (CBT), CBT + risperidone vs supportive therapy + placebo, Outcome 2 Mental state specific: average end point scores, medium‐term (at 12 months), various scales (higher score = worse), skewed data.
| Mental state specific: average end point scores, medium‐term (at 12 months), various scales (higher score = worse), skewed data | |||||
|---|---|---|---|---|---|
| Study | Intervention | Mean | SD | N | Note |
| Psychopathology: total, end point data, BPRS | |||||
| Yung‐Australia | Risperidone + CBT | 14 | 9.3 | 24 | |
| Yung‐Australia | Placebo + Supportive therapy | 15.3 | 10.1 | 18 | |
| Negative symptoms: attention, end point data, SANS | |||||
| Yung‐Australia | Risperidone + CBT | 1.7 | 1.6 | 24 | |
| Yung‐Australia | Placebo + Supportive therapy | 1.4 | 1.9 | 18 | |
| Negative symptoms: total, end point data, SANS | |||||
| Yung‐Australia | Risperidone + CBT | 17.8 | 13.8 | 24 | |
| Yung‐Australia | Placebo + Supportive therapy | 13.9 | 13.9 | 18 | |
10.3 Functioning, global: average end point score, medium‐term (at 12 months), GAF (higher score = better)
We identified one study relevant to this outcome (45 participants). There was no clear difference between CBT + risperidone and supportive therapy + placebo (MD 0.20, 95% CI −6.83 to 7.23; Analysis 10.3).
10.3. Analysis.

Comparison 10 Group C: cognitive behavioural therapy (CBT), CBT + risperidone vs supportive therapy + placebo, Outcome 3 Functioning global: average end point score, medium‐term (at 12 months), GAF (higher score = better).
10.4 Adverse effects 1, specific: doctors' assessment of adverse effects, medium‐term (at 12 months), UKU
For this outcome we found a single study (58 participants). There was no clear difference between CBT + risperidone and supportive therapy + placebo (RR 1.43, 95% CI 0.64 to 3.16; Analysis 10.4).
10.4. Analysis.

Comparison 10 Group C: cognitive behavioural therapy (CBT), CBT + risperidone vs supportive therapy + placebo, Outcome 4 Adverse effects 1 specific: doctors' assessment of adverse effects, medium‐term (at 12 months), UKU.
10.5 Adverse effects 2, specific: adverse effects reported by participants, medium‐term (at 12 months), UKU
For this outcome we found a single study (58 participants). We did not find evidence of a clear difference between the two treatments in this comparison (RR 1.83, 95% CI 0.77 to 4.34; Analysis 10.5).
10.5. Analysis.

Comparison 10 Group C: cognitive behavioural therapy (CBT), CBT + risperidone vs supportive therapy + placebo, Outcome 5 Adverse effects 2 specific: adverse effects reported by participants, medium‐term (at 12 months), UKU.
10.6 Quality of life: average end point scores, medium‐term (at 12 months), QLS (higher score = better)
For this outcome we found a single study (43 participants). We did not find evidence of a clear difference between the two treatments in this comparison (MD 2.40, 95% CI −9.91 to 14.71; Analysis 10.6).
10.6. Analysis.
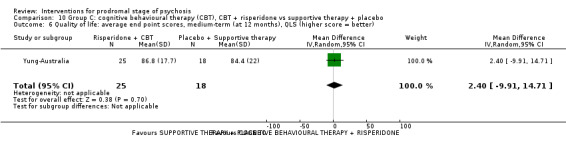
Comparison 10 Group C: cognitive behavioural therapy (CBT), CBT + risperidone vs supportive therapy + placebo, Outcome 6 Quality of life: average end point scores, medium‐term (at 12 months), QLS (higher score = better).
10.7 Satisfaction with treatment: leaving the study early, end point data
We identified one study relevant to this outcome (71 participants). There was no clear difference between CBT + risperidone and supportive therapy + placebo (RR 1.16, 95% CI 0.60 to 2.25; Analysis 10.7).
10.7. Analysis.

Comparison 10 Group C: cognitive behavioural therapy (CBT), CBT + risperidone vs supportive therapy + placebo, Outcome 7 Satisfaction with treatment: leaving the study early, end point data.
C.ii Other
11. Comparison: cognitive training versus active control (tablet games)
This comparison has nine outcomes.
11.1 Mental state 1, specific: average total scores, various scales (higher score = worse), skewed data
These continuous data, from two studies, were too skewed to report in a graph (please see Analysis 11.1).
11.1. Analysis.
Comparison 11 Group C: other, cognitive training vs active control (tablet games), Outcome 1 Mental state 1 specific: average total scores, various scales (higher score = worse), skewed data.
| Mental state 1 specific: average total scores, various scales (higher score = worse), skewed data | |||||
|---|---|---|---|---|---|
| Study | Intervention | Mean | SD | N | Note |
| Psychosis risk symptoms: total, average total score, long‐term (at 24 months), SOPS | |||||
| Vinogradov‐USA | Cognitive training | 33.9 | 16.4 | 50 | |
| Vinogradov‐USA | Tablet games | 25.49 | 17.23 | 33 | |
| Psychosis risk symptoms: negative, average total score, long‐term (at 24 months), SOPS | |||||
| Vinogradov‐USA | Cognitive training | 8.75 | 5.16 | 50 | |
| Vinogradov‐USA | Tablet games | 6.63 | 5.4 | 33 | |
| Psychosis risk symptoms: disorganised, average total score, long‐term (at 24 months), SOPS | |||||
| Vinogradov‐USA | Cognitive training | 11.03 | 8.13 | 50 | |
| Vinogradov‐USA | Tablet games | 9.38 | 4.65 | 33 | |
| Psychosis risk symptoms: general, average total score, long‐term (at 24 months), SOPS | |||||
| Vinogradov‐USA | Cognitive training | 7.83 | 5.37 | 50 | |
| Vinogradov‐USA | Tablet games | 6.02 | 5.63 | 33 | |
| Social anxiety: fear of negative evaluation, average end point score, short‐term (at 4 months), SAS‐A | |||||
| Choi‐USA | Cognitive training | 19.43 | 11.42 | 30 | |
| Choi‐USA | Tablet games | 18.78 | 11.73 | 32 | |
| Social anxiety: avoidance/distress in new situations, average end point score, short‐term (at 4 months), SAS‐A | |||||
| Choi‐USA | Cognitive training | 12.18 | 5.35 | 30 | |
| Choi‐USA | Tablet games | 15.73 | 8.24 | 32 | |
| Social anxiety: social avoidance and distress, average end point score, short‐term (at 4 months), SAS‐A | |||||
| Choi‐USA | Cognitive training | 8.87 | 4.03 | 30 | |
| Choi‐USA | Tablet games | 8.41 | 4.68 | 32 | |
11.2 Mental state 2, specific: depression, average end point score, short‐term (at 4 months), BDI‐II (higher score = worse)
For this outcome we found a single study (62 participants). There was no clear difference between cognitive training and active control (tablet games) (MD 0.99, 95% CI −1.72 to 3.7; Analysis 11.2).
11.2. Analysis.
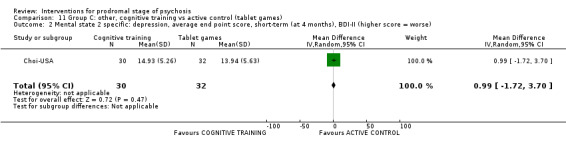
Comparison 11 Group C: other, cognitive training vs active control (tablet games), Outcome 2 Mental state 2 specific: depression, average end point score, short‐term (at 4 months), BDI‐II (higher score = worse).
11.3 Mental state 3.a, specific: cognitive, average end point score short‐term (at 4 months)
For this outcome we found a single study, the data from which we divided into two subgroups.
11.3.1 Processing speed (Minnesota Clerical Test, T score, higher score = better)
We found one study to be relevant to this subgroup (62 participants). We found evidence of a clear difference between cognitive training and active control (tablet games) within this subgroup, in favour of cognitive training (MD 6.25, 95% CI 1.70 to 10.80; Analysis 11.3).
11.3. Analysis.

Comparison 11 Group C: other, cognitive training vs active control (tablet games), Outcome 3 Mental state 3.a specific: cognitive, average end point score, short‐term (at 4 months).
11.3.2 Processing speed (Digit Symbol Coding, higher score = better)
There is a single study in this subgroup (62 participants). There was a clear difference between cognitive training and active control (tablet games) within this subgroup, in favour of cognitive training (MD 1.69, 95% CI 0.69 to 2.69; Analysis 11.3).
11.4 Mental state 3.b, specific: cognitive, average total score (presented as least square means estimated by the generalised linear mixed models), short‐term (at 3 months), MATRICS (higher score = better)
For this outcome we found a single study, the data from which we divided into six subgroups.
11.4.1 Attention/vigilance
There is a single study in this subgroup (25 participants). For this subgroup, we did not find evidence of a clear difference between the two treatments (MD −3.12, 95% CI −11.48 to 5.24; Analysis 11.4).
11.4. Analysis.

Comparison 11 Group C: other, cognitive training vs active control (tablet games), Outcome 4 Mental state 3.b specific: cognitive, average total score (presented as LSM = least square means estimated by the generalised linear mixed models), short‐term (at 3 months), MATRICS, higher score = better).
11.4.2 Speed of processing
There is a single study in this subgroup (25 participants). For this subgroup, we did not find evidence of a clear difference between the two treatments (MD −2.58, 95% CI −9.72 to 4.56; Analysis 11.4).
11.4.3 Reasoning and problem solving
There is a single study in this subgroup (25 participants). There was no clear difference between cognitive training and active control (tablet games) within this subgroup (MD −1.84, 95% CI −8.32 to 4.64; Analysis 11.4).
11.4.4 Verbal learning
There is a single study in this subgroup (25 participants). There was no clear difference between cognitive training and active control (tablet games) within this subgroup (MD −0.19, 95% CI −7.00 to 6.62; Analysis 11.4).
11.4.5 Visual learning
We found one study to be relevant to this subgroup (25 participants). There was no clear difference between cognitive training and active control (tablet games) within this subgroup (MD −4.39, 95% CI −11.10 to 2.32; Analysis 11.4).
11.4.6 Working memory
There is a single study in this subgroup (25 participants). There was no clear difference between cognitive training and active control (tablet games) within this subgroup (MD 3.56, 95% CI −4.88 to 12.0; Analysis 11.4).
11.5 Functioning 1, global: average total score, long‐term (at 24 months), GAF (higher score = better)
For this outcome we found a single study (83 participants). We did not find evidence of a clear difference between the two treatments in this comparison (MD 0.36, 95% CI −5.34 to 6.06; Analysis 11.5).
11.5. Analysis.

Comparison 11 Group C: other, cognitive training vs active control (tablet games), Outcome 5 Functioning 1 global: average total score, long‐term (at 24 months), GAF (higher score = better).
11.6 Functioning 2, specific: role functioning, GFR (higher score = better)
We identified two studies relevant to this outcome, the data from which we divided into two subgroups.
11.6.1 Role functioning: average total score (presented as least square means estimated by the generalised linear mixed models), short‐term (at 3 months)
We found one study to be relevant to this subgroup (25 participants). We found evidence of a clear difference between cognitive training and active control (tablet games) within this subgroup, in favour of active control (tablet games) (MD −1.27, 95% CI −1.84 to −0.70; Analysis 11.6).
11.6. Analysis.

Comparison 11 Group C: other, cognitive training vs active control (tablet games), Outcome 6 Functioning 2 specific: role functioning, GFR (higher score = better).
11.6.2 Role functioning: average total score, long‐term (at 24 months)
We found one study to be relevant to this subgroup (83 participants). For this outcome, within this subgroup, we did not find evidence that cognitive training was clearly different in its effects compared with active control (tablet games) (MD −0.23, 95% CI −1.37 to 0.91; Analysis 11.6).
11.7 Functioning 3.a, specific: social functioning, GFS (higher score = better)
For this outcome we found two relevant studies, the data from which we divided into two subgroups.
11.7.1 Social functioning: average total score (presented as least square means estimated by the generalised linear mixed models), short−term (at 3 months)
We found one study to be relevant to this subgroup (25 participants). For this outcome, within this subgroup, we did not find evidence that cognitive training was clearly different in its effects compared with active control (tablet games) (MD −0.68, 95% CI −2.12 to 0.76; Analysis 11.7).
11.7. Analysis.

Comparison 11 Group C: other, cognitive training vs active control (tablet games), Outcome 7 Functioning 3.a specific: social functioning, GFS (higher score = better).
11.7.2 Social functioning: average total score, long‐term (at 24 months)
There is a single study in this subgroup, which included a total of 83 participants. For this subgroup, we did not find evidence of a clear difference between the two treatments (MD 0.26, 95% CI −0.52 to 1.04; Analysis 11.7).
11.8 Functioning 3.b, specific: social functioning, average end point score, short‐term (at 4 months), SAS‐SR (higher score = worse)
We identified one study relevant to this outcome (62 participants). For this outcome, we found evidence that cognitive training was clearly different in its effects compared with active control (tablet games), in favour of cognitive training (MD −0.64, 95% CI −0.94 to −0.34; Analysis 11.8).
11.8. Analysis.

Comparison 11 Group C: other, cognitive training vs active control (tablet games), Outcome 8 Functioning 3.b specific: social functioning, average end point score, short‐term (at 4 months), SAS‐SR (higher score = worse).
11.9 Satisfaction with treatment: leaving the study early, end point data
For this outcome we found three relevant studies and categorised data into three subgroup (177 participants). There was no clear difference between cognitive training and active control (tablet games) (RR 0.93, 95% CI 0.82 to 1.05; Analysis 11.9).
11.9. Analysis.

Comparison 11 Group C: other, cognitive training vs active control (tablet games), Outcome 9 Satisfaction with treatment: leaving the study early, end point data.
11.9.1 Short‐term (by 2 months, PST)
There is a single study in this subgroup (62 participants). There was no clear difference between cognitive training and active control (tablet games) within this subgroup (RR 0.93, 95% CI 0.81 to 1.06; Analysis 11.9).
11.9.2 Medium‐term (by 9 months, AT)
We found one study to be relevant to this subgroup (32 participants). For this subgroup, we did not find evidence of a clear difference between the two treatments (RR 1.22, 95% CI 0.64 to 2.32; Analysis 11.9).
11.9.3 Long‐term (by 24 months, AT)
We found one study to be relevant to this subgroup, which included a total of 83 participants. For this subgroup, we did not find evidence of a clear difference between the two treatments (RR 0.78, 95% CI 0.48 to 1.29; Analysis 11.9).
12. Comparison: family treatment versus enhanced care
This comparison has seven outcomes.
12.1 Prodromal symptoms: transition to psychosis
We identified two studies relevant to this outcome and categorised data into two subgroups (229 participants). We did not find evidence of a clear difference between the two treatments in this comparison (RR 0.54, 95% CI 0.18 to 1.59).
12.1.1 Short‐term (6 months, FFT)
There is a single study in this subgroup (129 participants). There was no clear difference between family treatment and enhanced care within this subgroup (RR 0.19, 95% CI 0.02 to 1.59; Analysis 12.1).
12.1. Analysis.
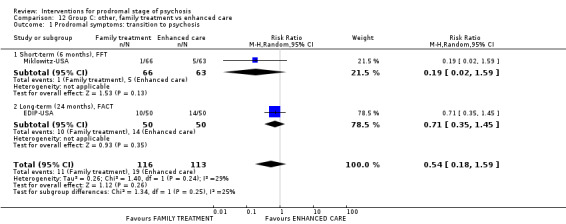
Comparison 12 Group C: other, family treatment vs enhanced care, Outcome 1 Prodromal symptoms: transition to psychosis.
12.1.2 Long‐term (24 months, FACT)
We found one study to be relevant to this subgroup (100 participants). For this subgroup, we did not find evidence of a clear difference between the two treatments (RR 0.71, 95% CI 0.35 to 1.45; Analysis 12.1).
12.2 Global state: antipsychotic prescription, short‐term (by 6 months)
For this outcome we found a single study (129 participants). There was no clear difference between family treatment and enhanced care (RR 1.18, 95% CI 0.69 to 2.02; Analysis 12.2).
12.2. Analysis.

Comparison 12 Group C: other, family treatment vs enhanced care, Outcome 2 Global state: antipsychotic prescription, short‐term (by 6 months).
12.3 Mental state, specific: psychosis risk, positive symptoms, average total score, short‐term (at 6 months), SOPS positive (higher score = worse)
For this outcome we found a single study (102 participants). There was a clear difference between family treatment and enhanced care, in favour of family treatment (MD −2.01, 95% CI −3.87 to −0.15; Analysis 12.3).
12.3. Analysis.

Comparison 12 Group C: other, family treatment vs enhanced care, Outcome 3 Mental state specific: psychosis risk positive symptoms, average total score, short‐term (at 6 months), SOPS positive (higher score = worse).
12.4 Functioning, global: average total score, long‐term (at 24 months), GAF (higher score = better)
For this outcome we found a single study (69 participants). We did not find evidence of a clear difference between the two treatments in this comparison (MD 5.15, 95% CI −1.90 to 12.20; Analysis 12.4).
12.4. Analysis.
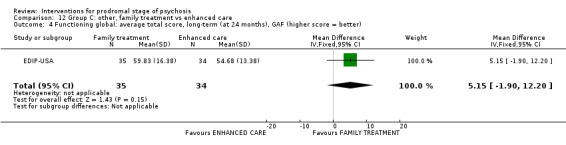
Comparison 12 Group C: other, family treatment vs enhanced care, Outcome 4 Functioning global: average total score, long‐term (at 24 months), GAF (higher score = better).
12.5 Adverse events 1.a, specific: suicide, events, long‐term (by 24 months)
We identified one study relevant to this outcome (100 participants). We did not find evidence of a clear difference between the two treatments in this comparison (RR 1.00, 95% CI 0.06 to 15.55; Analysis 12.5).
12.5. Analysis.

Comparison 12 Group C: other, family treatment vs enhanced care, Outcome 5 Adverse events 1.a specific: suicide, long‐term (by 24 months), events.
12.6 Adverse events 1.b, specific: suicide, participants affected/at risk, long‐term (by 24 months)
We identified one study relevant to this outcome (100 participants). There was no clear difference between family treatment and enhanced care (RR 1.00, 95% CI 0.06 to 15.55; Analysis 12.6).
12.6. Analysis.

Comparison 12 Group C: other, family treatment vs enhanced care, Outcome 6 Adverse events 1.b specific: suicide, long‐term (by 24 months), participants affected/at risk.
12.7 Satisfaction with treatment: leaving the study early
We identified two studies relevant to this outcome and categorised data into two subgroups (229 participants). There was no clear difference between family treatment and enhanced care (RR 0.81, 95% CI 0.52 to 1.26; Analysis 12.7).
12.7. Analysis.
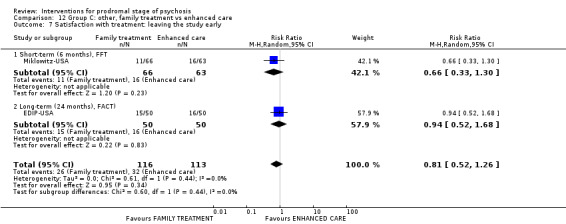
Comparison 12 Group C: other, family treatment vs enhanced care, Outcome 7 Satisfaction with treatment: leaving the study early.
12.7.1 Short‐term (6 months, FFT)
There is a single study in this subgroup (129 participants). For this subgroup, we did not find evidence of a clear difference between the two treatments (RR 0.66, 95% CI 0.33 to 1.30; Analysis 12.7).
12.7.2 Long‐term (24 months, FACT)
We found one study to be relevant to this subgroup (100 participants). There was no clear difference between family treatment and enhanced care within this subgroup (RR 0.94, 95% CI 0.52 to 1.68; Analysis 12.7).
13. Comparison: integrated treatment versus standard treatment
There were three outcomes in this comparison.
13.1 Prodromal symptoms: transition to psychosis, end point data, long‐term (by 2 years)
For this outcome we found a single study (79 participants). We did not find evidence of a clear difference between the two treatments in this comparison (RR 0.57, 95% CI 0.28 to 1.15; Analysis 13.1).
13.1. Analysis.

Comparison 13 Group C: other, integrated treatment vs standard treatment, Outcome 1 Prodromal symptoms: transition to psychosis, end point data, long‐term (by 2 years).
13.2 Mental state, specific: average total score, long‐term (at 2 years), various scales (higher score = worse), skewed data
These continuous data, from a single study, were too skewed to report in a graph (please see Analysis 13.2).
13.2. Analysis.
Comparison 13 Group C: other, integrated treatment vs standard treatment, Outcome 2 Mental state specific: average total score, long‐term (at 2 years), various scales (higher score = worse), skewed data.
| Mental state specific: average total score, long‐term (at 2 years), various scales (higher score = worse), skewed data | |||||
|---|---|---|---|---|---|
| Study | Intervention | Mean | SD | N | Note |
| Negative symptoms: total average score, SANS | |||||
| Nordentoft‐Denmark | Integrated treatment | 1.34 | 1.33 | 32 | |
| Nordentoft‐Denmark | Standard treatment | 1.7 | 1.23 | 25 | |
13.3 Satisfaction with treatment: leaving the study early, end point data
We identified one study relevant to this outcome (79 participants). We did not find evidence of a clear difference between the two treatments in this comparison (RR 0.66, 95% CI 0.25 to 1.73; Analysis 13.3).
13.3. Analysis.
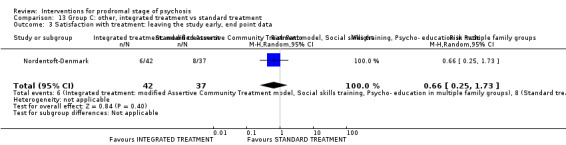
Comparison 13 Group C: other, integrated treatment vs standard treatment, Outcome 3 Satisfaction with treatment: leaving the study early, end point data.
Discussion
There is the impression that in this whole area there is a triumph of hope over adversity. There is the repeated hope invested in another ‐ often unique ‐ study question and then a study of fewer than 100 participants is completed. This results in the set of comparisons reported here, all of which are too under‐powered to really highlight clear differences. With more agreement, collaboration and co‐ordination across research teams in this area it might have been possible to find if, to take one example, cognitive therapy was truly more valuable than a simpler supportive approach. The diversity of underpowered testing in this area has left important questions still in doubt after well over a decade of highly‐expensive, and, no doubt, career‐enhancing, studies.
To summarise the main findings we used outcomes chosen at review protocol stage for presentation in the 'Summary of findings' tables. No comparison reported data on all seven outcomes and we often had to use proxy measures. No comparison, however, reported explicitly on 'behaviour'. It is possible that this is thought to be covered by reporting 'global state' or 'mental state' but we still think it is reasonable to have included it in the original list. It is not difficult to report and is of great importance to carers.
| Pre‐defined 'Summary of findings' table outcome |
Comparison number (within clusters A‐C) |
||||||||||||||
| A | B | C | |||||||||||||
| 1 | 2 | 3 | 4 | 5 | 6 | 7 | 8 | 9 | 10 | 11 | 12 | 13 | |||
| Prodromal symptoms: transition to psychosis | ✔ | ✔ | ✔ | ✔ | ✔ | ✔ | ✔ | ✔ | ✔ | ✔ | ✔ | ✔ | |||
| Global state: clinically important change in global state | ✔ | ✔ | ✔ | ||||||||||||
| Mental state: clinically important change in mental state | ✔ | ✔ | ✔ | ✔ | ✔ | ✔ | ✔ | ✔ | ✔ | ✔ | |||||
| Behaviour: any change in behaviour | |||||||||||||||
| Adverse effects: at least one serious adverse event | ✔ | ✔ | ✔ | ✔ | ✔ | ✔ | ✔ | ✔ | |||||||
| Quality of life: any change in quality of life | ✔ | ✔ | ✔ | ✔ | ✔ | ||||||||||
| Satisfaction with treatment: leaving the study early | ✔ | ✔ | ✔ | ✔ | ✔ | ✔ | ✔ | ✔ | ✔ | ✔ | ✔ | ✔ | ✔ | ||
Summary of main results
Group A: absolute effects
Group A's interventions involved giving amino acids or omega‐3 and comparing these with placebo. Both comparisons involved low numbers of studies that were likely to be of very limited power. Data quality, at best, was low. There is no suggestion that amino acids have an effect. Adding omega‐3 did change both transition to psychosis and use of antipsychotic drugs in one small study but over a seven‐year follow‐up.
1. Amino acids compared to placebo for prodromal stage of psychosis
Please see Table 1.
1.1 Transition to psychosis, end point data
Very low‐quality evidence from two small studies (52 participants in total) failed to find a clear difference for this outcome.
1.2 Psychosis risk symptoms, measured with SOPS total
Mental state was monitored using the SOPS, rating psychosis risk symptoms. No clear difference was apparent. This result is based on very low‐quality evidence from one small study with data for only eight participants.
1.3 Adverse events: suicidal thoughts
Suicidal thoughts were rarely experienced (one person out of 20 in the experimental versus zero out of 24 in the placebo group) and it may have not been the best effect for us to highlight in our 'Summary of findings' table. However, in a broader range of general and specific adverse effects than are reported in the other comparisons within this review there was no real indication that the use of amino acids caused problems. Results are based on very low‐quality evidence from one small study with data for 44 participants.
1.4 Satisfaction with treatment, measured as number of individuals leaving the study early
A little under half of the participants left early with no clear difference between groups (very low‐quality evidence, 2 RCTs, 52 participants).
1.5 Missing outcomes
None of the studies reported usable data on global state, behaviour or quality of life.
2. Omega‐3 fatty acids compared to placebo for prodromal stage of psychosis
Please see Table 2.
2.1 Transition to psychosis
A lower number of participants in the intervention group treated with omega‐3 fatty acids transitioned to psychosis during long‐term follow‐up of seven years, compared to the placebo group (˜10% versus ˜33%, RR 0.24, 95%, 95% CI 0.09 to 0.67, low‐quality evidence, 1 RCT, 81 participants). If this outcome was an isolated positive finding there would be the strong suspicion that it was the result of the play of chance. However this is not necessarily the case with other outcomes also favouring the omega‐3 group (see below). All outcomes are low quality. All are from small studies undertaken by those probably who are prone to favour the omega‐3 group and biases can always creep in. However, these are rare positive findings, and have some limited consistency and may well be worthy of further investigation.
2.2 Global state, measured with number of antipsychotic prescriptions
A significantly lower number of participants allocated to omega‐3 fatty acids had antipsychotic prescriptions during follow‐up of seven years, compared to those allocated to the placebo group (RR 0.54, 95% CI 0.30 to 0.99, low‐quality evidence, 1 RCT, 69 participants).
2.3 Mental state, measured with PANSS total
Participants in the intervention group had significantly lower mean scores for psychotic symptoms (measured by PANSS total, scale from 30 to 210, MD 11.4 points lower, 95% CI 20.55 points lower to 2.25 lower, low‐quality evidence, 1 RCT, 81 participants).
2.4 Adverse effects, neurological extrapyramidal symptoms measured with UKU Side Effect Rating Scale
Although more participants in the intervention group treated with omega‐3 fatty acids developed neurological extrapyramidal symptoms in follow‐up by 12 months compared to the placebo group, the results did not reach conventional levels of statistical significance (RR 2.57, 95% CI 0.94 to 7.02, low‐quality evidence, 1 RCT, 304 participants).
2.5 Satisfaction with treatment, measured as number of individuals leaving the study early
About 25% of each group left the study early with no clear difference between groups (1 RCT, 81participants).
2.6 Missing outcomes
No study reported usable data on behaviour or quality of life.
Group B: comparisons where it is unclear how interaction has affected the interventions
B.i Antipsychotic drugs
We were unclear if amisulpiride could interact with the needs‐focused intervention (NFI) or olanzapine with supportive therapy. In any event, data for the amisulpiride‐NFI comparison are so few and poor that no conclusion is warranted and those for the addition of olanzapine to supportive therapy are also limited in size and quality, so as to make firm conclusions impossible. There is no hint of an underlying effect.
3. Amisulpiride + needs‐focused intervention compared to needs‐focused intervention for prodromal stage of psychosis
Please see Table 3.
3.1 Adverse events: suicidal thoughts
There was no difference between groups for a series of adverse events, including suicidal thoughts, and very few events in each group (very low‐quality evidence, 1 RCT, 102 participants).
3.2 Satisfaction with treatment, measured as number of individuals leaving the study early
Fewer participants (around 30%) left the group assigned to also take amisulpiride, compared with those needs‐focused intervention (NFI only group (nearly 60% loss to follow‐up, RR 0.59, 95% CI 0.38 to 0.94, very low‐quality evidence, 1 RCT, 124 participants). Of course 'leaving early' is difficult to interpret and it is hard to be confident that this truly represents satisfaction. This could be a chance finding in many, but could also be a real expression of something. Most negatively it could be seen as a function of inertia facilitated by use of an antipsychotic ‐ but on the other hand it could represent a real expression of satisfaction mediated by some sort of improvement caused by use of the drug.
3.3 Missing outcomes
There are particularly few usable data for this comparison. No study reported usable data on transition to psychosis, global state, mental state, behaviour or quality of life.
4. Olanzapine + supportive intervention compared to placebo + supportive intervention for prodromal stage of psychosis
Please see Table 4.
4.1 Transition to psychosis
Although a lower number of participants in the intervention group treated with a combination of olanzapine and supportive intervention transitioned to psychosis during follow‐up of 12 months, compared to control group treated with a combination of placebo and supportive intervention (˜25% versus ˜40%), these results were imprecise and do not meet conventional levels of statistical significance (RR 0.58, 95% CI 0.28 to 1.18, 1 RCT, 60 participants; very low‐quality evidence).
4.2 Global illness severity, measured by CGI
Nor was there a clear difference between groups for a continuous measure of global severity of illness (very low‐quality evidence, 1 RCT, 59 participants).
4.3 Psychosis risk symptoms, measured with SOPS total
For mental state, again, there was no clear difference between groups when a specific scale was employed to identify 'psychosis risk symptoms'. This result is based on very low‐quality evidence from one small study with data for 59 participants.
4.4 Adverse effects: average weight gain in kg
Unsurprisingly, for those who are familiar with use of and evidence around olanzapine, significantly ‐ statistically and clinically ‐ higher weight gain was observed in the intervention group. The average weight gain in the intervention group was approaching 5 kg (95% CI 2 kg to 7 kg higher). This is an important and well‐recognised adverse effect of this particular compound. In itself this could be enough to discourage use of olanzapine for this group of participants but as there are no clear effects ‐ or suggestion of effects ‐ in other outcomes, embarking on use of olanzapine in this group would seem very ill‐advised.
4.5 Satisfaction with treatment, measured as number of individuals leaving the study early
There was no difference between the participants treated with a combination of olanzapine and supportive intervention and those treated with a combination of placebo and supportive intervention in terms of number of participants leaving the study early in a follow‐up by 12 months. Around half left the single study (60 participants).
4.6 Missing outcomes
No study reported usable data on behaviour or quality of life.
B.ii Cognitive behavioural therapy
All findings within the CBT subgroup are equivocal except for outcome 5.1 (see below) where CBT added to supportive therapy did better for 'transition to psychosis' than supportive therapy alone (at 18 months). This is one finding out of many and is not of high quality. Several complex packages have been tested involving variations of treatments using a CBT ethos but all effects of these considerable complex and skilled efforts are unconvincing as to there being true benefit.
5. Cognitive behavioural therapy + supportive therapy versus supportive therapy
Please see Table 5.
5.1 Transition to psychosis
Around 8% of participants treated allocated to the combination of CBT and supportive therapy transitioned to psychosis during follow‐up by 18 months, compared with double that percentage in the supportive therapy alone group (RR 0.45, 95% CI 0.23 to 0.89; 2 RCTs, 252 participants; very low‐quality evidence). The finding chosen for the summary table was the medium‐term outcome but this finding is consistent ‐ and encouraging across all time periods (Analysis 5.1). Crudely calculated using the shorter‐term data, the number of participants needed to treat for around one year to avoid one transition in that time period is 13. It is difficult to know if this investment would be cost effective. The skilled therapists in these studies are not universal and biases in the studies would likely favour the CBT group. In addition, what data there are in Analysis 5.1 suggests some diminution of effect across time. Transition may be postponed rather than avoided. If this is not the result of the play of chance, any effect for transition to psychosis is likely to be modest in everyday clinical life.
5.2 Mental state, measured with SAS
Very low‐quality evidence from one study (28 participants) finds no clear difference between groups.
5.3 Quality of life measured with MANSA
More evidence that we had to judge as being of very low quality (1 RCT, 140 participants) failed to highlight any differences between groups.
5.4 Satisfaction with treatment, measured as number of individuals leaving the study early
This also applied to the outcome of satisfaction with care, with around half leaving their group of allocation early (Analysis 5.11).
5.5 Missing outcomes
None of the studies reported usable data on global state, behaviour or adverse effects. Other, not dissimilar studies have, and more consistency in outcome reporting would have helped us compare across comparisons.
6. Cognitive behavioural therapy + risperidone versus cognitive behavioural therapy + placebo
Please see Table 6.
6.1 Transition to psychosis, end point data
There is no evidence that adding risperidone to CBT does anything for any outcome including transition to psychosis (1 RCT, 87 participants; very low‐quality evidence).
6.2 Mental state: psychopathology measured with BPRS
Imprecise, very low‐quality evidence found no difference between groups in terms of a mental state measure (1 RCT, 52 participants).
6.3 Doctors' assessment of adverse effects measured with UKU Side Effect Rating Scale
Although there were more adverse effects in the risperidone group, the difference did not reach conventional levels of statistical significance (1 RCT, 65 participants; very low‐quality evidence).
6.4 Quality of life measured with QLS
One small study (51 participants) reports evidence that we had to rate as being of very low‐quality evidence with no difference between groups.
6.5 Satisfaction with treatment, measured as number of individuals leaving the study early
All continuous data for the single relevant study (Yung‐Australia), were completer data and there is a danger that randomisation was compromised by this. Leaving the study early is, however, reported for everyone and there was no difference between groups, with around 30% of both groups leaving early (87 participants). Again, this is hard to interpret with no additional information but it is encouraging that the addition of risperidone did not clearly increase the considerable attrition.
6.6 Missing outcomes
None of the studies reported usable data on global state or behaviour. It could be interpreted that outcomes already there covered these and further recording was unnecessary. We feel, however, that more explicit recording would not have complicated the study and would have been of interest to many.
7. Cognitive behavioural therapy (specific preventive intervention) + needs‐based intervention + risperidone compared to needs‐based intervention for prodromal stage of psychosis
Please see Table 7.
7.1 Transition to psychosis
We found no clear difference between the two complex packages of care for this important outcome. This result is based on very low‐quality evidence from one small study (59 participants).
7.2 Mental state: psychopathology measured with BPRS
The continuous mental state measure (BPRS) highlighted no difference between groups and, again, we had to grade these data as being of very low quality (1 RCT, 40 participants).
7.3 Quality of life measured with QLS
Exactly the same applied to the QLS score.
7.4 Satisfaction with treatment, measured as number of individuals leaving the study early
There was no difference between the intervention group, treated with a combination of SPI, CBT, NBI and risperidone and the control group in terms of number of participants leaving the study early in a follow‐up of up to four years. Overall there were impressively low numbers of participants lost to follow‐up with none at 12 months, rising to around 20% by four years. This result is based on evidence that we had to rate as being of very low quality (1 RCT, 59 participants).
7.5 Missing outcomes
None of the studies reported usable data on global state, behaviour or adverse effects and several of the findings that had to be used were proxies for simpler and, we argue, more useful outcomes.
Group C: differential effects
C.i. Cognitive behavioural therapy
When CBT is directly compared with another treatment, for the broad prespecified 'Summary of findings' outcomes, much of the evidence was of very low quality and none showed a suggestion of clear differences between interventions.
8. Cognitive behavioural therapy + placebo versus supportive therapy + placebo
Please see Table 8.
8.1 Transition to psychosis, end point data
In a small study (72 participants) there was no clear difference between those allocated to CBT and those receiving a low grade, supportive therapy (RR 0.74, 95% CI 0.28 to 1.98). It is possible that this very low‐quality evidence hides a real effect but impossible to know at this point.
8.2 Mental state: psychopathology measured with BPRS
The continuous proxy measure we had to use (BPRS) indicated that the CBT group was not better than the control group (45 participants; very low‐quality evidence). The finding that the CBT group was 2.2 points higher (worse) was compatible with also being 5 points lower to 9 points higher compared with the control group and we found no clear clinical explanation of these findings.
8.3 Doctors' assessment of adverse effects measured with UKU
There was no clear difference in adverse effects between groups at 12 months (51 participants; very low‐quality evidence). It is good to see how the possibility of adverse effects of talking approaches is being considered in studies.
8.4 Quality of life measured with QLS
There was no difference between the mean QLS score (a proxy for what was prestipulated in the review's protocol) at 12 months' follow‐up in the CBT and control group. The score for the intervention group was 3.3 points lower but 95% CI indicated that the result could be 19 points lower to 12 points higher compared to the control group on a scale from 0 to 126. That the finding is equivocal is helpful as we are unclear of the meaning of the range of figures and have found no explanation of these. In any event, this result is based on very low‐quality evidence from one small study with data for 44 participants.
8.5 Satisfaction with treatment, measured as number of individuals leaving the study early
Approaching 30% of each group left the groups early. It is hard to know what this means. This level of attrition could be expected from the client group, or could reflect badly on either the intervention or study design (72 participants).
8.6 Missing outcomes
None of the studies reported usable data on global state or behaviour. It could be that these outcomes are covered by what has been reported but it would be better to have been certain of the effects of these interventions on simple outcomes clearly falling into these categories.
9. Cognitive behavioural therapy + supportive intervention versus non‐directive reflective listening + supportive intervention
Please see Table 9.
9.1 Transition to psychosis, end point data
In a group treated with a combination of CBT and supportive therapy, three participants transitioned to psychosis (out of 30), while in the control group none of the 27 analysed participants transitioned to psychosis. As the study was small, results were imprecise and we remain unclear if one or other intervention approach remains a risk. This result is based on very low‐quality evidence.
9.2 Satisfaction with treatment, measured as number of individuals leaving the study early
There was no difference between groups in terms of number of participants leaving the study early (1 RCT, 57 participants) but over half left the CBT + supportive therapy group.
9.3 Missing outcomes
None of the studies reported usable data on global or mental state, behaviour, adverse effects, or quality of life. Other, not dissimilar studies have, and more consistency in outcome reporting would have helped us compare across comparisons.
10. Cognitive behavioural therapy + risperidone compared to supportive therapy + placebo for prodromal stage of psychosis
Please see Table 10.
10.1 Transition to psychosis, end point data
We found no clear difference between those allocated to a combination of CBT and risperidone compared to a combination of supportive therapy and placebo but data were of very low quality (1 RCT, 71 participants).
10.2 Mental state: psychopathology measured with BPRS
Few, very low‐quality data (1 RCT, 45 participants) reported on a mental state outcome with no clear difference between groups.
10.3 Doctors' assessment of adverse effects measured with UKU Side Effect Rating Scale
Although more adverse effects were apparent in the risperidone group, there was no clear, statistically significant or clinically important difference (very low‐quality, 1 RCT, 58 participants).
10.4 Quality of life measured with QLS
The continuous score used to measure quality of life was also equivocal (very low‐quality evidence, 1 RCT, 43 participants).
10.5 Satisfaction with treatment, measured as number of individuals leaving the study early
Finally, about 30% of participants left each group before study completion. There was no difference between groups (1 RCT, 71 participants; very low‐quality evidence).
10.6 Missing outcomes
None of the studies reported usable data on global state or behaviour. As for many of the other comparisons, there are so few data for other outcomes ‐ all provided by one pioneering but single study (Yung‐Australia), that we are left partially reassured that conducting evaluative studies in this area is possible but also thinking that clinicians, policy makers and above all those with prodromal signs of schizophrenia have been let down by the research fraternity and the latter's lack of co‐ordination and collaboration.
C.ii Other
Finally, in the last three comparisons, for the key outcomes of interest, there was no suggestion of any of the approaches having a clear effect.
11. Cognitive training compared to active control (tablet games) for prodromal stage of psychosis
Please see Table 11.
11.1 Psychosis risk symptoms, measured with SOPS total
The equivocal result is based on use of a proxy measure and we had to grade this evidence as being of very low quality (1 RCT, 62 participants).
11.2 Satisfaction with treatment, measured as number of individuals leaving the study early
Overall, over half of all participants left the studies before completion (˜24 months). There was no difference between groups (3 RCTs, 177 participants). It is difficult to say if this is more to do with study design than the true acceptability of the approaches.
11.3 Missing outcomes
There are particularly few usable data for this comparison. No studies reported on global state, mental state, behaviour, adverse effects or quality of life.
12. Family treatment compared to enhanced care for prodromal stage of psychosis
Please see Table 12.
12.1 Transition to psychosis
There was no clear difference found between the packages of care for this important outcome. This result is based on very low‐quality evidence from one small study (100 participants).
12.2 Global state, measured with number of antipsychotic prescriptions
We found no clear difference for this proxy measure of global state (very low‐quality evidence, 1 RCT, 129 participants).
12.3 Psychosis risk, positive symptoms, measured with SOPS positive scale
In the group treated with family treatment, the mean SOPS positive score was 2.01 points lower than in the enhanced care control group (95% CI 3.87 points lower to 0.15 lower) on a scale from 0 to 30 at six months. Participants in the intervention group experienced improvement but we are unclear of the clinical meaning of these data and have not found them explained in the study (1 RCT, 102 participants; very low‐quality evidence).
12.4 Adverse events: suicide
There was one suicide in each group of 50 participants by around two years ‐ indicating the vulnerability of this young cohort.
12.5 Satisfaction with treatment, measured as number of individuals leaving the study early
Overall, 20% to 30% of participants in both groups left the studies early ‐ with no clear difference between treatments. It is unclear how valuable this outcome is for approximating satisfaction with treatment, so we have to grade the finding as being of very low quality.
12.6 Missing outcomes
There are no usable data on mental state, behaviour or quality of life.
13. Integrated treatment compared to standard treatment for prodromal stage of psychosis
Please see Table 13.
13.1 Transition to psychosis, end point data
We found ‐ again ‐ no clear difference between the treatment and control groups (RR 0.57, 95% CI 0.28 to 1.15, very low‐quality evidence) and ‐ again ‐ one small study with data (79 participants).
13.2 Mental state: negative symptoms, measured with SANS
In this case, the SANS reported data did not highlight any difference between the groups but this result is based on very low‐quality evidence from one small study with data for only 57 participants. Although fine‐grain measures such as SANS may not require the numbers of more clinically interpretable binary outcomes to achieve adequate levels of power to have a likely chance of highlighting a difference between groups, studies with recruitment only in the 50s are really unlikely to be able to show anything with confidence.
13.3 Satisfaction with treatment, measured as number of individuals leaving the study early
Around 10% left the treatment arm early. Approximately 30% were lost from the control arm. Such was the power of the study that this did not represent a clear difference between the group receiving integrated treatment and the standard treatment (1 RCT, 79 participants; very low‐quality evidence).
13.4 Missing outcomes
There are few usable data for this comparison. No studies reported on global state, behaviour, adverse effects or quality of life.
Overall completeness and applicability of evidence
1. Completeness
All studies addressing the 13 comparisons had important outcomes missing. All of the data we do have is underpowered and of limited quality so just because we are able to report something does not all mean data are complete. While all comparisons had data about number of participants leaving the study early and the majority reported transition to psychosis and some mental state indicators, virtually none of the comparisons addressed behavioral outcomes, that is, any change in behaviour; only two reported outcomes regarding participants’ global state and four reported data for adverse effects. Only four comparisons had data on patient satisfaction and quality of life.
2. Applicability
Although all studies included participants with clinical high risk for psychosis, criteria used to identify participants at risk were not uniform across the studies. However, this was foreseen and defined in the protocol for this review (Bošnjak 2016). Nevertheless, differences in tools that were used for recognition of individuals at risk may have contributed to some differences in populations studied.
The main problem is that it was difficult to interpret the results. The majority of different included studies allowed additional types of interventions. For example, studies that compared different psychosocial approaches allowed the use of concomitant medications, such as antidepressants, anxiolytics or even antipsychotics that were not controlled for, but made part of the standard control treatment. Also, all studies that compared add‐on pharmacotherapy or the use of amino‐acids and omega‐3, also allowed psychosocial approaches as part of the control group. Comparisons that include different psychosocial approaches are very difficult, for at least several reasons: 1) comparison between different psychotherapies is not reliable if the compare different numbers and durations of sessions; 2) the definition of a standard control treatment may vary significantly from site to site due to the basic psychotherapy training of the psychiatrists in a respective country; 3) supportive therapy may incorporate elements from different psychotherapy approaches, and this may interfere with other approaches included in the 'intervention group' as well as intervention psychotherapy, as, for example, CBT also includes elements of supportive psychotherapy.
Results for omega‐3 studies should be interpreted with caution as the results are based on the results from one study, and the follow‐up of seven years (6 years after the intervention was finished), without the estimation of other treatment methods on the studied outcomes that the participants received over the studied period. In summary, all studies analysed complex multimodal treatment, with different designs. Therefore, it is possible that different approaches are quite effective to a similar degree in the treatment of prodromes, rather than being ineffective.
3. Potential harms of tested interventions
One study indicated significantly higher weight gain for the combination of olanzapine and supportive intervention compared to the control group, which received a combination of placebo and supportive intervention. There were no other clear differences in serious adverse events between interventions in either of the analysed studies. Therefore, none of the interventions analysed in the studies included in this systematic review were associated with significant harmful effects.
Quality of the evidence
The majority of included studies were influenced by different domains of risk of bias at some level. Fifteen studies had one or more domains that we graded as high risk of bias, while all of them had one or more with an unclear risk of bias (Figure 1; Figure 2). GRADE assessment of evidence within the 'Summary of findings' tables indicated that key outcomes presented in these are based on very low‐ or low‐quality evidence. These limitations in study design, selective reporting and imprecision often can be avoided while conducting studies. Overall, this review included 20 studies with a total sample size of 2151 participants. One large study with a sample size of 1000 would have answered many of the questions that continue to linger with really poor levels of data. Although it is often difficult to achieve compliance in a vulnerable population like young people with prodromal symptoms of psychosis, it is needed for reliable results and adequate assessment of an intervention. Researchers should consider different options that could help to improve compliance (e.g. more frequent check‐ups), as well as to assure better reporting standards. Both compliance and higher reporting standards would help to improve study quality (see Implications for research).
Potential biases in the review process
There are many ways in which bias could have been introduced into this review but we have made a great effort to use adequate methodological approaches and included co‐authors without conflicts of interest.
1. Study selection and data extraction
Searches predominantly used English terms and studies only undertaken and reported in the non‐English speaking world could have been missed. The Cochrane Schizophrenia Group's register of studies is compiled from multilingual searches in many different databases but indexing is in English ‐ so that English language searches should have identified the study if relevant. We think it unlikely that large important studies have been missed.
To reduce the possibility of mistakes during study selections, two review authors independently screened all bibliographic records obtained by the search, and we used the same method for screening full texts, extracting data, assessing risk of bias and grading the quality of evidence.
It is likely we have made mistakes in data extraction. This has been painstaking work and it is more than probable that some numbers are not fully accurate. We welcome any comments to help improve this review. We do not think that our mistakes are anything but random ‐ more the function of exhaustion rather than systematic bias.
2. Review author conflict of interest
Authors of this review have no conflicts of interest to declare.
Agreements and disagreements with other studies or reviews
A number of other reviews on this topic were published recently.
The 2015 European Psychiatric Association (EPA) guidance formulated seven evidence‐based recommendations for early intervention in people at high risk of psychosis, but they emphasised that more studies are needed to investigate the specificity of treatment effects and potential age effects in order to tailor interventions to the individual's treatment needs and risk status (Schmidt 2015). The 2017 Canadian treatment guidelines for people at clinical high risk of psychosis used a systematic search for evidence (Addington 2017). Their conclusion is that a staged approach with psychological treatments should be the first‐line treatment and that pharmacotherapy should be reserved for adults, people who did not respond to psychological interventions and those who had more severe symptoms. These guidelines include nine recommendations about diagnosis and treatment, with various strength of evidence (Addington 2017).
Two network meta‐analyses were published in 2018 on this subject (Davies 2018a; Davies 2018b). The first one (Davies 2018a), analyzed efficacy and acceptability of interventions for attenuated positive psychotic symptoms in individuals at clinically high risk of psychosis, and looked only into follow‐up of six and 12 months. In our review, we looked into longer follow‐up times. The authors concluded that there was no robust evidence to favour any specific intervention for improving attenuated positive psychotic symptoms in individuals at clinical high risk of psychosis. The second network meta‐analysis (Davies 2018b), about preventive interventions in psychosis, also concluded that there was no evidence that any specific intervention is particularly effective over any other intervention in preventing transition to psychosis. Results of both of those network meta‐analyses are in line with our conclusion that there was no convincing, unbiased, high‐quality evidence to suggest that any type of intervention is of value for people at prodromal stage of psychosis in terms of preventing development of psychosis. Compared to these reviews, our review included longer follow‐up times and more studies.
Devoe and colleagues used systematic review and network meta‐analysis to analyse efficacy and safety of negative symptom interventions in young people at risk of psychosis. They included both observational studies and those with experimental treatments. They found that no treatments significantly reduced negative symptoms and in the network meta‐analysis all confidence intervals overlapped the null line. Additionally, the authors warned that many relevant studies had small samples and the majority of studies was not designed to target negative symptoms (Devoe 2018a). A second systematic review and meta‐analysis from this group found that no treatment significantly improved social functioning in young people at risk of psychosis (Devoe 2018b). A third study from this group analysed attenuated psychotic symptom (APS) interventions in young people at risk of psychosis and found that, although participants treated with CBT demonstrated a slight trend in reducing APS by long‐term follow‐up compared to participants from control groups, no interventions were significantly more effective at reducing APS compared to all other interventions in network meta‐analysis ‐ again in line with the findings of this review (Devoe 2018c). We think networking of the data in this area has been ill‐advised. Nikolakopoulou found network analyses are not indicated when data are few, there are few common comparisons, there are no differences in the pair‐wise comparisons and networks are insufficiently connected (Bergman 2017), and all these indicators would apply to our findings.
Authors' conclusions
Implications for practice.
1. For participants in prodromal stage of psychosis
There is no convincing, unbiased, high‐quality evidence to suggest that any type of intervention for preventing the development of illness in at‐risk individuals in the prodromal stage of psychosis is superior to the comparators. There is a lot of very low‐quality evidence but nothing that supports, or refutes the use of any or no treatment approach. The low‐quality evidence regarding some benefit from taking omega‐3 fatty acids in terms of reduced transitions to psychosis could be used to support longer‐term use of this as omega‐3 did not seem to do any harm. Even this evidence was not very convincing and serves to 'medialise' the issue for many young people. However, the latter may be less of a danger than suggesting therapy is helpful when it is not clearly the case.
2. For physicians
Various interventions have been tested for treatment of individuals with prodromal symptoms of psychosis, with no or very little difference among them. There is limited evidence that several interventions may be beneficial but those data are based on low, or very low‐quality evidence that require unbiased replication. Olanzapine is probably ill‐advised because of the early weight gain. The current level of evidence is insufficient to recommend routine use of any of the interventions ‐ all must be seen as experimental.
3. For policymakers
Those who make policy have little to guide them from studies. Any policy, therefore, will be founded on opinion and evidence from potentially less rigorous evaluations.
Implications for research.
1. Current reporting
If all studies had complied with good reporting standards (CONSORT), or, even better, made all data available, as is encouraged by the AllTrials initiative, we would know more from already existing data. Selective and poor reporting of data resulted in loss of information which would never have been what people entering the study would have agreed to. This represents waste of opportunity, resource, evidence and trust (Glasziou 2018).
2. Future studies
This is an area of research where new, large, methodologically rigorous studies are necessary, that will yield high‐quality evidence about the benefits and harms of interventions used for treatment of individuals at risk of developing psychosis. The majority of currently available studies were small, with fewer than 50 participants per arm, and they suffered from a number of methodological shortcomings, and selective reporting. These problems can be avoided with adequate study design planning, and inclusion of larger numbers of participants. Available studies have analysed a limited number of clinically relevant outcomes, which should be rectified in future studies. The major obstacle in analysing the results of this review is the difficulty in interpreting results on key outcomes in a pragmatic way, as described in the section Applicability (Overall completeness and applicability of evidence). Thus, in future studies focusing on comparing the efficacy and effectiveness of different psychosocial approaches, especially in combination with pharmacotherapy, a clearer delineation of intervention and control treatment is necessary. Study design should incorporate measurements that could objectify as much as possible the effect of each intervention specifically. Control conditions should be kept as neutral as possible. The inclusion of interventions as part of standard treatment (such as medication or counselling or psychoeducation etc.) imports a bias from the beginning of the study, as the intervention is not compared to a neutral (non‐treatment condition or placebo) control, but to an active control, which in many case may already be quite effective for the treatment of the prodromes.
It is particularly important to conduct long‐term studies for proper assessment of those interventions.
As can be seen from this review, many things have been tested for people with prodromal illnesses. We do realise that it takes great time and effort to draw up a protocol for a new study, but we have given this some thought and seen and thought about all existing studies. Considering the fact that there is no gold standard for the treatment of prodromal psychosis, and that all available treatments are actually new and unproven, it is difficult to suggest what a new intervention should be compared against. On the other hand, comparison to a placebo group or people on a waiting list for treatment over a period of adequate study duration (for example six months) is not feasible as it requires denying any treatment to people at risk. Moreover, considering that people at risk do not hold 'firm' psychiatric diagnosis, the principle of 'first do no harm' is even more important. Thus, we suggest a two‐stage research approach: first, to compare low‐dose, antipsychotics versus any psychosocial programme available in the setting (defined as treatment as usual). In the second step, different components of the psychosocial programme should be compared against each other, but should follow similar rules in the duration, frequency and number of sessions. We sketch an outline for such a study in Table 15, emphasising the relevance of choosing adequate interventions and comparators, as well as the need for longer follow‐up of participants.
2. Suggested design for new study.
| Methods | Allocation: randomised Blinding: double‐blind (participants and study team, treatment provider, investigator, outcomes assessor) Duration: > 6 months of intervention period + > 12 months' follow‐up period |
| Participants | Diagnosis: ultra high risk sample N = 300* Sex: men and women Age: 14‐30 years |
| Interventions | Stage 1 1. Low‐dose antipsychotic + treatment as usual 2. Treatment as usual: psychosocial programme available in the setting Stage 2 Comparison of different components of the psychosocial programme (compared components should follow similar rules in the duration, frequency and number of sessions) |
| Outcomes | Prodromal symptoms: transition to psychosis Global state: clinically important change in global state Mental state: clinically important change in mental state Functioning: clinically important change in functioning Adverse effects: at least one serious adverse event Quality of life: important change in quality of life Satisfaction with treatment: leaving the study early Economics: cost of care |
| Notes | *Sample size suggested because at around 300 participants power to detect a difference in groups of 15% becomes realistic. |
It is clear that greater collaboration in the conduct of studies in this area would greatly enhance the existing evidence‐base. There are now many examples of collaboration between trialists, clinicians and patients on deciding what to measure as outcomes, and how and when to measure these outcomes (COMET). We see no reason why this subgroup of subspecialists should be exempt from working together to get compromise and larger sets of high‐quality data.
Acknowledgements
The Cochrane Schizophrenia Editorial Base in Nottingham produces and maintains standard text for use in the Methods section of their reviews. We have used this text as the basis of what appears here and adapted it as required.
We would like to thank Mahmoud Alkhatib and Mariam A Khokhar for peer reviewing the protocol; and Elizabeth Royle and her CES team for copy‐editing.
We would also like to thank Genevieve Gariepy for peer reviewing the review.
Parts of this review were generated using Review Manager (RevMan) HAL v 4.2. You can find more information about RevMan HAL here.
Appendices
Appendix 1. Subscore data
| Outcome | Scale | Subscale | Study | Intervention | Mean | SD | N | |
| Mental state: specific, psychopathology | Brief Psychopathological Rating Scale (BPRS) | Comparison 1: CBT + placebo vs supportive therapy + placebo Comparison 4: CBT + risperidone vs CBT + placebo Comparison 5: CBT + risperidone vs supportive therapy + placebo |
||||||
| Medium‐term (at 12 months) | Psychotic symptoms | Yung‐Australia | Risperidone + CBT | 2.6 | 2.5 | 24 | ||
| Placebo + CBT | 2.8 | 2.9 | 27 | |||||
| Placebo + supportive therapy | 3.1 | 3 | 18 | |||||
| Comparison 6: CBT (SPI) + NBI + risperidone vs NBI | ||||||||
| Immediately post‐treatment | Psychotic symptoms | PACE‐Australia | SPI | 3.19 | 3.23 | 23 | ||
| NBI | 3.18 | 3.89 | 17 | |||||
| Medium‐term (at 12 months) | PACE‐Australia | SPI | 3.91 | 3.7 | 23 | |||
| NBI | 3.0 | 2.96 | 17 | |||||
| Long‐term (at 4 years) | PACE‐Australia | SPI | 4.75 | 2.61 | 23 | |||
| NBI | 4.65 | 2.67 | 17 | |||||
| Comparison 13: omega‐3 fatty acids vs placebo | ||||||||
| Medium‐term (at 12 months) | Psychotic symptoms | NEURAPRO‐AAE | Omega‐3 fatty acids | 34.1 | 9.3 | 114 | ||
| Placebo | 32.9 | 8.4 | 111 | |||||
| Mental state, specific: negative symptoms | Scale for Assessment of Negative Symptoms (SANS) | Comparison 1: CBT + placebo vs supportive therapy + placebo Comparison 4: CBT + risperidone vs CBT + placebo Comparison 5: CBT + risperidone vs supportive therapy + placebo |
||||||
| Medium‐term (at 12 months) | Affective flattening | Yung‐Australia | Risperidone + CBT | 4.5 | 5.1 | 24 | ||
| Placebo + CBT | 4.9 | 5.1 | 27 | |||||
| Placebo + supportive therapy | 3.3 | 4.4 | 18 | |||||
| Alogia | Risperidone + CBT | 2.7 | 2.8 | 24 | ||||
| Placebo + CBT | 2.6 | 2.6 | 27 | |||||
| Placebo + supportive therapy | 1.8 | 2.8 | 18 | |||||
| Avolition | Risperidone + CBT | 4.5 | 3.2 | 24 | ||||
| Placebo + CBT | 3.3 | 2.9 | 27 | |||||
| Placebo + supportive therapy | 2.7 | 3.3 | 18 | |||||
| Anhedonia | Risperidone + CBT | 4.4 | 4.3 | 24 | ||||
| Placebo + CBT | 3.7 | 3.5 | 27 | |||||
| Placebo + supportive therapy | 4.6 | 5 | 18 | |||||
| Mental state, specific: psychotic symptoms | Brief Symptom Inventory (BSI) | Comparison 2: CBT + supportive intervention vs NDRL + supportive intervention | ||||||
| Short‐term (at 6 months) | Anxiety | DEPTh‐Australia | CBT + supportive intervention | 51.44 | 17.19 | 16 | ||
| NDRL + supportive intervention | 54.47 | 11.34 | 15 | |||||
| Depression | DEPTh‐Australia | CBT + supportive intervention | 52.13 | 13.97 | 16 | |||
| NDRL + supportive intervention | 61.53 | 17.88 | 15 | |||||
| Global severity of symptoms | DEPTh‐Australia | CBT + supportive intervention | 54.44 | 18.42 | 16 | |||
| NDRL + supportive intervention | 57.27 | 12.31 | 15 | |||||
| Quality of life | Quality of Life Scale (QLS) | Comparison 2: CBT + supportive intervention vs NDRL + supportive intervention | ||||||
| Short‐term (at 6 months) | Intrapsychic | DEPTh‐Australia | CBT + supportive intervention | 27.94 | 8.2 | 16 | ||
| NDRL + supportive intervention | 31.18 | 6.17 | 17 | |||||
| Intrapersonal | DEPTh‐Australia | CBT + supportive intervention | 29.4 | 12.56 | 15 | |||
| NDRL + supportive intervention | 32.24 | 12.22 | 17 | |||||
| Mental state, specific: at‐risk symptoms | Comprehensive Assessment of At‐Risk Mental States (CAARMS) | Comparison 2: CBT + supportive intervention vs NDRL + supportive intervention | ||||||
| Short‐term (at 6 months) | Distress | DEPTh‐Australia | CBT + supportive intervention | 83.56 | 109.29 | 16 | ||
| NDRL + supportive intervention | 12.06 | 26.75 | 17 | |||||
| Frequency | CBT + supportive intervention | 4.94 | 5.91 | 17 | ||||
| NDRL + supportive intervention | 1.82 | 3.7 | 17 | |||||
| Intensity | CBT + supportive intervention | 3.71 | 5.19 | 17 | ||||
| NDRL + supportive intervention | 1.71 | 2.64 | 17 | |||||
| Comparison 3: CBT + supportive therapy vs supportive therapy | ||||||||
| Medium‐term (at 12 months) | Distress | EDIE‐2‐UK | CBT + supportive therapy | 14.72 | 16.87 | 92 | ||
| Supportive therapy | 19.49 | 18.26 | 91 | |||||
| Long‐term (at 18 months) | EDIE‐2‐UK | CBT + supportive therapy | 71.9 | 88.9 | 71 | |||
| Supportive therapy | 73.9 | 78.2 | 69 | |||||
| Medium‐term (at 12 months) | Severity | EDIE‐2‐UK | CBT + supportive therapy | 14.88 | 15.54 | 95 | ||
| Supportive therapy | 20.84 | 17.75 | 93 | |||||
| Long‐term (at 18 months) | Frequency | EDIE‐NL | CBT + supportive therapy | 5.2 | 5.5 | 71 | ||
| Supportive therapy | 6.9 | 5 | 69 | |||||
| Long‐term (at 18 months) | Intensity | EDIE‐NL | CBT + supportive therapy | 4.1 | 4.2 | 71 | ||
| Supportive therapy | 4.9 | 3.5 | 69 | |||||
| Global state, specific: personal beliefs | Personal Beliefs about Experience Questionnaire (PBEQ) | Comparison 3: CBT + supportive therapy vs supportive therapy | ||||||
| Medium‐term (at 12 months) | Negative appraisals | EDIE‐2‐UK | CBT + supportive therapy | 20.7 | 5.89 | 86 | ||
| Supportive therapy | 19.78 | 5.04 | 81 | |||||
| Social acceptability | EDIE‐2‐UK | CBT + supportive therapy | 10.61 | 2.13 | 87 | |||
| Supportive therapy | 10.49 | 2.38 | 82 | |||||
| Mental state, specific: social functioning | Social Functioning Scale II (SAS‐II) | Comparison 3: CBT + supportive therapy vs supportive therapy | ||||||
| Medium‐term (at 12 months) | Social activities | EIPS‐Germany | CBT + supportive therapy | 2.2 | 0.81 | 29 | ||
| Supportive therapy | 2.1 | 0.74 | 38 | |||||
| Well‐being | EIPS‐Germany | CBT + supportive therapy | 1.5 | 0.76 | 29 | |||
| Supportive therapy | 1.4 | 0.48 | 38 | |||||
| Work | EIPS‐Germany | CBT + supportive therapy | 1.9 | 0.57 | 29 | |||
| Supportive therapy | 2 | 0.58 | 38 | |||||
| Mental state, specific: positive symptoms | Scale for the Assessment of Positive Symptoms (SAPS) | Comparison 9: integrated treatment vs standard treatment | ||||||
| Long‐term (at 2 years) | Psychotic | Nordentoft‐Denmark | Integrated treatment | 0.52 | 1.01 | 32 | ||
| Standard treatment | 0.98 | 1.2 | 25 | |||||
| Disorganised | Nordentoft‐Denmark | Integrated treatment | 0.52 | 0.61 | 32 | |||
| Standard treatment | 0.43 | 0.65 | 25 | |||||
| Mental state, specific: psychotic symptoms | Early Recognition Inventory based on IRAOS (ERIraos) | Comparison 10: amisulpiride + NFI vs NFI | ||||||
| Short‐term (at 12 weeks) | ERI–BAPPSS | LIPS‐Germany | Amisulpiride + NFI | 5.6 | 6.5 | 58 | ||
| NFI | 7.9 | 8 | 44 | |||||
| ERI–PPS | LIPS‐Germany | Amisulpiride + NFI | 1.8 | 2.6 | 58 | |||
| NFI | 3.4 | 4.2 | 44 | |||||
| ERI‐BS | EIPS‐Germany | Amisulpiride + NFI | 3.8 | 4.8 | 58 | |||
| NFI | 4.4 | 4.9 | 44 | |||||
| BAPSS: Basic and Positive Psychotic Spectrum Symptoms score; BS: basic symptoms; CBT: cognitive behavioural therapy; NBI: needs‐based intervention; NDRL: non‐directive reflective listening; NFI: needs‐focused intervention; PPS: psychotic positive symptoms; SPI: specific preventive intervention; | ||||||||
Data and analyses
Comparison 1. Group A: amino acids vs placebo.
| Outcome or subgroup title | No. of studies | No. of participants | Statistical method | Effect size |
|---|---|---|---|---|
| 1 Prodromal symptoms: transition to psychosis, endpoint data | 2 | 52 | Risk Ratio (M‐H, Random, 95% CI) | 0.48 [0.08, 2.98] |
| 2 Mental state 1: specific, psychosis risk symptoms, average total score, short‐term (at 8 weeks), SOPS (higher score = worse) | 1 | Mean Difference (IV, Fixed, 95% CI) | Subtotals only | |
| 2.1 Total score | 1 | 8 | Mean Difference (IV, Fixed, 95% CI) | ‐10.00 [‐22.38, 2.38] |
| 2.2 Positive score | 1 | 8 | Mean Difference (IV, Fixed, 95% CI) | ‐2.5 [‐7.86, 2.86] |
| 2.3 Negative score | 1 | 8 | Mean Difference (IV, Fixed, 95% CI) | ‐1.80 [‐4.88, 1.28] |
| 2.4 Disorganisation score | 1 | 8 | Mean Difference (IV, Fixed, 95% CI) | 1.0 [‐1.57, 3.57] |
| 2.5 General score | 1 | 8 | Mean Difference (IV, Fixed, 95% CI) | ‐6.80 [‐9.47, ‐4.13] |
| 3 Mental state 2 specific: depression, average total score, short‐term (at 8 weeks), MADRS (higher score = worse), skewed data | Other data | No numeric data | ||
| 4 Mental state 3a specific: cognitive symptoms, average total score, short‐term (at 12 weeks), various tests (higher score = better) | 1 | Mean Difference (IV, Random, 95% CI) | Subtotals only | |
| 4.1 Immediate verbal memory (AVLT immediate trials sum) | 1 | 5 | Mean Difference (IV, Random, 95% CI) | 6.5 [‐2.15, 15.15] |
| 4.2 Delayed verbal memory (AVLT delay trial) | 1 | 5 | Mean Difference (IV, Random, 95% CI) | 0.50 [‐1.17, 2.17] |
| 4.3 Executive functioning (semantic fluency test) | 1 | 4 | Mean Difference (IV, Random, 95% CI) | ‐0.5 [‐10.53, 9.53] |
| 4.4 Executive functioning (phonemic fluency test) | 1 | 4 | Mean Difference (IV, Random, 95% CI) | ‐1.00 [‐20.38, 14.38] |
| 4.5 Attention and working memory (letter number sequencing) | 1 | 5 | Mean Difference (IV, Random, 95% CI) | 4.5 [2.04, 6.96] |
| 5 Mental state 3b specific: cognitive symptoms, average total score, short‐term (at 12 weeks), various tests (higher score = worse) | 1 | Mean Difference (IV, Random, 95% CI) | Subtotals only | |
| 5.1 Processing speed (Trails A) | 1 | 4 | Mean Difference (IV, Random, 95% CI) | 8.8 [‐8.57, 26.17] |
| 5.2 Attention and working memory (Trails B) | 1 | 4 | Mean Difference (IV, Random, 95% CI) | ‐2.80 [‐48.70, 43.10] |
| 5.3 Processing speed (Stroop words) | 1 | 4 | Mean Difference (IV, Random, 95% CI) | ‐11.5 [‐27.49, 4.49] |
| 5.4 Processing speed (Stroop colors) | 1 | 4 | Mean Difference (IV, Random, 95% CI) | ‐6.60 [‐17.45, 4.25] |
| 5.5 Processing speed (Stroop color‐words) | 1 | 4 | Mean Difference (IV, Random, 95% CI) | ‐6.0 [‐9.50, ‐2.50] |
| 5.6 Executive functioning (WCS perseverative errors) | 1 | 5 | Mean Difference (IV, Random, 95% CI) | 9.7 [4.16, 15.24] |
| 6 Adverse effects 1 specific: treatment‐emergent adverse effects, short‐term (by 8 weeks) | 1 | Risk Ratio (M‐H, Random, 95% CI) | Subtotals only | |
| 6.1 Psychological: irritability | 1 | 8 | Risk Ratio (M‐H, Random, 95% CI) | 0.33 [0.02, 6.37] |
| 6.2 Psychological: mentation impaired | 1 | 8 | Risk Ratio (M‐H, Random, 95% CI) | 0.33 [0.02, 6.37] |
| 6.3 Psychological: hallucinations | 1 | 8 | Risk Ratio (M‐H, Random, 95% CI) | 0.33 [0.02, 6.37] |
| 6.4 Arousal: sedation | 1 | 8 | Risk Ratio (M‐H, Random, 95% CI) | 0.2 [0.01, 3.20] |
| 6.5 Arousal: disturbed sleep | 1 | 8 | Risk Ratio (M‐H, Random, 95% CI) | 0.2 [0.01, 3.20] |
| 6.6 Arousal: malaise | 1 | 8 | Risk Ratio (M‐H, Random, 95% CI) | 0.33 [0.02, 6.37] |
| 6.7 Sexual: orgasm dysfunction | 1 | 8 | Risk Ratio (M‐H, Random, 95% CI) | 3.00 [0.16, 57.36] |
| 6.8 Gastrointestinal: stomach discomfort | 1 | 8 | Risk Ratio (M‐H, Random, 95% CI) | 0.33 [0.02, 6.37] |
| 7 Adverse effects 2 specific: cardiovascular, average total score, short‐term (by 8 weeks), blood pressure and pulse rate (higher score = worse) | 1 | Mean Difference (IV, Random, 95% CI) | Subtotals only | |
| 7.1 Systolic blood pressure | 1 | 8 | Mean Difference (IV, Random, 95% CI) | 6.0 [‐8.70, 20.70] |
| 7.2 Diastolic blood pressure | 1 | 8 | Mean Difference (IV, Random, 95% CI) | 2.0 [‐12.03, 16.03] |
| 7.3 Pulse | 1 | 8 | Mean Difference (IV, Random, 95% CI) | ‐20.0 [‐41.76, 1.76] |
| 8 Adverse effects 3 specific: weight, average total change score, short‐term (by 8 weeks), kg gained (higher score = worse) | 1 | 8 | Std. Mean Difference (IV, Random, 95% CI) | ‐0.67 [‐2.13, 0.79] |
| 9 Adverse effects 4 specific: suicidal thoughts, short‐term (by 16 weeks) | 1 | 44 | Risk Ratio (M‐H, Random, 95% CI) | 3.57 [0.15, 83.14] |
| 10 Satisfaction with treatment: leaving the study early ‐ end point data | 2 | 52 | Risk Ratio (M‐H, Random, 95% CI) | 0.96 [0.55, 1.69] |
Comparison 2. Group A: omega‐3 fatty acids vs placebo.
| Outcome or subgroup title | No. of studies | No. of participants | Statistical method | Effect size |
|---|---|---|---|---|
| 1 Prodromal symptoms: transition to psychosis | 2 | Risk Ratio (M‐H, Random, 95% CI) | Subtotals only | |
| 1.1 Medium‐term (at 12 months) | 2 | 385 | Risk Ratio (M‐H, Random, 95% CI) | 0.50 [0.08, 3.08] |
| 1.2 Long‐term (at 7 years) | 1 | 81 | Risk Ratio (M‐H, Random, 95% CI) | 0.24 [0.09, 0.67] |
| 2 Global state: antipsychotic prescription, long‐term (at 7 years' follow‐up) | 1 | 69 | Risk Ratio (M‐H, Random, 95% CI) | 0.54 [0.30, 0.99] |
| 3 Mental state 1a specific: psychotic symptoms, average total score, PANSS (higher score = worse) | 1 | Mean Difference (IV, Random, 95% CI) | Subtotals only | |
| 3.1 General: medium‐term (at 12 months) | 1 | 81 | Mean Difference (IV, Random, 95% CI) | ‐3.90 [‐8.06, 0.26] |
| 3.2 General: long‐term (up to 7 years) | 1 | 81 | Mean Difference (IV, Random, 95% CI) | ‐4.70 [‐9.69, 0.29] |
| 3.3 Negative: medium‐term (at 12 months) | 1 | 81 | Mean Difference (IV, Random, 95% CI) | ‐2.60 [‐5.09, ‐0.11] |
| 3.4 Negative: long‐term (up to 7 years) | 1 | 81 | Mean Difference (IV, Random, 95% CI) | ‐3.10 [‐6.15, ‐0.05] |
| 3.5 Positive: medium‐term (at 12 months) | 1 | 81 | Mean Difference (IV, Random, 95% CI) | ‐2.10 [‐4.32, 0.12] |
| 3.6 Positive: long‐term (up to 7 years) | 1 | 81 | Mean Difference (IV, Random, 95% CI) | ‐3.50 [‐5.99, ‐1.01] |
| 3.7 Total: medium‐term (at 12 months) | 1 | 81 | Mean Difference (IV, Random, 95% CI) | ‐8.60 [‐16.36, ‐0.84] |
| 3.8 Total: long‐term (up to 7 years) | 1 | 81 | Mean Difference (IV, Random, 95% CI) | ‐11.40 [‐20.55, ‐2.25] |
| 4 Mental state 1b specific: negative symptoms, average total score, medium‐term (at 12 months), SANS (higher score = worse) | 1 | 225 | Mean Difference (IV, Random, 95% CI) | 0.5 [‐2.56, 3.56] |
| 5 Mental state 2 specific: depression, average total score, medium‐term (at 12 months), MADRS (higher score = worse), skewed data | 1 | 225 | Mean Difference (IV, Random, 95% CI) | ‐0.30 [‐2.78, 2.18] |
| 6 Mental state 3 specific: mania, average total score, medium‐term (at 12 months), YMS (higher score = worse) | 1 | 225 | Mean Difference (IV, Random, 95% CI) | 0.40 [‐0.35, 1.15] |
| 7 Mental state 4 specific: average total scores, various scales (higher score = worse), skewed data | Other data | No numeric data | ||
| 7.1 Psychotic symptoms: positive (average total score), long‐term (by up to 7 years) PANSS | Other data | No numeric data | ||
| 7.2 Psychotic symptoms: negative (average total score), medium‐term (at 12 months) PANSS | Other data | No numeric data | ||
| 7.3 Psychotic symptoms: negative (average total score), long‐term (by up to 7 years) PANSS | Other data | No numeric data | ||
| 7.4 Depression: average total score, medium‐term (at 12 months), MADRS | Other data | No numeric data | ||
| 7.5 Depression: average total score, long‐term (by up to 7 years) MADRS | Other data | No numeric data | ||
| 8 Functioning 1 global: average total score, GAF (higher score = better) | 1 | Mean Difference (IV, Random, 95% CI) | Subtotals only | |
| 8.1 Medium‐term (at 12 months) | 1 | 81 | Mean Difference (IV, Random, 95% CI) | 11.5 [5.12, 17.88] |
| 8.2 Long‐term (at up to 7 years) | 1 | 81 | Mean Difference (IV, Random, 95% CI) | 9.5 [2.02, 16.98] |
| 9 Functioning 2 specific: role functioning, average total score, medium‐term (at 12 months), GFR (higher score = better) | 1 | 225 | Mean Difference (IV, Random, 95% CI) | 0.0 [‐0.49, 0.49] |
| 10 Functioning 3a specific: social functioning, average total score, medium‐term (at 12 months), GFS (higher score = better) | 1 | 225 | Mean Difference (IV, Random, 95% CI) | ‐0.20 [‐0.59, 0.19] |
| 11 Functioning 3b specific: social functioning, average total score, medium‐term (at 12 months), SOFAS (higher score = better) | 1 | 225 | Mean Difference (IV, Random, 95% CI) | 0.10 [‐4.60, 4.80] |
| 12 Adverse effects, specific: medium‐term (by 12 months), UKU checklist | 2 | Risk Ratio (M‐H, Random, 95% CI) | Subtotals only | |
| 12.1 Arousal: concentration difficulties | 1 | 81 | Risk Ratio (M‐H, Random, 95% CI) | 0.20 [0.02, 1.60] |
| 12.2 Arousal: increased fatigability | 1 | 81 | Risk Ratio (M‐H, Random, 95% CI) | 1.46 [0.26, 8.30] |
| 12.3 Arousal: sleep ‐ reduced duration of sleep | 1 | 81 | Risk Ratio (M‐H, Random, 95% CI) | 0.98 [0.21, 4.55] |
| 12.4 Arousal: sleep‐related ‐ unspecified | 1 | 304 | Risk Ratio (M‐H, Random, 95% CI) | 0.83 [0.49, 1.42] |
| 12.5 Autonomic nervous system: orthostatic dizziness | 1 | 81 | Risk Ratio (M‐H, Random, 95% CI) | 0.20 [0.01, 3.94] |
| 12.6 Autonomic nervous system: sweating increase | 1 | 81 | Risk Ratio (M‐H, Random, 95% CI) | 0.20 [0.01, 3.94] |
| 12.7 Autonomic nervous system: unspecified | 1 | 304 | Risk Ratio (M‐H, Random, 95% CI) | 1.56 [0.79, 3.11] |
| 12.8 Gastrointestinal: diarrhoea | 1 | 81 | Risk Ratio (M‐H, Random, 95% CI) | 0.24 [0.03, 2.09] |
| 12.9 Gastrointestinal: nausea/ vomiting | 1 | 81 | Risk Ratio (M‐H, Random, 95% CI) | 0.98 [0.21, 4.55] |
| 12.10 Gastrointestinal: unspecified | 1 | 304 | Risk Ratio (M‐H, Random, 95% CI) | 1.28 [0.91, 1.79] |
| 12.11 Haematological: increased bleeding | 1 | 304 | Risk Ratio (M‐H, Random, 95% CI) | 0.33 [0.01, 8.01] |
| 12.12 Hormonal: unspecified | 1 | 304 | Risk Ratio (M‐H, Random, 95% CI) | 0.61 [0.26, 1.42] |
| 12.13 Neurological: extrapyramidal | 1 | 304 | Risk Ratio (M‐H, Random, 95% CI) | 2.57 [0.94, 7.02] |
| 12.14 Neurological: failing memory | 1 | 81 | Risk Ratio (M‐H, Random, 95% CI) | 0.20 [0.01, 3.94] |
| 12.15 Neurological: tension headache | 1 | 81 | Risk Ratio (M‐H, Random, 95% CI) | 0.24 [0.03, 2.09] |
| 12.16 Neurological: unspecified | 1 | 304 | Risk Ratio (M‐H, Random, 95% CI) | 1.85 [0.81, 4.24] |
| 12.17 Psychological: depression | 1 | 81 | Risk Ratio (M‐H, Random, 95% CI) | 0.39 [0.08, 1.90] |
| 12.18 Psychological: emotional indifference | 1 | 81 | Risk Ratio (M‐H, Random, 95% CI) | 0.49 [0.09, 2.52] |
| 12.19 Psychological: tension/inner unrest | 1 | 81 | Risk Ratio (M‐H, Random, 95% CI) | 0.78 [0.23, 2.70] |
| 12.20 Psychological: unspecified | 1 | 304 | Risk Ratio (M‐H, Random, 95% CI) | 1.32 [0.70, 2.47] |
| 12.21 Sexual: unspecified | 1 | 304 | Risk Ratio (M‐H, Random, 95% CI) | 6.91 [0.86, 55.48] |
| 12.22 Skin: unspecified | 1 | 304 | Risk Ratio (M‐H, Random, 95% CI) | 0.70 [0.23, 2.17] |
| 12.23 Other: unspecified | 1 | 304 | Risk Ratio (M‐H, Random, 95% CI) | 1.12 [0.66, 1.90] |
| 13 Satisfaction with treatment: leaving the study early | 2 | Risk Ratio (M‐H, Random, 95% CI) | Subtotals only | |
| 13.1 Medium‐term (by 12 months), endpoint | 2 | 385 | Risk Ratio (M‐H, Random, 95% CI) | 0.98 [0.68, 1.42] |
| 13.2 Long‐term (by 7 years), additional follow‐up | 1 | 81 | Risk Ratio (M‐H, Random, 95% CI) | 1.46 [0.45, 4.80] |
Comparison 3. Group B: antipsychotic drugs, amisulpiride + needs‐focused intervention (NFI) vs NFI.
| Outcome or subgroup title | No. of studies | No. of participants | Statistical method | Effect size |
|---|---|---|---|---|
| 1 Mental state, specific: average endpoint scores, short‐term (at 12 weeks), various scales (higher score = worse), skewed data | Other data | No numeric data | ||
| 1.1 Psychotic symptoms: positive (endpoint score) PANSS | Other data | No numeric data | ||
| 1.2 Psychotic symptoms: negative (endpoint score) PANSS | Other data | No numeric data | ||
| 1.3 Psychotic symptoms: general (endpoint score) PANSS | Other data | No numeric data | ||
| 1.4 Depression (endpoint score) MADRS | Other data | No numeric data | ||
| 2 Functioning, global: average endpoint score, short‐term (at 12 weeks), GAF (higher score = better) | 1 | 102 | Mean Difference (IV, Random, 95% CI) | 6.10 [0.44, 11.76] |
| 3 Adverse effects 1a specific: akathisia, short‐term (at 12 weeks), ESRS | 1 | 104 | Risk Ratio (M‐H, Random, 95% CI) | 2.82 [0.33, 24.36] |
| 4 Adverse effects 1b specific: akathisia (average endpoint score), short‐term (at 12 weeks), ESRS (higher score = worse), skewed data | Other data | No numeric data | ||
| 5 Adverse effects 2 specific: increased prolactin levels, short‐term (at 12 weeks) | 1 | 78 | Risk Ratio (M‐H, Random, 95% CI) | 3.97 [2.02, 7.80] |
| 6 Adverse effects 3 specific: severity of at least moderate and a frequency of at least 5%, short‐term (at 12 weeks), UKU | 1 | Risk Ratio (M‐H, Random, 95% CI) | Subtotals only | |
| 6.1 Psychological: concentration difficulties | 1 | 101 | Risk Ratio (M‐H, Random, 95% CI) | 1.01 [0.78, 1.31] |
| 6.2 Psychological: asthenia/lassitude/increased fatigability | 1 | 101 | Risk Ratio (M‐H, Random, 95% CI) | 1.64 [1.08, 2.50] |
| 6.3 Psychological: failing memory | 1 | 101 | Risk Ratio (M‐H, Random, 95% CI) | 2.19 [1.17, 4.10] |
| 6.4 Psychological: depression | 1 | 101 | Risk Ratio (M‐H, Random, 95% CI) | 1.10 [0.82, 1.48] |
| 6.5 Psychological: tension | 1 | 101 | Risk Ratio (M‐H, Random, 95% CI) | 1.17 [0.85, 1.61] |
| 6.6 Arousal: sleepiness/sedation | 1 | 101 | Risk Ratio (M‐H, Random, 95% CI) | 1.48 [0.49, 4.47] |
| 6.7 Arousal: increased duration of sleep | 1 | 101 | Risk Ratio (M‐H, Random, 95% CI) | 3.28 [1.37, 7.85] |
| 6.8 Arousal: decreased duration of sleep | 1 | 101 | Risk Ratio (M‐H, Random, 95% CI) | 0.49 [0.23, 1.06] |
| 6.9 Arousal: increased dream activity | 1 | 101 | Risk Ratio (M‐H, Random, 95% CI) | 21.82 [1.35, 353.77] |
| 6.10 Gastrointestinal: nausea/vomiting | 1 | 101 | Risk Ratio (M‐H, Random, 95% CI) | 9.92 [0.58, 169.00] |
| 6.11 Autonomic nervous system: orthostatic dizziness | 1 | 101 | Risk Ratio (M‐H, Random, 95% CI) | 5.95 [0.33, 107.62] |
| 6.12 Autonomic nervous system: increased tendency to sweating | 1 | 101 | Risk Ratio (M‐H, Random, 95% CI) | 16.53 [1.01, 271.60] |
| 6.13 Cardiological: palpitation/tachycardia | 1 | 101 | Risk Ratio (M‐H, Random, 95% CI) | 0.98 [0.30, 3.27] |
| 6.14 Neurological: headache | 1 | 101 | Risk Ratio (M‐H, Random, 95% CI) | 1.86 [0.80, 4.31] |
| 6.15 Endocrinological: polyuria/polydipsia | 1 | 101 | Risk Ratio (M‐H, Random, 95% CI) | 0.98 [0.30, 3.27] |
| 6.16 Sexual: diminished sexual desire | 1 | 101 | Risk Ratio (M‐H, Random, 95% CI) | 3.44 [1.28, 9.28] |
| 6.17 Sexual: orgasmic dysfunction | 1 | 101 | Risk Ratio (M‐H, Random, 95% CI) | 5.95 [0.33, 107.62] |
| 7 Adverse effects 4 specific: suicidal thoughts | 1 | 102 | Risk Ratio (M‐H, Random, 95% CI) | 0.25 [0.01, 6.10] |
| 8 Satisfaction with treatment: leaving the study early, end point data | 1 | 124 | Risk Ratio (M‐H, Random, 95% CI) | 0.59 [0.38, 0.94] |
Comparison 4. Group B: antipsychotic drugs, olanzapine + supportive intervention vs placebo + supportive intervention.
| Outcome or subgroup title | No. of studies | No. of participants | Statistical method | Effect size |
|---|---|---|---|---|
| 1 Prodromal symptoms: transition to psychosis, endpoint data, medium‐term (by 12 months) | 1 | 60 | Risk Ratio (M‐H, Random, 95% CI) | 0.58 [0.28, 1.18] |
| 2 Global state, global: illness severity, average total score, medium‐term (at 12 months), CGI (higher score = worse) | 1 | 59 | Mean Difference (IV, Random, 95% CI) | ‐0.23 [‐0.82, 0.36] |
| 3 Mental state specific: average total scores, medium‐term (at 12 months), various scales (higher score = worse), skewed data | Other data | No numeric data | ||
| 3.1 Psychosis risk symptoms: total, average total change score, SOPS | Other data | No numeric data | ||
| 3.2 Psychosis risk symptoms: positive, average total change score, SOPS | Other data | No numeric data | ||
| 3.3 Psychosis risk symptoms: negative, average total change score, SOPS | Other data | No numeric data | ||
| 3.4 Psychosis risk symptoms: disorganisation, average total change score, SOPS | Other data | No numeric data | ||
| 3.5 Psychosis risk symptoms: general, average total change score, SOPS | Other data | No numeric data | ||
| 3.6 Psychosis risk symptoms: total, average total change score, PANSS | Other data | No numeric data | ||
| 3.7 Psychotic symptoms: positive, average total change score, PANSS | Other data | No numeric data | ||
| 3.8 Psychotic symptoms: negative, average total change score, PANSS | Other data | No numeric data | ||
| 3.9 Psychotic symptoms: general, average total change score, PANSS | Other data | No numeric data | ||
| 3.10 Depression: average total change score, MADRS | Other data | No numeric data | ||
| 3.11 Mania: average total change score, YMS | Other data | No numeric data | ||
| 4 Functioning, global: average total score, medium‐term (at 12 months), GAF (higher score = better) | 1 | 59 | Mean Difference (IV, Random, 95% CI) | 2.43 [‐4.77, 9.63] |
| 5 Adverse effects 1 specific: average total score, short‐term (at 8 weeks), various scales (higher score = worse), skewed data | Other data | No numeric data | ||
| 5.1 Extrapyramidal symptoms: average total change score, Simpson‐Angus scale | Other data | No numeric data | ||
| 5.2 Akathisia: average total change score, Barnes akathisia scale | Other data | No numeric data | ||
| 5.3 Abnormal involuntary movements: average total change score, AIMS | Other data | No numeric data | ||
| 6 Adverse effects 2a specific: cardiovascular, average total change score, short‐term (at 8 weeks), blood pressure and pulse rate (higher score = worse) | 1 | Mean Difference (IV, Random, 95% CI) | Subtotals only | |
| 6.1 Sitting systolic blood pressure | 1 | 59 | Mean Difference (IV, Random, 95% CI) | 1.0 [‐4.28, 6.28] |
| 6.2 Sitting diastolic blood pressure | 1 | 59 | Mean Difference (IV, Random, 95% CI) | ‐2.3 [‐7.43, 2.83] |
| 6.3 Sittiing pulse | 1 | 59 | Mean Difference (IV, Random, 95% CI) | 8.2 [0.03, 16.37] |
| 6.4 Standing systolic blood pressure | 1 | 59 | Mean Difference (IV, Random, 95% CI) | ‐1.80 [‐8.18, 4.58] |
| 6.5 Standing diastolic blood pressure | 1 | 59 | Mean Difference (IV, Random, 95% CI) | ‐1.80 [‐6.96, 3.36] |
| 6.6 Standing pulse | 1 | 59 | Mean Difference (IV, Random, 95% CI) | 7.9 [‐0.74, 16.54] |
| 7 Adverse effects 2b specific: cardiovascular, average total score, medium‐term (at 12 months), pulse rate (higher score = worse) | 1 | Mean Difference (IV, Random, 95% CI) | Subtotals only | |
| 7.1 Sitting pulse | 1 | 58 | Mean Difference (IV, Random, 95% CI) | 9.27 [1.49, 17.05] |
| 7.2 Standing pulse | 1 | 57 | Mean Difference (IV, Random, 95% CI) | 6.94 [‐2.61, 16.49] |
| 8 Adverse effects 3 specific: treatment‐emergent adverse effects, short‐term (at 8 weeks) | 1 | Risk Ratio (M‐H, Random, 95% CI) | Subtotals only | |
| 8.1 Arousal: somnolence | 1 | 60 | Risk Ratio (M‐H, Random, 95% CI) | 2.25 [0.90, 5.59] |
| 8.2 Gastrointestinal: weight gain | 1 | 60 | Risk Ratio (M‐H, Random, 95% CI) | 10.29 [1.42, 74.79] |
| 8.3 Gastrointestinal: increased appetite | 1 | 60 | Risk Ratio (M‐H, Random, 95% CI) | 1.87 [0.51, 6.80] |
| 8.4 Psychological: anxiety | 1 | 60 | Risk Ratio (M‐H, Random, 95% CI) | 4.68 [0.58, 37.68] |
| 8.5 Psychological: nervousness | 1 | 60 | Risk Ratio (M‐H, Random, 95% CI) | 1.87 [0.37, 9.46] |
| 8.6 Psychological: asthenia | 1 | 60 | Risk Ratio (M‐H, Random, 95% CI) | 3.74 [0.44, 31.55] |
| 8.7 Psychological: abnormal thoughts | 1 | 60 | Risk Ratio (M‐H, Random, 95% CI) | 1.40 [0.25, 7.81] |
| 8.8 Muscoloskeletal: joint disorder | 1 | 60 | Risk Ratio (M‐H, Random, 95% CI) | 0.94 [0.20, 4.27] |
| 9 Adverse effects 4a specific: weight, average total weight change, kg gained (higher scores = worse) | 1 | Mean Difference (IV, Random, 95% CI) | Subtotals only | |
| 9.1 Short‐term (by 8 weeks) | 1 | 59 | Mean Difference (IV, Random, 95% CI) | 4.58 [2.02, 7.14] |
| 9.2 Medium‐term (by 12 months) | 1 | 59 | Mean Difference (IV, Random, 95% CI) | 8.49 [4.90, 12.08] |
| 10 Adverse effects 4b specific: weight gain, medium‐term (at 12 months) | 1 | 60 | Risk Ratio (M‐H, Random, 95% CI) | 3.55 [1.53, 8.28] |
| 11 Adverse effects 5 specific: fatigue, medium‐term (at 12 months) | 1 | 60 | Risk Ratio (M‐H, Random, 95% CI) | 8.42 [1.14, 62.40] |
| 12 Satisfaction with treatment: leaving the study early, endpoint data, medium‐term (by 12 months) | 1 | 60 | Risk Ratio (M‐H, Random, 95% CI) | 1.59 [0.88, 2.88] |
Comparison 5. Group B: cognitive behavioural therapy (CBT), CBT + supportive therapy vs supportive therapy.
| Outcome or subgroup title | No. of studies | No. of participants | Statistical method | Effect size |
|---|---|---|---|---|
| 1 Prodromal symptoms: transition to psychosis | 5 | Risk Ratio (M‐H, Random, 95% CI) | Subtotals only | |
| 1.1 Medium‐term (by 12 months) | 5 | 728 | Risk Ratio (M‐H, Random, 95% CI) | 0.47 [0.29, 0.76] |
| 1.2 Long‐term (by 18 months) | 2 | 252 | Risk Ratio (M‐H, Random, 95% CI) | 0.45 [0.23, 0.89] |
| 1.3 Long‐term (by 24 months) | 1 | 128 | Risk Ratio (M‐H, Random, 95% CI) | 0.32 [0.11, 0.92] |
| 1.4 Long‐term (by 4 years' additional follow‐up) | 1 | 201 | Risk Ratio (M‐H, Random, 95% CI) | 0.58 [0.31, 1.12] |
| 2 Global state specific: personal beliefs, average scores, long‐term (at 18 months), PBIQ‐ R (higher score = worse) | 1 | Mean Difference (IV, Random, 95% CI) | Subtotals only | |
| 2.1 Control | 1 | 140 | Mean Difference (IV, Random, 95% CI) | ‐0.70 [‐1.79, 0.39] |
| 2.2 Entrapment | 1 | 140 | Mean Difference (IV, Random, 95% CI) | ‐0.5 [‐1.91, 0.91] |
| 2.3 Loss | 1 | 140 | Mean Difference (IV, Random, 95% CI) | ‐0.90 [‐2.37, 0.57] |
| 2.4 Participation | 1 | 140 | Mean Difference (IV, Random, 95% CI) | ‐0.40 [‐1.48, 0.68] |
| 2.5 Shame | 1 | 140 | Mean Difference (IV, Random, 95% CI) | ‐0.40 [‐1.68, 0.88] |
| 3 Mental state 1 specific: social anxiety, average total score, long‐term (at 18 months), SAS (higher score = worse) | 1 | 28 | Mean Difference (IV, Random, 95% CI) | ‐3.60 [‐12.34, 5.14] |
| 4 Mental state 2 specific: average scores, various scales, higher score = worse, skewed data) | Other data | No numeric data | ||
| 4.1 Psychotic symptoms: total, average total score, medium‐term (at 12 months), PANSS | Other data | No numeric data | ||
| 4.2 Depression, average total score, medium‐term (at 12 months), BDI‐PC | Other data | No numeric data | ||
| 4.3 Depression, average total score, medium‐term (at 12 months), MADRS | Other data | No numeric data | ||
| 4.4 Depression, average total score, long‐term (at 18 months), BDI‐II | Other data | No numeric data | ||
| 4.5 Depression, average total score, long‐term (at 18 months), CDSS | Other data | No numeric data | ||
| 4.6 Psychotic symptoms: positive, average total score, medium‐term (at 12 months), PANSS | Other data | No numeric data | ||
| 4.7 Psychotic symptoms: negative, average total score, medium‐term (at 12 months), PANSS | Other data | No numeric data | ||
| 4.8 Psychosis risk symptoms: positive, average total score, long‐term (at 18 months), SOPS | Other data | No numeric data | ||
| 4.9 Psychosis risk symptoms: negative, average total score, long‐term (at 18 months), SOPS | Other data | No numeric data | ||
| 4.10 Social interaction and anxiety: average total score, medium‐term (at 12 months), SIAS | Other data | No numeric data | ||
| 4.11 Social interaction and anxiety: average total score, long‐term (at 18 months), SIAS | Other data | No numeric data | ||
| 5 Functioning 1 global: average total score, GAF, (higher score = better) | 3 | Mean Difference (IV, Random, 95% CI) | Subtotals only | |
| 5.1 Medium‐term (at 12 months) | 2 | 294 | Mean Difference (IV, Random, 95% CI) | 5.97 [‐1.33, 13.27] |
| 5.2 long‐term (at 18 months) | 1 | 28 | Mean Difference (IV, Random, 95% CI) | ‐3.20 [‐14.05, 7.65] |
| 6 Functioning 2.a specific: social functioning, average total score, medium‐term (at 12 months), SAS II (higher score = worse) | 1 | 67 | Mean Difference (IV, Random, 95% CI) | 0.40 [‐0.07, 0.87] |
| 7 Functioning 2.b.i. specific: social functioning, average total score, long‐term (at 18 months), SFS (higher score = better) | 1 | 28 | Mean Difference (IV, Random, 95% CI) | 9.10 [‐5.65, 23.85] |
| 8 Functioning 2.b.ii. specific: social functioning, average total score, medium‐term (at 18 months), SOFAS (higher score = better) | 1 | 140 | Mean Difference (IV, Random, 95% CI) | 2.0 [‐2.39, 6.39] |
| 9 Quality of life: average total score, long‐term (at 18 months), MANSA (higher score = better) | 1 | 140 | Mean Difference (IV, Random, 95% CI) | 1.5 [‐2.93, 5.93] |
| 10 Cost: cumulative, USD, skewed data | Other data | No numeric data | ||
| 10.1 Antipsychotic medication: 0‐18 months | Other data | No numeric data | ||
| 10.2 Antipsychotic medication: by 4 years | Other data | No numeric data | ||
| 10.3 Productivity costs: 0‐18 months | Other data | No numeric data | ||
| 10.4 Service use: 0‐18 months | Other data | No numeric data | ||
| 10.5 Service use: by 4 years | Other data | No numeric data | ||
| 10.6 Travel: 0‐18 months | Other data | No numeric data | ||
| 10.7 Travel: by 4 years | Other data | No numeric data | ||
| 10.8 Total: 0‐18 months | Other data | No numeric data | ||
| 10.9 Total: by 4 years | Other data | No numeric data | ||
| 11 Satisfaction with treatment: leaving the study early, end point data | 5 | Risk Ratio (M‐H, Random, 95% CI) | Subtotals only | |
| 11.1 By between > 1 year to 2 years | 4 | 668 | Risk Ratio (M‐H, Random, 95% CI) | 0.98 [0.87, 1.10] |
| 11.2 By between > 2 years to 4 years (additional follow‐up) | 2 | 261 | Risk Ratio (M‐H, Random, 95% CI) | 0.96 [0.74, 1.24] |
Comparison 6. Group B: cognitive behavioural therapy (CBT), CBT + risperidone vs CBT + placebo.
| Outcome or subgroup title | No. of studies | No. of participants | Statistical method | Effect size |
|---|---|---|---|---|
| 1 Prodromal symptoms: transition to psychosis, end point data | 1 | 87 | Risk Ratio (M‐H, Random, 95% CI) | 1.02 [0.39, 2.67] |
| 2 Mental state specific: average end point scores, medium‐term (at 12 months), various scales (higher score = worse), skewed data | Other data | No numeric data | ||
| 2.1 Psychopathology: total, end point data, BPRS | Other data | No numeric data | ||
| 2.2 Negative symptoms: attention, end point data, SANS | Other data | No numeric data | ||
| 2.3 Negative symptoms: total, end point data, SANS | Other data | No numeric data | ||
| 3 Functioning global: average end point score, medium‐term (at 12 months), GAF (higher score = better) | 1 | 52 | Mean Difference (IV, Random, 95% CI) | ‐2.0 [‐6.55, 2.55] |
| 4 Adverse effects 1 specific: doctors' assessment of adverse effects, medium‐term (at 12 months), UKU | 1 | 65 | Risk Ratio (M‐H, Random, 95% CI) | 1.03 [0.55, 1.91] |
| 5 Adverse effects 2 specific: adverse effects reported by participants, medium‐term (at 12 months), UKU | 1 | 65 | Risk Ratio (M‐H, Random, 95% CI) | 2.01 [0.90, 4.53] |
| 6 Quality of life: average end point score, medium‐term (at 12 months), QLS (higher score = better) | 1 | 51 | Mean Difference (IV, Random, 95% CI) | 5.70 [‐7.86, 19.26] |
| 7 Satisfaction with treatment: leaving the study early, end point data | 1 | 87 | Risk Ratio (M‐H, Random, 95% CI) | 1.09 [0.62, 1.92] |
Comparison 7. Group B: cognitive behavioural therapy (CBT), CBT (specific preventive intervention (SPI) + needs‐based intervention (NBI) + risperidone vs NBI.
| Outcome or subgroup title | No. of studies | No. of participants | Statistical method | Effect size |
|---|---|---|---|---|
| 1 Prodromal symptoms: transition to psychosis, end point data | 1 | Risk Ratio (M‐H, Random, 95% CI) | Subtotals only | |
| 1.1 Medium‐term (at 12 months) | 1 | 59 | Risk Ratio (M‐H, Random, 95% CI) | 0.54 [0.23, 1.30] |
| 1.2 Long‐term (up to 4 years) | 1 | 59 | Risk Ratio (M‐H, Random, 95% CI) | 0.75 [0.39, 1.46] |
| 2 Mental state specific: average end point scores, various scales (high score = worse), skewed data | Other data | No numeric data | ||
| 2.1 Anxiety: immediately post‐treatment, HRSA | Other data | No numeric data | ||
| 2.2 Anxiety: medium‐term (at 12 months), HRSA | Other data | No numeric data | ||
| 2.3 Anxiety: long‐term (at 4 years), HRSA | Other data | No numeric data | ||
| 2.4 Depression: immediately post‐treatment, HRSD | Other data | No numeric data | ||
| 2.5 Depression: medium‐term (at 12 months), HRSD | Other data | No numeric data | ||
| 2.6 Depression: long‐term (at 4 years), HRSD | Other data | No numeric data | ||
| 2.7 Mania: immediately post‐treatment, YMS | Other data | No numeric data | ||
| 2.8 Mania: medium‐term (at 12 months), YMS | Other data | No numeric data | ||
| 2.9 Mania: long‐term (at 4 years), YMS | Other data | No numeric data | ||
| 2.10 Negative symptoms: immediately post‐treatment, SANS | Other data | No numeric data | ||
| 2.11 Negative symptoms: medium‐term (at 12 months), SANS | Other data | No numeric data | ||
| 2.12 Negative symptoms: long‐term (at 4 years), SANS | Other data | No numeric data | ||
| 2.13 Psychopathology: total, immediately post‐treatment, BPRS | Other data | No numeric data | ||
| 2.14 Psychopathology: total, medium‐term (at 12 months), BPRS | Other data | No numeric data | ||
| 2.15 Psychopathology: total, long‐term (at 4 years), BPRS | Other data | No numeric data | ||
| 3 Functioning global: average end point score, GAF (higher score = better) | 1 | Mean Difference (IV, Random, 95% CI) | Subtotals only | |
| 3.1 Medium‐term (at 12 months) | 1 | 40 | Mean Difference (IV, Random, 95% CI) | ‐0.62 [‐5.81, 4.57] |
| 3.2 Long‐term (up to 4 years) | 1 | 40 | Mean Difference (IV, Random, 95% CI) | ‐2.40 [‐12.32, 7.52] |
| 4 Quality of life: average end point score, QLS (higher score = better) | 1 | Mean Difference (IV, Random, 95% CI) | Subtotals only | |
| 4.1 Immediately post‐treatment | 1 | 40 | Mean Difference (IV, Random, 95% CI) | 2.83 [‐13.07, 18.73] |
| 4.2 Medium‐term (at 12 months) | 1 | 40 | Mean Difference (IV, Random, 95% CI) | ‐2.12 [‐15.43, 11.19] |
| 4.3 Long‐term (up to 4 years) | 1 | 40 | Mean Difference (IV, Random, 95% CI) | ‐2.03 [‐16.90, 12.84] |
| 5 Cost: average cost of treatment, AUD, skewed data | Other data | No numeric data | ||
| 5.1 Inpatient costs: post‐treatment | Other data | No numeric data | ||
| 5.2 Inpatient costs: medium‐term (at 12 months) | Other data | No numeric data | ||
| 5.3 Inpatient costs: long‐term (at 36 months) | Other data | No numeric data | ||
| 5.4 Outpatient costs: post‐treatment | Other data | No numeric data | ||
| 5.5 Outpatient costs: medium‐term (at 12 months) | Other data | No numeric data | ||
| 5.6 Pharmacology costs: post‐treatment | Other data | No numeric data | ||
| 5.7 Outpatient costs: long‐term (at 36 months) | Other data | No numeric data | ||
| 5.8 Pharmacology costs: medium‐term (at 12 months) | Other data | No numeric data | ||
| 5.9 Pharmacology costs: long‐term (at 36 months) | Other data | No numeric data | ||
| 5.10 Total costs: post‐treatment | Other data | No numeric data | ||
| 5.11 Total costs: medium‐term (at 12 months) | Other data | No numeric data | ||
| 5.12 Total costs: long‐term (at 36 months) | Other data | No numeric data | ||
| 6 Satisfaction with treatment: leaving the study early | 1 | Risk Ratio (M‐H, Random, 95% CI) | Subtotals only | |
| 6.1 Medium‐term (at 12 months) | 1 | 59 | Risk Ratio (M‐H, Random, 95% CI) | 0.0 [0.0, 0.0] |
| 6.2 Long‐term (up to 4 years) | 1 | 59 | Risk Ratio (M‐H, Random, 95% CI) | 0.57 [0.26, 1.28] |
Comparison 8. Group C: cognitive behavioural therapy (CBT), CBT + placebo vs supportive therapy + placebo.
| Outcome or subgroup title | No. of studies | No. of participants | Statistical method | Effect size |
|---|---|---|---|---|
| 1 Prodromal symptoms: transition to psychosis, end point data | 1 | 72 | Risk Ratio (M‐H, Random, 95% CI) | 0.74 [0.28, 1.98] |
| 2 Mental state specific: average end point scores, medium‐term (at 12 months), various scales (higher score = worse), skewed data | Other data | No numeric data | ||
| 2.1 Psychopathology: total, end point data, BPRS | Other data | No numeric data | ||
| 2.2 Negative symptoms: attention, end‐point data, SANS | Other data | No numeric data | ||
| 2.3 Negative symptoms: total, end point data, SANS | Other data | No numeric data | ||
| 3 Functioning global: average end point scores, medium‐term (at 12 months), GAF (higher score = better) | 1 | 45 | Mean Difference (IV, Random, 95% CI) | 2.20 [‐4.59, 8.99] |
| 4 Adverse effects 1 specific: doctors' assessment of adverse effects, medium‐term (at 12 months), UKU | 1 | 51 | Risk Ratio (M‐H, Random, 95% CI) | 1.39 [0.61, 3.18] |
| 5 Adverse effects 2 specific: adverse effects reported by participants, medium‐term (at 12 months), UKU | 1 | 51 | Risk Ratio (M‐H, Random, 95% CI) | 0.91 [0.32, 2.60] |
| 6 Quality of life: average end point scores, medium‐term (at 12 months), QLS (higher score = better) | 1 | 44 | Mean Difference (IV, Random, 95% CI) | ‐3.30 [‐18.76, 12.16] |
| 7 Satisfaction with treatment: leaving the study early, end point data | 1 | 72 | Risk Ratio (M‐H, Random, 95% CI) | 1.06 [0.54, 2.09] |
Comparison 9. Group C: cognitive behavioural therapy (CBT), CBT + supportive intervention vs non‐directive reflective listening + supportive intervention.
| Outcome or subgroup title | No. of studies | No. of participants | Statistical method | Effect size |
|---|---|---|---|---|
| 1 Prodromal symptoms: transition to psychosis, end point data | 1 | 57 | Risk Ratio (M‐H, Random, 95% CI) | 6.32 [0.34, 117.09] |
| 2 Functioning 1 global: average total score, short‐term (at 6 months), GAF (higher score = better) | 1 | 34 | Mean Difference (IV, Random, 95% CI) | ‐4.48 [‐12.81, 3.85] |
| 3 Functioning 2 specific: social functioning, average total score, short‐term (at 6 months), SOFAS (higher score = better) | 1 | 34 | Mean Difference (IV, Random, 95% CI) | ‐6.47 [‐15.30, 2.36] |
| 4 Satisfaction with treatment: leaving the study early, end point data | 1 | 57 | Risk Ratio (M‐H, Random, 95% CI) | 1.35 [0.81, 2.25] |
Comparison 10. Group C: cognitive behavioural therapy (CBT), CBT + risperidone vs supportive therapy + placebo.
| Outcome or subgroup title | No. of studies | No. of participants | Statistical method | Effect size |
|---|---|---|---|---|
| 1 Prodromal symptoms: transition to psychosis, end point data | 1 | 71 | Risk Ratio (M‐H, Random, 95% CI) | 0.76 [0.28, 2.03] |
| 2 Mental state specific: average end point scores, medium‐term (at 12 months), various scales (higher score = worse), skewed data | Other data | No numeric data | ||
| 2.1 Psychopathology: total, end point data, BPRS | Other data | No numeric data | ||
| 2.2 Negative symptoms: attention, end point data, SANS | Other data | No numeric data | ||
| 2.3 Negative symptoms: total, end point data, SANS | Other data | No numeric data | ||
| 3 Functioning global: average end point score, medium‐term (at 12 months), GAF (higher score = better) | 1 | 45 | Mean Difference (IV, Random, 95% CI) | 0.20 [‐6.83, 7.23] |
| 4 Adverse effects 1 specific: doctors' assessment of adverse effects, medium‐term (at 12 months), UKU | 1 | 58 | Risk Ratio (M‐H, Random, 95% CI) | 1.43 [0.64, 3.16] |
| 5 Adverse effects 2 specific: adverse effects reported by participants, medium‐term (at 12 months), UKU | 1 | 58 | Risk Ratio (M‐H, Random, 95% CI) | 1.83 [0.77, 4.34] |
| 6 Quality of life: average end point scores, medium‐term (at 12 months), QLS (higher score = better) | 1 | 43 | Mean Difference (IV, Random, 95% CI) | 2.40 [‐9.91, 14.71] |
| 7 Satisfaction with treatment: leaving the study early, end point data | 1 | 71 | Risk Ratio (M‐H, Random, 95% CI) | 1.16 [0.60, 2.25] |
Comparison 11. Group C: other, cognitive training vs active control (tablet games).
| Outcome or subgroup title | No. of studies | No. of participants | Statistical method | Effect size |
|---|---|---|---|---|
| 1 Mental state 1 specific: average total scores, various scales (higher score = worse), skewed data | Other data | No numeric data | ||
| 1.1 Psychosis risk symptoms: total, average total score, long‐term (at 24 months), SOPS | Other data | No numeric data | ||
| 1.2 Psychosis risk symptoms: negative, average total score, long‐term (at 24 months), SOPS | Other data | No numeric data | ||
| 1.3 Psychosis risk symptoms: disorganised, average total score, long‐term (at 24 months), SOPS | Other data | No numeric data | ||
| 1.4 Psychosis risk symptoms: general, average total score, long‐term (at 24 months), SOPS | Other data | No numeric data | ||
| 1.5 Social anxiety: fear of negative evaluation, average end point score, short‐term (at 4 months), SAS‐A | Other data | No numeric data | ||
| 1.6 Social anxiety: avoidance/distress in new situations, average end point score, short‐term (at 4 months), SAS‐A | Other data | No numeric data | ||
| 1.7 Social anxiety: social avoidance and distress, average end point score, short‐term (at 4 months), SAS‐A | Other data | No numeric data | ||
| 2 Mental state 2 specific: depression, average end point score, short‐term (at 4 months), BDI‐II (higher score = worse) | 1 | 62 | Mean Difference (IV, Random, 95% CI) | 0.99 [‐1.72, 3.70] |
| 3 Mental state 3.a specific: cognitive, average end point score, short‐term (at 4 months) | 1 | Mean Difference (IV, Random, 95% CI) | Subtotals only | |
| 3.1 Processing speed (Minnesota Clerical Test, T score, higher score = better) | 1 | 62 | Mean Difference (IV, Random, 95% CI) | 6.25 [1.70, 10.80] |
| 3.2 Processing speed (Digit Symbol Coding, higher score = better) | 1 | 62 | Mean Difference (IV, Random, 95% CI) | 1.69 [0.69, 2.69] |
| 4 Mental state 3.b specific: cognitive, average total score (presented as LSM = least square means estimated by the generalised linear mixed models), short‐term (at 3 months), MATRICS, higher score = better) | 1 | Mean Difference (IV, Random, 95% CI) | Subtotals only | |
| 4.1 Attention/vigilance | 1 | 25 | Mean Difference (IV, Random, 95% CI) | ‐3.12 [‐11.48, 5.24] |
| 4.2 Speed of processing | 1 | 25 | Mean Difference (IV, Random, 95% CI) | ‐2.58 [‐9.72, 4.56] |
| 4.3 Reasoning and problem solving | 1 | 25 | Mean Difference (IV, Random, 95% CI) | ‐1.84 [‐8.32, 4.64] |
| 4.4 Verbal learning | 1 | 25 | Mean Difference (IV, Random, 95% CI) | ‐0.19 [‐5.00, 6.62] |
| 4.5 Visual learning | 1 | 25 | Mean Difference (IV, Random, 95% CI) | ‐4.39 [‐11.10, 2.32] |
| 4.6 Working memory | 1 | 25 | Mean Difference (IV, Random, 95% CI) | 3.56 [‐4.88, 12.00] |
| 5 Functioning 1 global: average total score, long‐term (at 24 months), GAF (higher score = better) | 1 | 83 | Mean Difference (IV, Random, 95% CI) | 0.36 [‐5.34, 6.06] |
| 6 Functioning 2 specific: role functioning, GFR (higher score = better) | 2 | Mean Difference (IV, Random, 95% CI) | Subtotals only | |
| 6.1 Role functioning: average total score (presented as LSM = least square means estimated by the generalised linear mixed models), short‐term (at 3 months) | 1 | 25 | Mean Difference (IV, Random, 95% CI) | ‐1.27 [‐1.84, ‐0.70] |
| 6.2 Role functioning: average total score, long‐term (at 24 months) | 1 | 83 | Mean Difference (IV, Random, 95% CI) | ‐0.23 [‐1.37, 0.91] |
| 7 Functioning 3.a specific: social functioning, GFS (higher score = better) | 2 | Mean Difference (IV, Random, 95% CI) | Subtotals only | |
| 7.1 Social functioning: average total score (presented as LSM = least square means estimated by the generalised linear mixed models), short‐term (at 3 months) | 1 | 25 | Mean Difference (IV, Random, 95% CI) | ‐0.68 [‐2.12, 0.76] |
| 7.2 Social functioning: average total score, long‐term (at 24 months) | 1 | 83 | Mean Difference (IV, Random, 95% CI) | 0.26 [‐0.52, 1.04] |
| 8 Functioning 3.b specific: social functioning, average end point score, short‐term (at 4 months), SAS‐SR (higher score = worse) | 1 | 62 | Mean Difference (IV, Random, 95% CI) | ‐0.64 [‐0.94, ‐0.34] |
| 9 Satisfaction with treatment: leaving the study early, end point data | 3 | 177 | Risk Ratio (M‐H, Random, 95% CI) | 0.93 [0.82, 1.05] |
| 9.1 Short‐term (by 2 months), PST | 1 | 62 | Risk Ratio (M‐H, Random, 95% CI) | 0.93 [0.81, 1.06] |
| 9.2 Medium‐term (by 9 months), AT | 1 | 32 | Risk Ratio (M‐H, Random, 95% CI) | 1.22 [0.64, 2.32] |
| 9.3 Long‐term (by 24 months), AT | 1 | 83 | Risk Ratio (M‐H, Random, 95% CI) | 0.78 [0.48, 1.29] |
Comparison 12. Group C: other, family treatment vs enhanced care.
| Outcome or subgroup title | No. of studies | No. of participants | Statistical method | Effect size |
|---|---|---|---|---|
| 1 Prodromal symptoms: transition to psychosis | 2 | 229 | Risk Ratio (M‐H, Random, 95% CI) | 0.54 [0.18, 1.59] |
| 1.1 Short‐term (6 months), FFT | 1 | 129 | Risk Ratio (M‐H, Random, 95% CI) | 0.19 [0.02, 1.59] |
| 1.2 Long‐term (24 months), FACT | 1 | 100 | Risk Ratio (M‐H, Random, 95% CI) | 0.71 [0.35, 1.45] |
| 2 Global state: antipsychotic prescription, short‐term (by 6 months) | 1 | 129 | Risk Ratio (M‐H, Random, 95% CI) | 1.18 [0.69, 2.02] |
| 3 Mental state specific: psychosis risk positive symptoms, average total score, short‐term (at 6 months), SOPS positive (higher score = worse) | 1 | 102 | Mean Difference (IV, Random, 95% CI) | ‐2.01 [‐3.87, ‐0.15] |
| 4 Functioning global: average total score, long‐term (at 24 months), GAF (higher score = better) | 1 | 69 | Mean Difference (IV, Fixed, 95% CI) | 5.15 [‐1.90, 12.20] |
| 5 Adverse events 1.a specific: suicide, long‐term (by 24 months), events | 1 | 100 | Risk Ratio (M‐H, Random, 95% CI) | 1.0 [0.06, 15.55] |
| 6 Adverse events 1.b specific: suicide, long‐term (by 24 months), participants affected/at risk | 1 | 100 | Risk Ratio (M‐H, Random, 95% CI) | 1.0 [0.06, 15.55] |
| 7 Satisfaction with treatment: leaving the study early | 2 | 229 | Risk Ratio (M‐H, Random, 95% CI) | 0.81 [0.52, 1.26] |
| 7.1 Short‐term (6 months), FFT | 1 | 129 | Risk Ratio (M‐H, Random, 95% CI) | 0.66 [0.33, 1.30] |
| 7.2 Long‐term (24 months), FACT) | 1 | 100 | Risk Ratio (M‐H, Random, 95% CI) | 0.94 [0.52, 1.68] |
Comparison 13. Group C: other, integrated treatment vs standard treatment.
| Outcome or subgroup title | No. of studies | No. of participants | Statistical method | Effect size |
|---|---|---|---|---|
| 1 Prodromal symptoms: transition to psychosis, end point data, long‐term (by 2 years) | 1 | 79 | Risk Ratio (M‐H, Random, 95% CI) | 0.57 [0.28, 1.15] |
| 2 Mental state specific: average total score, long‐term (at 2 years), various scales (higher score = worse), skewed data | Other data | No numeric data | ||
| 2.1 Negative symptoms: total average score, SANS | Other data | No numeric data | ||
| 3 Satisfaction with treatment: leaving the study early, end point data | 1 | 79 | Risk Ratio (M‐H, Random, 95% CI) | 0.66 [0.25, 1.73] |
Characteristics of studies
Characteristics of included studies [ordered by study ID]
ADAPT‐Canada.
| Methods | Allocation: randomised
Blinding: single Setting: community Duration: 18 months (6 months treatment, 12 months follow‐up) Recruitment and ascertainment: included advertisement on radio, public transit and local newspaper Inclusion criteria: clinical high‐risk participants (COPS, from SIPS; Miller 1999). Exclusion criteria: any Axis I psychotic disorder, prior antipsychotic treatment, IQ < 70, history of clinically significant central nervous system disorder |
|
| Participants | Diagnosis: people at high risk of developing psychosis N = 51 Sex: 36 male, 15 female Age: 14‐30 years, mean ˜21 ± 5 years |
|
| Interventions | 1. CBT: manualised problem‐focused, time‐limited treatment of up to 26 sessions within 6 months, mean 12 sessions. N = 27 2. Standard care: an active psychological treatment directly assisting individuals to cope with current problems. N = 24 |
|
| Outcomes | Transition to psychosis: POPS criteria Leaving the study early Mental state: SOPS, CDSS, SPS, SIAS Functioning: SFS, GAF Unable to use: Satisfaction with treatment: WAI‐SF (no usable data) Mental state: BAS, SPAI2 (no data) Physical: CMRS, GHQ2 (no data) Economics: cost‐effectiveness (no data) |
|
| Notes | Funding: grant from Ontario Mental Health Research Foundation, Ontario Canada Power, sample size calculation: "In designing this study sample size calculations were based on current reported rates in the literature. We expected a transition rate of 40% in the control group with a 50% reduction in transition for the active treatment group, i.e. a reduction of transition rate from 40% to 20%, a difference which would be clinically significant. Using a formula based on comparing the proportions of subjects in two groups who exhibit an outcome (40% to 20%) (Streiner 1990) sample size estimates for two‐tailed tests with a significance level of 0.05 and a power of 80% were 83 per group." Adherence: see Table 14. |
|
| Risk of bias | ||
| Bias | Authors' judgement | Support for judgement |
| Random sequence generation (selection bias) | Low risk | Randomised immediately after the baseline assessment using concealed stratified randomisation with minimisation. Participants stratified by sex and severity of the prodromal symptoms |
| Allocation concealment (selection bias) | Unclear risk | Not described |
| Blinding of participants and personnel (performance bias) All outcomes | High risk | Single‐blind (clinical raters and attending psychiatrists blinded, participants not blinded) |
| Blinding of outcome assessment (detection bias) All outcomes | Low risk | Clinical raters and attending psychiatrists were blinded |
| Incomplete outcome data (attrition bias) All outcomes | Unclear risk | Out of 51 randomised, 23 dropped out before the 24‐ month assessment (attrition 45%). Attrition rate CBT group was 44% (N = 12) and 46% in the supportive therapy group (N = 11). The reasons for study discontinuation were reported. |
| Selective reporting (reporting bias) | Unclear risk | BAS, SPAI2, CMRS, GHQ2, as well as cost‐effectiveness not reported. We contacted the corresponding author for clarification and received this response: "cost effectiveness was never done and some of those measures were not used or completed." SAS and SIAS reported in manuscript, but not in the published protocol on ClinicalTrials.gov (NCT00260273). We contacted the corresponding author for clarification, who responded that she can not explain this discrepancy because "this was registered by my study coordinator who may have forgotten". |
| Other bias | Low risk | We did not identify any other sources of bias |
Amminger‐Austria.
| Methods | Allocation: randomised
Blinding: double‐blind (participant, care provider, investigator, outcomes assessor) Setting: Vienna, Austria; the major referral source was the outpatient service (52, 64.2%). Also derived from psychiatrists and psychologists from the department, other youth services or adult mental health services and private mental health professionals Duration: 12 months (12 weeks intervention + 36 weeks monitoring). Thereafter 7‐year follow‐up |
|
| Participants | Diagnosis: people at high risk of developing psychosis N = 81 Sex: men and women Age: 13‐25 years |
|
| Interventions | 1. omega‐3 fatty acids: dose 4 capsules daily – each containing 700 mg of eicosapentaenoic acid, 500 mg of docosahexaenoic acid and 10 mg of Vitamin E. N = 41 2. Placebo (coconut oil capsules matched with appearance and taste). N = 40 Concomitant medication use after randomisation was allowed: antidepressants and benzodiazepines. Existing medication was re‐evaluated at baseline and continued in case of clinical indication. Psychological and psychosocial interventions as well as additional appointments for crisis management were provided. |
|
| Outcomes | Transition to PANSS‐defined first episode psychosis Leaving the study early Mental state: PANSS, MADRS Functioning: GAF Adverse effects: UKU Global state: prescription of antipsychotic medication (assumed to represent the severity of psychotic phenomena) Additional outcomes: physiological: neuroinflammation biomarkers, EEG activity, phospholipid metabolism, erythrocyte membrane fatty acid composition and intracellular phospholipase A2 activity |
|
| Notes | Cut‐off points on PANSS subscales, (≥ 4 hallucinations, ≥ 4 delusions, and ≥ 5 conceptual disorganisation). Funding: Grant 03T‐315 from the Stanley Medical Research Institute. Power, sample size calculation: "The study was powered to detect a 50% reduction in the expected transition rate, corresponding to a transition rate of 20% in the ‐3 group and an anticipated rate of 40% in the placebo group. Power analysis indicated that 75 subjects would provide a 70% chance of detecting such an effect (2‐sided level of.05). Allowing for a 5%to 10% dropout rate, we sought to recruit at least 80 participants." Adherence: see Table 14 |
|
| Risk of bias | ||
| Bias | Authors' judgement | Support for judgement |
| Random sequence generation (selection bias) | Low risk | Computer‐generated random sequence based on a block‐randomised design. Stratified according to MADRS. Two strata with block size of 4 within each stratum. |
| Allocation concealment (selection bias) | Unclear risk | Quote: "Randomisation kept in a remote secure location and administered by an independent third party until all study data were collected and verified." Comment: precise method of allocation concealment not described |
| Blinding of participants and personnel (performance bias) All outcomes | Low risk | Participants, parents, and those involved in administering interventions, assessing outcomes, data entry, and/or data analyses were blind to group assignments. |
| Blinding of outcome assessment (detection bias) All outcomes | Low risk | Participants, parents, and those involved in administering interventions, assessing outcomes, data entry, and/or data analyses were blind to group assignments. |
| Incomplete outcome data (attrition bias) All outcomes | Low risk | Out of 81 randomised participants, 5 discontinued the study before 12 months' follow‐up (attrition 6%). Attrition rate was 8% in the omega‐3 fatty acids group (N = 3: 1 participant/parent decision, 1 physician decision, participant moved out of the country) and 7% in the placebo group (N = 2: 2 participant/parent decisions) |
| Selective reporting (reporting bias) | Low risk | All outcomes mentioned in registered protocol (NCT00396643) and publications' methods reported |
| Other bias | Low risk | We did not identify any other sources of bias |
Choi‐USA.
| Methods | Allocation: randomised (no details) Blinding: double‐blind (participants, assessors) Setting: New York, USA Duration: 4 months (2 months of treatment + 2 months' follow‐up) |
|
| Participants | Diagnosis: people at high risk of developing psychosis N = 62 Sex: men and women (˜50% M:F) Age: 16‐24 years, mean ˜18 SD 4 years Inclusion criteria: SIPS/SOPS criteria (Miller 1999), English‐speaking, age 16‐30, processing speed at least 0.5 SD below the norm Exclusion criteria: prior diagnosis of Axis I psychotic disorder, major medical or neurological disorder, IQ < 70, attenuated positive symptoms occurring solely in the context of substance use or withdrawal, risk for suicide or violence not commensurate with outpatient treatment, substance abuse diagnosis in past 3 months |
|
| Interventions | 1. PST: cognitive training using pupillometric neurofeedback techniques to adjust training parameters in real time, groups of 2 or 3 participants on tablets for approximately 30 h over the course of 2 months (about 3.5 to 4.0 h per week). N = 30 2. Active control group: commercially available tablet games in same format and duration as PST. N = 32 Participants continued with their regular treatment while participating in the study. |
|
| Outcomes | Leaving the study at 2 months (post‐intervention assessment) Mental state: BDI‐II, WAIS‐III (digit symbol‐coding subtest), MCT, SAS‐A Functioning: SAS‐SR Unable to use: Leaving the study at 2‐month follow‐up (data unclear) Cognition: CPT‐IP, WMI (data not reported) |
|
| Notes | Funding: in part by a Brain & Behavior Research Foundation Grant (CU‐17748) and NIMH K23. K23MH086755‐05 to Jimmy Choi Power, sample size calculation: not reported Adherence: see Table 14 |
|
| Risk of bias | ||
| Bias | Authors' judgement | Support for judgement |
| Random sequence generation (selection bias) | Unclear risk | Randomisation method not described |
| Allocation concealment (selection bias) | Unclear risk | Not described |
| Blinding of participants and personnel (performance bias) All outcomes | Low risk | Double‐blind study (adequacy of blinding assessed in study) |
| Blinding of outcome assessment (detection bias) All outcomes | Low risk | Quote: "All assessments were conducted by a graduate‐level research assistant blind to randomisation status, while the intervention was conducted by a different graduate‐level research assistant. The participants and research assistant conducting assessments completed a best guess rating form at 2 month follow‐up to assess adequacy of the blind (adequate blind defined as rate of correct guessing ≤ 50%)." |
| Incomplete outcome data (attrition bias) All outcomes | Unclear risk | Out of 62 randomised participants, 4 did not complete the 2‐month intervention (attrition 6%) and additional 2 did not complete 2‐month post‐treatment follow‐up (attrition 10%). Attrition rate across treatment groups is not clearly described. Study authors stated that there was attrition rate of 10% (N = 3) at the end of treatment. As there is no data about dropouts from the active control group at both assessments nor data about dropouts from PST group at 2‐month follow‐up, it remains unclear whether the additional 2 dropouts at 2‐month follow‐up are from PST or active control group. |
| Selective reporting (reporting bias) | Unclear risk | All outcomes mentioned in the publication methods were reported except the CPT‐IP, WMI |
| Other bias | Low risk | We did not identify any other sources of bias |
DEPTh‐Australia.
| Methods | Allocation: randomised Blinding: double‐blind Setting: Newcastle and New South Wales, Australia Inclusion criteria: age 14‐30 years, resided within the boundaries of one of the relevant Health Services, met criteria for UHR status defined by the CAARMS (Yung 2005). Exclusion criteria: DSM‐IV psychotic disorder, previously prescribed antipsychotic medication, organic mental disorder or intellectual disability, serious suicidal/homicidal risk, inadequate English Duration: 18 months (6 months of treatment + 12 months of follow‐up) |
|
| Participants | Diagnosis: people at high risk of developing psychosis N = 57 Sex: men and women, ˜40:60% M:F Age: average ˜16 years SD 3 History: participants reimbursed AUD 20 for time and travel at each assessment occasion |
|
| Interventions | 1. CBT, problem‐oriented, time‐limited, educational, manualised model: average 9.2 sessions during 6 months. N = 30 2. NDRL, manualised person‐centred counselling: average 10.1 sessions during 6 months. N = 27 All participants offered casework and non‐structured family education and supports. |
|
| Outcomes | Transition to psychosis: 6 months: CAARMS Leaving the study: 12 months Mental state: CAARMS, BSI, 6 months Functioning: GAF, SOFAS, 6 months Quality of life: QLS, 6 months Unable to use: Transition to psychosis: CAARMS, BSI – 12 months (> 50% attrition rate) Functioning: SOFAS, GAF – 12 months (> 50% attrition rate) Quality of life: QOL – 12 months (> 50% attrition rate) Self‐esteem: Rosenberg Self Esteem Scale, Meta‐cognitions Questionnaire (data not reported) Additional outcomes: Addiction: OTI, Alcohol Use Disorders Identification Test, Cannabis Use Disorders Identification Test, Severity of Dependence Scale (Cannabis) |
|
| Notes | 1 participant re‐randomised, after breaking the blinding (after the initial assessment, but prior to commencing therapy) Funding: National Health and Medical Research Council, NHMRC (Grant number: 401230) Power, sample size calculation: "Based on an effect size of XX, as found in the EDIE trial (Morrison 2004) for those making a transition to psychosis within six months, the sample required to have 80% power with 5% significance for a two‐tailed test of differences in proportions was 39 in each treatment arm. Consistent with other studies of UHR young people, there were difficulties recruiting to the trial with 25% fewer participants than planned and thus the trial was underpowered. The recruitment phase was funded for two years only and thus we were unable to continue to recruit beyond this time." Adherence: see Table 14 |
|
| Risk of bias | ||
| Bias | Authors' judgement | Support for judgement |
| Random sequence generation (selection bias) | Low risk | Computer‐generated block randomisation, stratified by site and antidepressant medication) |
| Allocation concealment (selection bias) | Unclear risk | Quote: "The allocation list was kept in a secure location by an independent clerical worker, not accessible by the research team." Comment: precise method of allocation concealment was not described |
| Blinding of participants and personnel (performance bias) All outcomes | High risk | Participants not blinded |
| Blinding of outcome assessment (detection bias) All outcomes | Low risk | Research assistants who completed assessments remained blind to randomisation. Extensive steps taken to maintain blindness of raters. Therapist and raters did not discuss details of individual participants. Blinding was broken in one case, after the initial assessment, but prior to commencing therapy. In this case, the participant was re‐randomised. |
| Incomplete outcome data (attrition bias) All outcomes | High risk | Out of 57 participants, 27 discontinued the study before 12 month follow‐up assessment (attrition 53%). Attrition rate was 60% in the CBT (N = 18) and 56% in the NDRL group (N = 12). No details for study discontinuation reported |
| Selective reporting (reporting bias) | Low risk | All outcomes mentioned in the registered protocol (ACTRN12606000101583) and in the publications' methods were reported in the manuscript. |
| Other bias | Low risk | We did not identify any other sources of bias. |
EDIE‐2‐UK.
| Methods | Allocation: randomised Blinding: single (raters) Setting: Manchester, Birmingham, Worcestershire, Glasgow, Cambridgeshire, Norfolk, UK Inclusion criteria: CAARMS (Yung 2005), age 14‐35 years, seeking help for symptoms Exclusion criteria: current or previous receipt of antipsychotic medication > 2 days, moderate‐severe learning disability, organic impairment, non‐English speaking Duration: 24 months (6 months' treatment + 18 months' post‐treatment follow‐up) |
|
| Participants | Diagnosis: people at high risk for developing psychosis (Yung 2005) N = 288 Sex: men and women, ˜60:40% M:F Age: 14–34 years, average 21 SD 4, median 19 |
|
| Interventions | 1. Cognitive therapy: up to 25 weekly, 1‐h sessions plus up to 4 booster sessions (average 9.1) + monitoring. N = 144 2. Monitoring: N = 144 All participants monitored by monthly assessment for first 6 months, then every 3 months for up to 2 years |
|
| Outcomes | Leaving the study early Transition to psychosis: 12 months, follow‐up (CAARMS, Yung 2005) Mental state: CAARMS, BDI‐PC, SIAS, 12 months follow‐up. Functioning: GAF, 12 months follow‐up. Global state: PBEQ, 12 months' follow‐up Unable to use: Transition to psychosis: 24 months' follow‐up (CAARMS) (high attrition) Mental state: CAARMS, BDI‐PC, SIAS, 24 months' follow‐up (high attrition) Functioning: GAF, 24 months' follow‐up (high attrition) Global state: PBEQ, 24 months' follow‐up (high attrition) Quality of life: MANSA, EQ‐5D (lack of participants) Economic: incremental cost effectiveness ratio and associated net benefit statistic and probability of cost effectiveness derived from the cost‐effectiveness acceptability analysis (no data) Insight: Metacognitions Questionnaire (short form), Beliefs About Paranoia Scale, Persecution and Deservedness Scale, Brief Core Schema Scales, Interpretations of Voices Inventory, California Psychotherapy Alliance Scales (no data) |
|
| Notes | Funding: Medical Research Council (G0500264) and the Department of Health. Power, sample size calculation: Quote: "Power calculations showed that 242 participants (121 in each group) would be required based on assuming a 15% transition rate in the CBT group and a 30% transition rate in the control group. To allow for a dropout rate of up to 25%, we set our recruitment goal at 320 (80 each at Manchester, Birmingham and Glasgow, and 40 each at Cambridge and Norfolk)." Adherence: see Table 14 |
|
| Risk of bias | ||
| Bias | Authors' judgement | Support for judgement |
| Random sequence generation (selection bias) | Low risk | Participants randomised electronically using Open CDMS (Ainsworth 2007). Independent computer randomisation, blocks of 6 or 8 and stratified by site and gender, results concealed from the assessors. |
| Allocation concealment (selection bias) | Unclear risk | Quote: "Following the second baseline assessment, participants are randomised electronically within two working days using OpenCDMS23 University of Manchester, Manchester, UK). The randomisation algorithm uses blocks of six or eight and stratifies by site and gender. OpenCDMS then sends out an email notification of the allocation to the therapists and study manager. Thus, the results of the randomisation are concealed from the assessors and randomisation is independent." Comment: list concealed from assessors |
| Blinding of participants and personnel (performance bias) All outcomes | High risk | Participants not blinded |
| Blinding of outcome assessment (detection bias) All outcomes | Unclear risk | Quote: "Assessors were blind to treatment condition but 67 blind breaks were reported (22.2% of participants), 15 in the Monitoring group and 52 in CBT + monitoring group. Hence, blinding was successfully maintained for 78.8% of participants. In cases where blinding was broken, another rater assessed the patient for all subsequent assessments or the ratings were discussed with a blind rater and consensus reached (the latter was only carried out if there was a clinical justification not to switch, such as risk considerations or tentative engagement with the trial)." |
| Incomplete outcome data (attrition bias) All outcomes | High risk | Out of 288 randomised participants, only 65 were assessed at 24 months' follow‐up meaning that attrition was 77% (N = 223). In the cognitive therapy + monitoring group attrition rate was 76% (N = 110) and in the monitoring group 78% (N = 113). |
| Selective reporting (reporting bias) | Unclear risk | All outcomes mentioned in protocol (ISRCTN56283883) were reported in the manuscript, but more outcomes were mentioned in the publications' methods. These are listed above (outcomes) and but no data for them were reported. |
| Other bias | Low risk | We did not identify any other sources of bias. |
EDIE‐NL.
| Methods | Allocation: randomised Blinding: single blind (assessors) Setting: The Hague, Rivierduinen (Leiden and surroundings); Friesland, Netherlands Inclusion criteria: age 14‐35 years, genetic risk or CAARMS scores in range of At Risk Mental State (Miller 1999), impairment in social functioning, SOFAS score of ≤ 50 and/or drop in SOFAS score of 30% (Goldman 1992) Exclusion criteria: usage of antipsychotic medication ≥ 15 mg haloperidol equivalent, severe learning impairment, problems due to organic condition, insufficient competence in Dutch, history of psychosis Duration: initially 18 months (6 months' treatment, 12 months' post‐treatment follow‐up); additional 4‐year data reported |
|
| Participants | Diagnosis: UHR for developing psychosis N = 201 Sex: men and women, ˜50:50 M:F Age: range 14‐35 years, average ˜23 SD 6 History: patients diagnosed by routine psychiatric diagnostic procedures of mental health services (anxiety disorders (N = 53), depression (N = 52), mixed anxiety and depression (N = 10), personality disorders (N = 15), attention deficit hyperactivity disorder (N = 13), addiction problems (N = 12), eating disorders (N = 11), post‐traumatic stress disorder (N = 10), oppositional defiant disorder (N = 6), Asperger syndrome (N = 5), relationship problems (DSM‐V) (N = 5), and other problems (N = 9) |
|
| Interventions | 1. CBT: manualised protocol of maximum of 25 sessions, average 10 + TAU. N = 97 (94 analysed)*. 2. TAU: N = 104 (102 analysed)* |
|
| Outcomes | Transition to psychosis (CAARMS), at planned and additional follow‐up Leaving the study, at planned and additional follow‐up Mental state: CAARMS**, BDI‐ II‐ NL**, CDSS**, SIAS**, MANSA** Functioning: SOFAS**. Global state: PBIQ‐ R** Economics: cost‐effectiveness, at planned and additional follow‐up Unable to use: QOL: EQ‐5D (baseline values but used to calculate QALYs gained – not reported) Mental state: CAARMS, BDI‐ II‐ NL, CDS, SIAS, MANSA (at additional follow‐up data, results not presented for each group separately) Functioning: SOFAS (at additional follow‐up data, results not presented for each group separately). Global state: PBIQ‐ R (at additional follow‐up data, results not presented for each group separately) Cognitive function: verbal fluency test (animal naming) (no data reported) Additional outcomes: Drug and alcohol use: CIDI |
|
| Notes | *During the study, 5 participants were removed. 2 of them (1 in the CBT and 1 in the TAU group) were already psychotic at baseline (they had dissimulated their symptom levels with the purpose of being enrolled in the study). 3 of them revealed that they had antipsychotic treatment before for psychotic disorder (2 were in the CBT and 1 in the TAU group). These 5 participants were removed from the trial because they fulfilled the exclusion criteria, the decisions were made by the assessors who were blind to randomisation. **All secondary outcomes measures analyses based on participants who did not make a transition to psychosis. Funding: ZON‐MW, The Netherlands Organization for Health Research; Sponsor/Initiator: VU University Medical Center, Department of Clinical Psychology Power, sample size calculation: quote: "We calculated power on an expected transition rate of 35 percent over eighteen months with a 50 percent reduction of transitions in the CBT‐group. The sample we need for a 2‐tailed test of the proportions with an alpha of 0.05 and a power of.80 is 2 × 93 for the reduction of the transition to psychosis and 2 × 82 for the persistence of ARMS and 2 × 91 for the transition into psychosis. A conservative estimate of the drop‐out rate is twenty percent per year in schizophrenia research [24]. With an estimated 30 percent drop‐out over 18 months, we decided to include 240 persons in the trial." Adherence: see Table 14 |
|
| Risk of bias | ||
| Bias | Authors' judgement | Support for judgement |
| Random sequence generation (selection bias) | Low risk | Random allocation lists were generated by a web‐based automated randomisation system |
| Allocation concealment (selection bias) | Unclear risk | Quote: "The allocation list was kept in a remote secure location, and an independent person randomly allocated the included patients after they signed informed consent." Comment: precise method of allocation concealment not described |
| Blinding of participants and personnel (performance bias) All outcomes | High risk | Participants not blinded |
| Blinding of outcome assessment (detection bias) All outcomes | Low risk | Those who performed research assessments kept blind to randomisation |
| Incomplete outcome data (attrition bias) All outcomes | Low risk | Out of 201 randomised participants, 32 dropped out of the study (attrition 16%). Attrition rate in the CBT + TAU group was 18% (N = 17, 3 excluded from the analysis, 2 moved, 12 withdrew consent) and 14% in the TAU group (N = 15, 2 excluded from the analysis, 2 moved, 11 withdrew). |
| Selective reporting (reporting bias) | Unclear risk | Most of the outcomes mentioned in registered protocol (ISRCTN21353122) and publications' methods were reported except verbal fluency test (animal naming). Data for EQ‐5D were not usable for analysis as well as data for mental and global state, QOL and functioning at 4 years' additional follow‐up (see Outcomes section in table above). |
| Other bias | Low risk | We did not identify any other sources of bias. |
EDIE‐UK.
| Methods | Allocation: randomised Blinding: single (raters) Setting: Salford and Manchester, UK (community) Inclusion criteria: met adapted criteria by Yung 1998, age range 16‐36 years Exclusion criteria: < 16 or > 36 years, receipt of antipsychotic medication. Duration: 36 months (6 months of treatment + 30 months of post‐treatment follow‐up) |
|
| Participants | Diagnosis: people at high risk of developing psychosis N = 60 Sex: men and women, 70:30% M:F Age: range 16–36 years, average ˜22 SD 5 History: recruitment from primary care teams, student counselling services, accident and emergency departments, specialist services, and voluntary sector agencies |
|
| Interventions | 1. Cognitive therapy (manualised, problem oriented, time‐limited, educational intervention: up to 26 sessions + monitoring. N = 37* 2. Monitoring. N = 23 Both groups incorporated elements of case management for resolving crises regarding social issues and mental health risks. Medication not prescribed as part of study protocol |
|
| Outcomes | Transition to psychosis (according to cut‐off points on PANSS (Kay 1987)), at 12 months' follow‐up 2. Leaving the study Unable to use: Transition to psychosis – 3 years (no mean, SD; 55% lost to follow‐up) Mental state: PANSS – 3 years (no mean, SD; 55% lost to follow‐up) Global state: GAF, GHQ – 3 years (no mean, SD; 55% lost to follow‐up) Functioning: Sociotropy‐Autonomy Scale – 3 years (no mean, SD; 55% lost to follow‐up) Cognitive function: Meta‐Cognitions Questionnaire – 3 years (no mean, SD; 55% lost to follow‐up) Satisfaction: OLIFE – 3 years (no mean, SD; 55% lost to follow‐up) |
|
| Notes | Funding: North‐West NHS Executive Power, sample size calculation: not reported *37 in cognitive therapy + monitoring and 23 in monitoring group), 2 participants from cognitive therapy + monitoring group excluded from analysis due to developed psychosis meeting PANSS criteria at first assessment after randomisation and also reported having concealed psychotic symptoms during their initial assessment. Adherence: see Table 14 |
|
| Risk of bias | ||
| Bias | Authors' judgement | Support for judgement |
| Random sequence generation (selection bias) | Unclear risk | Quote: "Stratified random assignment by independent clerical worker." Stratified according to gender and genetic risk (independent clerical worker, sealed envelopes). Comment: precise randomisation method not described |
| Allocation concealment (selection bias) | Unclear risk | Quote: "The sequence of randomisation was concealed until treatment had been allocated." Comment: precise allocation concealment method not described |
| Blinding of participants and personnel (performance bias) All outcomes | High risk | Participants not blind. Rater intended to be blind, but was difficult in practice |
| Blinding of outcome assessment (detection bias) All outcomes | High risk | Rater intended to be blind, but participants divulged information |
| Incomplete outcome data (attrition bias) All outcomes | High risk | Out of 60 participants, 33 dropped out (attrition 55%) at 3‐year follow‐up. Attrition rate was 54% (N = 20) in the cognitive therapy + monitoring group and 57% (N = 13) in the monitoring group. 2 participants from cognitive therapy + monitoring group excluded from analysis due to developed psychosis at first assessment after randomisation when they reported having concealed psychotic symptoms during their initial assessment. No details published for reasons of discontinuation at this time point We did not use results at 3‐year follow‐up due to high attrition rate (55%) at that time point. At 12 months, attrition rate in the cognitive therapy + monitoring group was 30% (N = 11, 2 excluded from analysis due to developed psychosis at baseline, 4 lost to follow‐up of which 3 moved, 3 withdrew from therapy and 2 would not engage) and in the monitoring group 30% (N = 7, 4 lost to follow‐up of which 2 moved out of the area, 3 discontinued monitoring). |
| Selective reporting (reporting bias) | Low risk | All outcomes mentioned in study protocol and publications' methods reported in the manuscript. |
| Other bias | Low risk | We did not identify any other sources of bias. |
EDIP‐USA.
| Methods | Allocation: randomised (no details) Blinding: single (outcomes assessor) Setting: Maine, USA Inclusion criteria: prodromal psychotic symptoms, age 12‐35 years Exclusion criteria: psychotic episode, IQ < 70, outside catchment area, toxic psychosis Duration: 24 months History: participants identified via community education about attenuated psychotic symptoms, targeting school counsellors, paediatricians, and mental health professionals |
|
| Participants | Diagnosis: prodromal psychotic disorders N = 100 Age: range 12‐35 years, average 16 SD 3 Sex: male and female |
|
| Interventions | 1. FACT: combination of family psychoeducation, assertive community treatment, supported education/employment, psychotropic medication. N = 50 2. EST: psychotropic drugs, individual case management, family education and crisis intervention. N = 50 |
|
| Outcomes | Onset of psychosis: rating of 6 on > 1 SIPS P‐scale item Leaving the study early Functioning: GAF Adverse effects |
|
| Notes | Discrepancy observed between data published in a journal manuscript and data posted on ClinicalTrials.gov. After communicating with the authors and checking which data were correct, we included data posted on ClinicalTrials.gov. Funding: Part of PIER under foundation of NIH and Center for Mental Health Services sponsorship. Power analysis, sample size calculation: not reported Adherence: see Table 14 |
|
| Risk of bias | ||
| Bias | Authors' judgement | Support for judgement |
| Random sequence generation (selection bias) | Unclear risk | Stated randomised, but no details described |
| Allocation concealment (selection bias) | Unclear risk | Method of allocation concealment not described |
| Blinding of participants and personnel (performance bias) All outcomes | High risk | Single‐blinded study (only outcomes assessors) |
| Blinding of outcome assessment (detection bias) All outcomes | Low risk | Outcomes assessors blinded |
| Incomplete outcome data (attrition bias) All outcomes | Unclear risk | Out of 100 participants, 31 discontinued the study (attrition 31%). In the FACT group 15 participants dropped out (attrition rate 30%) and in the EST group 16 participants dropped out (32%). The reasons for study discontinuation were not reported |
| Selective reporting (reporting bias) | Unclear risk | All outcomes mentioned in registered protocol (NCT01597141) and publications' methods were reported for 24 months, but with discrepancies in published data (please see section Notes). Additionally, on clinicaltrials.gov it is stated that the primary outcome (onset of psychosis) will be assessed at up to 60 months, which was not reported. |
| Other bias | Low risk | We did not identify any other sources of bias. |
EIPS‐Germany.
| Methods | Allocation: randomised Blinding: not stated* Setting: Cologne, Bonn, Dusseldorf, Munich, Germany Inclusion criteria: ERIraos criteria, 18‐36 years Exclusion criteria: < 18 years and > 36 years, treatment with antipsychotics, history of psychotic episode, refusing enrolment in research studies, refusing psychopharmacological treatment, living out of area, moving out of area, delirium, dementia, amnesic or other cognitive disorder, mental retardation, psychiatric disorders due to somatic factor or related to psychotropic substances, alcohol or drug misuse in last 3 months, diseases of central nervous system (inflammatory, traumatic, epilepsy etc.)** Duration: 36 months (12 months' treatment + 24 months' follow‐up) |
|
| Participants | Diagnosis: risk for developing psychosis N = 128 Sex: men and women, ˜60:40% M:F Age: 18‐36 years, average ˜26, SD 6 years History: not reported |
|
| Interventions | 1. IPI: individual CBT, group skills training, cognitive remediation and multifamily psychoeducation, up to 30 sessions. N = 63*** 2. Supportive counselling: support, psychoeducation and counselling, up to 30 sessions. N = 65*** |
|
| Outcomes | Transition to psychosis: ERIraos, PANSS Leaving the study Functioning: GAF, SAS–II**** Mental state: PANSS (total, positive and negative score), MADRS |
|
| Notes | *Raters could have been aware of the treatment allocation. **Presence of inclusion criteria for the LIPS‐Germany was additional exit criteria from EIPS‐Germany study ***After randomisation, 2 in IPI group and 1 in supportive counselling group failed to attend any treatment sessions. ****15 participants not accounted for *****37 participants not accounted for Funding: German Federal Ministry of Education and Research Power analysis, sample size calculation: not reported Adherence: see Table 14 |
|
| Risk of bias | ||
| Bias | Authors' judgement | Support for judgement |
| Random sequence generation (selection bias) | Low risk | Randomised by computer‐generated, by block, results placed in sealed envelopes and only opened at the time of treatment allocation |
| Allocation concealment (selection bias) | Unclear risk | Quote: "Using sealed envelopes." Comment: allocation concealment method insufficiently described; it is unclear whether envelopes were sequentially numbered and opaque. |
| Blinding of participants and personnel (performance bias) All outcomes | High risk | Not reported in any of the manuscripts where this study was described. In the study protocol (NCT00204087) it was indicated: "Masking: None (open label)" |
| Blinding of outcome assessment (detection bias) All outcomes | High risk | Quote: "as well as in most trials involving psychosocial interventions it was extremely difficult to make assessments that are totally blind to the treatment condition. Although ratings were mainly carried out by people, who were not involved in treatment, raters could have been aware of the treatment allocation, which raises the possibility that rating bias could have influenced the results." Comment: high possibility that raters may not have been blinded. |
| Incomplete outcome data (attrition bias) All outcomes | Unclear risk | Out of 128 randomised participants, 47 dropped out of the trial before its completion (attrition 37%). In the IPI group, attrition rate was 37% (N = 23, 1 withdrawn from intervention because of suspicion of organic brain disease and 22 lost to follow‐up: 3 moved, 19 did not return). In the supportive counselling group, attrition rate was 37% (N = 24, 24 lost to follow‐up: 7 moved, 17 did not return). |
| Selective reporting (reporting bias) | Low risk | All outcomes mentioned in registered protocol (NCT00204087) and publications' methods reported in the manuscript |
| Other bias | Low risk | We did not identify any other sources of bias. |
Kantrowitz‐USA.
| Methods | Allocation: randomised Blinding: double‐blind (participants, study team) Setting: USA (multisite, clinical high‐risk treatment clinics and local physicians) Inclusion criteria: aged 13–35 years, total score of > 20 SOPS, interest in participation in study, no psychotropic medication changes within 4 weeks Exclusion criteria: history of supra‐threshold psychosis or clinical judgment that the SOPS symptoms were accounted for by another disorder (e.g. depression), unstable medical illness or renal impairment (glomerular filtration rate < 60), alcohol or substance misuse in past month or dependence within past 6 months, EPS (Simpson Angus Scale total ≥ 12, depression (CDS total > 10), or suicidal ideation Duration: 16 weeks |
|
| Participants | Diagnosis: UHR for developing psychosis N = 44 Sex: men and women, ˜60:40% M:F Age: range 13‐35 years, average ˜20 SD 4 History: included if met criteria for either attenuated positive symptoms (positive clinical high risk, defined by rating of 3–5 on ≥ 1 of 5 SOPS positive items or negative symptoms (negative clinical high risk, defined by rating ≥ 3 on 2 of 6 negative symptom items, even in the absence of positive symptoms |
|
| Interventions | 1. D‐serine: 60 mg/kg/day, average 4.2 g/day, oral, 2 doses a day: N = 20 2. Placebo: 60 mg/kg/day: N = 24 Some continued taking other medications prescribed previous to the study (e.g. antidepressants, anti‐anxiety medications); > 60% not receiving other psychotropic medications during study Participants removed if transition of diagnosis to psychosis, repeated non‐compliance, out of range renal values (e.g. increased urinary protein to creatinine ratio or abnormal urine analysis) |
|
| Outcomes | 1. Transition to psychosis 2. Leaving the study early 3. Suicidal thoughts Unable to use: Mental state: SOPS (high attrition rate) Neurocognitive symptoms: MATRICS (high attrition rate) Adverse effects: Simpson Angus Scale, AIMS, the Systematic Assessment for Treatment Emergent Events (high attrition rate) Sleep: PSQI (high attrition rate) Physiological: interleukin‐6 (IL‐6) levels, liver function tests, complete blood count, general chemistry (not listed in review protocol) |
|
| Notes | Funding: National Institutes of Mental Health Cooperative Drug Development, grant number U01 MH074356, to DCJ. Cytokine analyses were supported by the National Center for Advancing Translational Sciences, National Institutes of Health, grant number UL1 TR000040. Power, sample size calculation: "Power calculations for this study were based on a study with glycine in participants (24) at clinical high risk that showed an effect size of d = 1.15 for The Scale of Prodromal Symptoms (SOPS) change scores during glycine treatment versus a typical placebo response rate of d = 0.27. Although we originally specified a sample size of 72 participants to provide additional power, we regarded N = 44 as the minimum sample size necessary to detect significant p<0·05 treatment‐related change in the primary endpoint." Adherence: see Table 14 |
|
| Risk of bias | ||
| Bias | Authors' judgement | Support for judgement |
| Random sequence generation (selection bias) | Unclear risk | Quote: "Randomisation lists for each site, block‐randomised using blocks of 4. Participants were stratified by type (high or negative high clinical risk)." Comment: precise randomisation method not described |
| Allocation concealment (selection bias) | Low risk | Quote: "Only the central data management group and a study pharmacist at each site were aware of group assignments. Sealed unmasking envelopes were used.” Comment: precise allocation concealment method not described; it is unclear whether envelopes were sequentially numbered and opaque |
| Blinding of participants and personnel (performance bias) All outcomes | Low risk | Double‐blind (participants, study team) D‐serine and placebo treatment bottles were matched and identical looking. |
| Blinding of outcome assessment (detection bias) All outcomes | Unclear risk | Not described |
| Incomplete outcome data (attrition bias) All outcomes | High risk | Out of 44 participants, 23 discontinued the study before its completion (attrition 52%). Participants who completed the study did not differ from other participants in baseline characteristics and symptoms. Attrition rate in D‐serine group was 50% (N = 10, 5 did not complete at least one post‐baseline efficacy evaluation: 1 withdrew consent, 2 protocol error, 2 renal laboratory abnormality) and in the placebo group 54% (N = 13; 4 did not complete at least one post‐baseline efficacy evaluation, 9 discontinued intervention after first post‐baseline efficacy evaluation: 2 lost to follow‐up, 5 withdrew consent, 2 psychosis transition for < 16 weeks). |
| Selective reporting (reporting bias) | Low risk | All outcomes mentioned in the registered protocol (NCT00826202) and in the publications' methods reported. Due to high attrition rate at follow‐up assessments, we did not use results for mental scales and neurocognitive symptoms, nor adverse effects and PSQI in our analysis. |
| Other bias | Low risk | We did not identify any other sources of bias. |
LIPS‐Germany.
| Methods | Allocation: randomised (no details) Blinding: open‐label Setting: Cologne, Bonn, Dusseldorf and Munich, Germany Inclusion criteria: adapted version ERIraos, 18–36 years of age Exclusion criteria: any DSM‐IV diagnosis of schizophrenia, bipolar disorder, brief psychotic episode (with duration > 1 week), delirium, dementia (and other cognitive disorders), mental retardation, mental disorders due to a general medical condition or mental disturbances due to psychotropic substances, alcohol abuse or drugs in past 3 months. Duration: 12 weeks of intervention + up to 2 years of observation period |
|
| Participants | Diagnosis: late prodromal state (presence of attenuated positive symptoms and/or brief limited intermittent positive symptoms in 3 months preceding study) N = 124* Sex: men and women, ˜50:50% M:F History: no details |
|
| Interventions | 1. Amisulpride: average dose 118 mg/day, range 50–800 mg/day + NFI). N = 65. 2. NFI: psychoeducation, crisis intervention, family counselling and assistance with education or work‐related difficulties. N = 59 SSRIs prescribed in 7 in each group; benzodiazepines prescribed for 6 (5 in amisulpiride group), 1 in each group took chloral hydrate for sleep disturbances |
|
| Outcomes | Leaving the study early Mental state: PANSS, MADRS, ERIraos – 3 months post‐treatment Functioning: GAF – 3 months post‐treatment Adverse effects: ESRS (only akathisia subscore), UKU, prolactin levels – 3 months post‐treatment Unable to use: Adverse effects: ESRS (other subscores), cardiovascular adverse effects, BMI (reported only as range, or results of statistical tests, but without summary outcome data per group) Functioning: SAS‐II (no data) Mental state: PANSS, MADRS, ERIraos, 24 months (no data) Functioning: GAF, 24 months (no data) Adverse effects: ESRS (only akathisia subscore), UKU, prolactin levels, 24 months (no data). |
|
| Notes | *18 left before baseline assessments (4 in NFI + amisulpiride group and 14 in NFI); 3 in amisulpiride group excluded from analysis as treatment had started before baseline assessment; 1 participant in NFI group had severe, unstable endocrinological dysfunction (not detectable by routine laboratory measurement). Hence, 102 participants (58 in amisulpiride group and 44 NFI) included in analysis (“ITT” sample). Results presented for 12 weeks' intervention period Funding: German Federal Ministry for Education and Research BMBF (grant 01 GI 9935) and Sanofi Synthelabo, Germany Power, sample size calculation: not reported; quote: "A sample size of N = 130 cases is planned" Adherence: see Table 14 |
|
| Risk of bias | ||
| Bias | Authors' judgement | Support for judgement |
| Random sequence generation (selection bias) | Unclear risk | Not described. |
| Allocation concealment (selection bias) | Unclear risk | Not described |
| Blinding of participants and personnel (performance bias) All outcomes | High risk | Not blinded (open‐label) |
| Blinding of outcome assessment (detection bias) All outcomes | High risk | Rater not blinded |
| Incomplete outcome data (attrition bias) All outcomes | Unclear risk | Attrition 39% (amisulpiride + NFI group 29%, NFI 49%. Early dropouts (N = 18) did not differ from the remaining sample (N = 106) nor when comparisons were made separately for the 2 treatment groups in any of measured variables, however, reasons for discontinuation are unknown in most cases as these participants had not returned. |
| Selective reporting (reporting bias) | Unclear risk | Most outcome measures mentioned in the registered protocol (NCT00204061) and publications' methods reported for post‐treatment point, except SAS‐II. Results for observation period of 24 months were not reported. Data for ESRS subscores besides akathisia, cardiovascular effects and BMI were not usable for our analysis. |
| Other bias | Low risk | We did not identify any other sources of bias. |
Miklowitz‐USA.
| Methods | Allocation: randomised Blinding: single (assessors) Setting: Emory University, Harvard University, University of Calgary, University of California Los Angeles, University of California San Diego, University of North Carolina, Yale University and Zucker Hillside Hospital, USA Inclusion criteria: age 12‐35 years, speaking and writing English, meet SIPS/SOPS criteria Exclusion criteria: diagnosis of schizophrenia or schizoaffective disorder (DSM‐ IV‐TR), pervasive developmental disorders, current substance or alcohol dependence, neurological disorders Duration: 18 months (6 months of treatment, 12 months of follow‐up) |
|
| Participants | Diagnosis: high risk for developing psychosis N = 129 Sex: men and women, ˜60:40% M:F Age: 12‐35 years, average 17 SD 4 History: no details |
|
| Interventions | 1. FFT: 18 sessions of psychoeducation, communication enhancement training and problem‐solving skills training in 6 months, average 11 sessions SD 7: N = 66 2. Enhanced care: 3‐session family psychoeducational therapy, average 2.4 sessions SD 1.2: N = 63 Drug treatment not requirement of study. When participants were taking medications, their pharmacotherapy was managed by a study psychiatrist, unless they wished to consult a community provider. 27 (20.9%) were taking antipsychotic medications at randomisation |
|
| Outcomes | Transition to psychosis Leaving the study early Mental state: SOPS (positive), at 6 months post‐treatment Prescription of antipsychotics, by 6 months Unable to use: Mental state: SOPS (negative symptoms) (no usable data), SOPS – at 1 year (no data) Functioning: GAF, GFR, GFS (no usable data) Additional outcomes: Family interactions (e.g. perceived criticism): PCPW, CBQ‐ mother report, 10‐min problem‐solving family interaction task |
|
| Notes | Funding: National Institute of Mental Health (NIMH) grants 1RC1MH088546 (TDC, DJM), and R01MH093676 (DJM), and a grant from the Stanley Family Foundation (TDC). Power, sample size calculation: quote: "Power for the study’s repeated measure design, calculated prior to the study based on an expectation of 120 participants and 20% attrition, was 80% to detect a medium‐sized (0.50 SD) group difference in symptoms (alpha = 0.05, two‐tailed). Our study design had 95% power to detect a three‐way interaction between treatment, age group, and time with a medium effect size (f = 0.25) (p<0.05)." Adherence: see Table 14 |
|
| Risk of bias | ||
| Bias | Authors' judgement | Support for judgement |
| Random sequence generation (selection bias) | Unclear risk | Lead study investigator who was neither involved in the provision of treatments nor the follow‐up evaluations conducted the random assignments to groups, with 50% of participants allocated to each condition, allocations, performed using Efron’s biased coin toss were stratified by site and whether or not the participant was prescribed an antipsychotic medication at baseline, allocation results were sent by email to each site’s principal investigator. |
| Allocation concealment (selection bias) | Unclear risk | See above |
| Blinding of participants and personnel (performance bias) All outcomes | High risk | Participants not blinded |
| Blinding of outcome assessment (detection bias) All outcomes | High risk | Although this was an RCT with ‘blind’ evaluations of clinical outcome, the clinical supervisors knew whether they were rating FFT or enhanced care sessions |
| Incomplete outcome data (attrition bias) All outcomes | Low risk | Out of 129 randomised participants, 27 discontinued the study before 6‐month assessment (attrition 21%). In the FFT group attrition rate was 17% (N = 11) and in the enhanced care group 25% (N = 16). The reasons for dropping out of the study were classified as “withdrew or missed assessment“ in both groups. In the FFT group, 11 participants withdrew prior to first session and in the enhanced care group 10 withdrew prior to first session. |
| Selective reporting (reporting bias) | Unclear risk | All outcomes mentioned in registered protocol (NCT01907282) and publications' methods reported for post‐treatment point (6 months), but some of the data were only partially reported, unusable figures or reported per age groups, and not per randomised groups. Data for 1‐year follow‐up not reported |
| Other bias | Low risk | We did not identify any other sources of bias. |
NEURAPRO‐AAE.
| Methods | Allocation: randomised Blinding: double‐blind (participants, people administering treatment, assessors) Inclusion criteria: ability to give informed consent, age 13‐40 years, meet criteria for ‘at‐risk’ groups: Trait and State Risk Factor, APS, BLIPS Exclusion criteria: history of psychotic episode of ≥ 1 week, organic and inflammatory brain disease, abnormal coagulation profile parameters for thyroid function test results > 10% above/below limits of normal, any physical illness with psychotropic effect, unstable current treatment with lithium, methylphenidate or ketamine or recreational use of ketamine, past antipsychotic exposure (˜ total lifetime haloperidol dose of > 50 mg), serious developmental disorder, IQ < 70, developmental delay or intellectual disability, current aggression/dangerous behaviour, current suicidality/self‐harm, current pregnancy, current attenuated symptoms explained by acute intoxication (e.g. LSD), > 4 weeks of regular omega‐ 3 supplementation (> 2 capsules standard strength providing > 600 mg combined eicosapentaenoic acid/docosahexaenoic acid (DHA)) within the last 6 months Setting: multicentre, North America, Europe and Australia Duration: 24 months |
|
| Participants | Diagnosis: people at high risk for developing psychosis N = 304 Sex: men and women, 46:54% M:F Age: range 13‐40 years, average ˜19 SD 5 |
|
| Interventions | 1. Omega‐3 fatty acids: 2.8 g of marine fish oil ˜1.4 g eicosapentaenoic acid/DHA in 4 x 0.700 g capsules, oral, daily for 6 months + cognitive behavioural case management: 6‐20 sessions in first 6 months, depending on needs (weekly sessions recommended), then further sessions on an 'as needs' basis for up to 12 months (from entry), each session ˜30‐60 min duration: N = 153 2. Placebo: 4 x 0.700 g matched capsules, oral, daily for 6 months (contained paraffin/coconut oil, tocopherols to match the content in the active ingredient and a small proportion of the fish oil to ensure the placebo capsules have the same odour as the active capsules) + cognitive behavioural case management: N = 151 For the first 12 months of the study SSRIs permitted for moderate‐severe depression (MADRS ≥ 21 for > 2 consecutive weeks), benzodiazepines permitted for anxiety. Antipsychotics/mood stabilisers not permitted unless participant withdrawn before 12 months |
|
| Outcomes | Transition to psychosis: measured by CAARMS Leaving the study Mental state: SANS, BPRS, YMS, MADRS Functioning: SOFAS, GFS, GFR Adverse effects: UKU Unable to use: Mental state: SANS subscores, BPRS psychotic subscale (presented as "Month 12 Minus Baseline", no baseline data) |
|
| Notes | Funding: Grant 07TGF‐1102 from the Stanley Medical Research Institute, grant 566529 from the NHMRC Australia Program (Drs McGorry, Hickie, and Yung, and Amminger), and a grant from the Colonial Foundation. Adherence: see Table 14 |
|
| Risk of bias | ||
| Bias | Authors' judgement | Support for judgement |
| Random sequence generation (selection bias) | Low risk | Computer‐generated via an online electronic data management system, stratified by site and the moderate to severe major depression (MADRS) total score |
| Allocation concealment (selection bias) | Unclear risk | Not described |
| Blinding of participants and personnel (performance bias) All outcomes | Low risk | Quote: "All participants and clinicians involved in delivering interventions, assessing outcomes, and data entry were blind to group assignment. The trial statistician (HPY) was unblinded at the analysis stage. Appearance, size and 'taste' of the placebo capsules are matched with the fish oil capsules)" |
| Blinding of outcome assessment (detection bias) All outcomes | Low risk | Quote: "All participants and clinicians involved in delivering interventions, assessing outcomes, and data entry were blind to group assignment. The trial statistician (H.P.Y.) was unblinded at the analysis stage." |
| Incomplete outcome data (attrition bias) All outcomes | Low risk | Out of 304 randomised participants, 79 dropped out before end of the study (attrition 26%). Attrition rate in omega‐3 fatty acids group was 25% (N = 39: 24 withdrew, 14 unable to contact, 1 pregnant) and in placebo group was 26% (N = 40: 18 withdrew, 22 unable to contact). |
| Selective reporting (reporting bias) | Low risk | All outcomes mentioned in registered protocol (ACTRN12608000475347) and publications' methods were reported |
| Other bias | Low risk | We did not identify any other sources of bias. |
Nordentoft‐Denmark.
| Methods | Allocation: randomised Blinding: not blinded (independent assessors aware of treatment allocation) Setting: Copenhagen and Aarhus County, Denmark (inpatient and outpatient mental health services) Inclusion criteria: met criteria for schizotypal disorder (ICD‐10) Exclusion criteria: antipsychotic medication for >12 weeks, psychiatric symptoms due to organic condition Duration: 24 months |
|
| Participants | Diagnosis: schizotypal disorder (ICD‐10) N = 79 Sex: men and women, ˜70:30% M:F Age: average ˜25 SD 5 years History: no details |
|
| Interventions | 1. Integrated treatment: modified Assertive Community Treatment model with case load and home visits, group or individual social skills training, psycho‐education in multiple‐family groups: N = 42 2. Standard treatment: standard mental health service routines in Copenhagen and Aarhus: N = 37 There were no specific guidelines for providing antipsychotic medication to patients with schizotypal disorder, medication was prescribed by psychiatrist responsible for treatment |
|
| Outcomes | Transition to psychosis (ICD‐ 10) Leaving the study early Mental state: SAPS, SANS |
|
| Notes | Funding: Danish Ministry of Health (jr.nr. 96‐0770‐71), The Danish Ministry of Social Affairs, The University of Copenhagen, The Copenhagen Hospital Corporation, The Danish Medical Research Council (jr.nr. 9601612 and 9900734), and Slagtermester Wørzners Foundation. Power, sample size calculation: Quote: "Using Pocock’s formula (Pocock, 1996), we calculated that 39 patients were required for each study group to show a difference in transition rate of 10% compared with 40%. Thus, the study only has statistical power to detect large differences in transition rate". Adherence: see Table 14 |
|
| Risk of bias | ||
| Bias | Authors' judgement | Support for judgement |
| Random sequence generation (selection bias) | Low risk | Quote: "Randomisation will be centralised and computerised with concealed randomisation sequence carried out by the Copenhagen Trial Unit (CTU)." |
| Allocation concealment (selection bias) | Unclear risk | Quote: "Randomisation will be centralised and computerised with concealed randomisation sequence carried out by the Copenhagen Trial Unit (CTU)." Ratio of 1:1 in blocks of 6, and stratified for each centre. |
| Blinding of participants and personnel (performance bias) All outcomes | High risk | Quote: "The allocations concealment is ensured by the investigators call to the randomisation unit, CTU, after completing the collection of baseline data and data needed for the randomisation." Comment: precise method of allocation concealment was not described. |
| Blinding of outcome assessment (detection bias) All outcomes | High risk | Not blinded |
| Incomplete outcome data (attrition bias) All outcomes | Unclear risk | Assessors not blinded for treatment allocation |
| Selective reporting (reporting bias) | Unclear risk | Out of 79 randomised participants, 14 discontinued the study (attrition 18%). Attrition rates per group were 14% (N = 6) in integrated treatment group and 22% (N = 8) in standard treatment group. While treatment group, treatment site, gender, age, abuse of alcohol or drugs, psychotic, negative or disorganised symptoms at entry were not associated with study discontinuation, there was a significant association within participants who reported use of cannabis at least monthly at entry compared to those who reported no or less frequent use (37.5% versus 12.7%, P = 0.02). No details for study discontinuation reported. |
| Other bias | Low risk | All outcomes mentioned in publication methods reported. However, compared to registered protocol for the OPUS study, most of the outcomes relevant for this population of participants were reported except: suicidal behaviour, user satisfaction, adherence to treatment, compliance with medication. |
PACE‐Australia.
| Methods | Allocation: randomised Blinding: not blinded Setting: Melbourne, Australia Inclusion criteria: age 14‐30 years, living in Melbourne metropolitan area, meeting criteria for ≥ 1 of 3 operationally defined UHR groups (Yung 2005). Exclusion criteria: previous psychotic/manic episode, previous treatment with antipsychotic/mood stabilising agent, substance‐induced psychotic disorder, IQ < 70, inadequate English Duration: initially 12 months (6 months of treatment, 6 months of follow‐up); 4 years thereafter |
|
| Participants | Diagnosis: people at UHR for developing psychosis N = 59 Sex: men and women, ˜60:40% M:F Age: range 14‐28 years, average 20 SD 4 History: no details |
|
| Interventions | 1. SPI: NBI, low‐dose risperidone therapy (average 1.3 mg/daily), CBT. N = 31 2. NBI: supportive psychotherapy focusing on social relationships and vocational and family issues: N = 28 Both groups received case management and medication when needed (sertraline for depression, benzodiazepines for insomnia, usually temazepam) |
|
| Outcomes | Progression to psychosis Leaving the study early Mental state: BPRS, SANS, HRSD, HRSA, YMS Quality of life: QLS Functioning: GAF Economics: costs |
|
| Notes | Funding: Commonwealth Government of Australia Research and Development Grants Advisory Committee, and Janssen‐Cilag Pharmaceuticals; Australian Rotary Health Research Fund grant Power, sample size calculation: not reported Adherence: see Table 14 |
|
| Risk of bias | ||
| Bias | Authors' judgement | Support for judgement |
| Random sequence generation (selection bias) | Unclear risk | Quote: "Simple randomisation by trial coordinator." Comment: precise method of randomisation not described |
| Allocation concealment (selection bias) | Unclear risk | Not described |
| Blinding of participants and personnel (performance bias) All outcomes | High risk | Treating clinicians, research staff or participants and their families were not blind to the randomisation procedure |
| Blinding of outcome assessment (detection bias) All outcomes | High risk | Two intervention groups treated by different clinicians, which was difficult to conceal from raters |
| Incomplete outcome data (attrition bias) All outcomes | Low risk | No dropouts in SPI nor NBI group |
| Selective reporting (reporting bias) | Low risk | Study was not registered. All outcome measures mentioned in publication methods reported |
| Other bias | Low risk | We did not identify any other sources of bias. |
Piskulic‐Canada.
| Methods | Allocation: randomised Blinding: single (cognitive and symptom raters) Setting: Calgary, Australia Inclusion criteria: age 15‐35 years, SIPS prodromal criteria, written informed consent Exclusion criteria: IQ < 75, organic central nervous system disorder (e.g. epilepsy, traumatic brain injury), substance dependence Duration: 9 months (10‐12 weeks of treatment followed by 6 months of follow‐up) |
|
| Participants | Diagnosis: people at UHR for developing psychosis N = 32 Sex: men and women, 21:11 M:F Age: range 14‐35 years, average ˜19 SD 5 History: recruited as part of multisite North American Prodrome Longitudinal Study (NAPLS2) from the Calgary site. All received monetary reimbursement for Internet usage if training from home, or for travel following each training session. |
|
| Interventions | 1. Post Science Brain Fitness: cognitive remediation therapy involving auditory training exercises: 4 days/week, 1 h/day, 10–12 weeks. N = 18 2. Control treatment: commercial video games: 4–5 games/training day, same hours as participants in treatment group. N = 14 |
|
| Outcomes | Leaving the study Mental state: MCCB (apart from the Mayer–Salovey Emotional Intelligence Test (MSCEIT)), at 3 months Functioning: GFS, GFR, at 3 months. Unable to use: Mental state: MCCB, at 9 months (high attrition) Functioning: GFS, GFR, at 9 months (high attrition) |
|
| Notes | Funding: The Brain and Behaviour Research Fund Young Investigator Award 17369 to D. Piskulic and National Institute of mental Health (NIMH) grant U01MH08984 to J. Addington and the Alberta Centennial Mental Health Research Chairs Program Power, sample size calculation: not reported Adherence: see Table 14 |
|
| Risk of bias | ||
| Bias | Authors' judgement | Support for judgement |
| Random sequence generation (selection bias) | Unclear risk | Described as randomised. Method of randomisation not described |
| Allocation concealment (selection bias) | Unclear risk | Not described |
| Blinding of participants and personnel (performance bias) All outcomes | High risk | Single‐blinded (participants were not blind to group allocation, only cognitive and symptom raters) |
| Blinding of outcome assessment (detection bias) All outcomes | Low risk | All cognitive and symptom raters were blinded to group allocation |
| Incomplete outcome data (attrition bias) All outcomes | High risk | 21% of participants in the intervention group and 30% in the control group withdrew from the study after randomisation, prior to commencement. Of those randomised that started treatment, 38% participants from the intervention and 14% from the control group discontinued by after‐treatment assessment and 61% of the Post Science Brain Fitness group and 50% of the control treatment group discontinued the study by the 9‐month follow‐up. Reasons for attrition: Participants who discontinued from the study (N = 18) were significantly more educated (M = 11.44, SD = 2.7) than those who remained in the study (N = 14, M = 9.57, SD = 2.12) (T (30) = 2.11, P < 0.05). There were no other significant group differences on demographic,symptom, functioning or cognitive variables. Additionally, the main reasons for attrition rates across both groups were loss of interest in training (N = 10), lack of time (N = 4), problems with either Internet connection or personal computers at home (N = 3) for those who opted for home training and moving provinces (N = 1). For participants who were allocated to either treatment group but withdrew prior to study commencement, the main reasons were lack of interest (N = 5), lack of time (N = 5) and transition to psychosis (N = 1). The participant who converted to psychosis was initially consented and randomised into the Control treatment group but subsequently discontinued from the study prior to commencement of training as a result of the transition. |
| Selective reporting (reporting bias) | Low risk | All outcome measures mentioned in study protocol (NCT01619319) and publication's methods reported. Results for MCCB and functioning scales at 9 months' follow‐up not used in our analysis due to high attrition rate resulting in small number of participants. |
| Other bias | Low risk | We did not identify any other sources of bias. |
PRIME‐USA.
| Methods | Allocation: randomised Blinding: double‐blind (participants, investigators, dispensers) Setting: New Haven and North Carolina, USA; Calgary and Toronto, Canada (outpatient clinic) Inclusion criteria: treatment‐seeking outpatients, age 12‐45 years, met SIPS criteria, possessed a level of understanding sufficient to communicate with investigator and to understand nature of study, agreed to study and signed informed consent or assent (if a minor) Exclusion criteria: psychotic disorder, psychiatric disorder that could account for the prodromal symptoms, suicidal or homicidal behaviour, symptoms due to drug or alcohol use, IQ < 80, seizure disorder without clear aetiology, pregnancy and lactation (not pregnant or lactating women had to be using medically accepted means of contraception), taking non‐allowed antipsychotic, anticonvulsant, mood stabilising, and most anti‐anxiety medications. Patients on antidepressant medication included and allowed to continue taking the antidepressant medication, but efforts made to reduce dosage or stop. If antidepressant indicated for study‐active people not already on antidepressants, participant dropped from study and referred for disorder‐specific treatment Duration: 2 years (1‐year medication with 1‐year follow‐up without medication) |
|
| Participants | Diagnosis: UHR for psychosis N = 60 Sex: men and women, 65:35% M:F Age: range 12‐45 years, average 18 SD 5 History: no details |
|
| Interventions | 1. Olanzapine: 5‐15 mg/day, average 8 mg/day, 1‐3 tablets, clinician's judgement. N = 31 2. Placebo: N = 29 Individual and family psychosocial interventions available for both interventions. Lorazepam (max 8 mg/day) diazepam (max 40 mg/day) and chloral hydrate (max 100 mg/day) used for agitation and/or insomnia. Benztropine mesylate or biperiden up to 6 mg/day allowed to treat EPS. Nizatidine 300‐600 mg/day for weight gain, beginning towards the end of the study. |
|
| Outcomes | Transition to psychosis Leaving the study early Mental state: SOPS, PANSS, MADRS, YMS, 12 months Global state: CGI Functioning: GAF, 12 months Adverse effects: Simpson Angus Scale, AIMS, Barnes Akathisia Scale, weight gain, cardiovascular adverse effects, 12 months Unable to use: Neurocognitive measures: (no usable data)* Mental state, global state, functioning and adverse effects outcomes at 12 months' follow‐up (> 50% attrition rate) Quality of life: QLS (no data reported) |
|
| Notes | *Text reported results of statistical tests, not data per group; results figures impossible to extract. Study authors did not respond to repeated requests for data. We used results for 12 months (after treatment point) for all outcomes, because study authors stated that they did not perform analysis for follow‐up data due to lack of participants. Funding: investigator‐initiated grant from Eli Lilly and Company. Other support came from NIMH grants K05 MH‐01654 (Dr. McGlashan), R02 MH‐50557 and R01 MH‐67073 (Dr. Hoffman), R24 MH54446 (Dr. Woods), and 1K23 MH‐01905 (Dr. Perkins) and the Tapscott Chair in Schizophrenia Trials at the University of Toronto (Dr. Zipursky). Power, sample size calculation: under‐powered study. Power analysis suggested 180 participants (80% power) or 80 participants (50% power), but due to difficulties with recruitment, it was stopped after 3.5 years at 60 participants, which corresponded to 39% power for testing treatment effects on transition to psychosis and on prodromal symptom severity). Adherence: see Table 14 |
|
| Risk of bias | ||
| Bias | Authors' judgement | Support for judgement |
| Random sequence generation (selection bias) | Unclear risk | Study described as randomised, but randomisation method not described |
| Allocation concealment (selection bias) | Unclear risk | Quote: "Pills dispensed in prepackaged packs, pre‐labelled by site number and sequential subject number within site." Comment: precise allocation concealment method not described |
| Blinding of participants and personnel (performance bias) All outcomes | Low risk | Participants, investigators and dispensers to group assignment blinded; pills dispensed in pre‐packaged packs, pre‐labelled by site number and sequential subject number within site |
| Blinding of outcome assessment (detection bias) All outcomes | Low risk | Participants, investigators and dispensers to group assignment blinded |
| Incomplete outcome data (attrition bias) All outcomes | High risk | Out of 60 participants, 27 dropped out before the end of treatment phase (attrition 45%). However, attrition was higher than 50% when calculated for each group separately. Attrition rate in olanzapine group was 55% (N = 17) and in placebo group 53% (N = 10); although dropout rate for reasons other than transition to psychosis was higher for the olanzapine group, there was no statistically significant difference between groups, including discontinuation of the study due to adverse events. During the follow‐up period, there were no discontinuations due to any reasons other than transition to psychosis in either treatment group. Because of the low number of participants due to dropout and transition to psychosis (9 participants in olanzapine and 8 in placebo group), no statistical analysis was performed to assess treatment differences in this study period. |
| Selective reporting (reporting bias) | Unclear risk | Most of the outcome measures mentioned in publications' methods reported, except QOL. Statistical analysis was not performed for follow‐up period for mental state, global state, functioning and adverse effects outcomes due to lack of participants. |
| Other bias | Low risk | We did not identify any other sources of bias. |
Vinogradov‐USA.
| Methods | Allocation: randomised Blinding: double‐blind (participant, care provider, assessor) Setting: San Francisco, USA Inclusion criteria: good physical health, age 12‐30 years, fluent English, IQ ≥ 70, no neurological disorder, no past (year) or current substance dependence, SIPS criteria Duration: 24 months (8 weeks of treatment + follow‐up) |
|
| Participants | Diagnosis: people at high risk for developing psychosis N: 83 Sex: men and women, 50:50% M:F Age: range 12‐30 years, average ˜18 SD 4 History: recruited via community clinicians, schools, family members, and self‐referred from seeing information on internet |
|
| Interventions | 1. AT: computerised exercises designed to improve speed and accuracy of auditory information processing while engaging auditory and verbal working memory: in each session 4 of 6 exercises (15 min/exercise)/day, 5 days/week, 8 weeks, coaching (goal‐setting, discussion of scheduling, setting an alarm and using reminders) provided if difficulty in completing hours. N = 50 2. Control Group: series of 16 different commercially available games. N = 33 At a “check‐in” in‐person appointment after every 10 sessions completed, coaching provided and participants paid USD 5/completed h, USD 20/10 sessions, and USD 30 after 40 h, USD 20/assessment appointment. Participants received treatment by outside providers or clinic personnel not involved in the study (psychoeducation, psychotherapy, medications as clinically indicated) |
|
| Outcomes | Mental state: SOPS Leaving the study Functioning: GFR, GFS Unable to use: Neurocognitive tasks: abbreviated version MATRICS (z scores only) |
|
| Notes | Funding: The National Institutes of Health (grant number MH081051). Power, sample size calculation: Not reported Adherence: see Table 14 |
|
| Risk of bias | ||
| Bias | Authors' judgement | Support for judgement |
| Random sequence generation (selection bias) | Unclear risk | Quote: "CHR subjects were stratified by age, IQ, symptom severity and gender and randomly assigned to auditory training or to the CG control condition." Comment: precise randomisation method not described |
| Allocation concealment (selection bias) | Unclear risk | Not described |
| Blinding of participants and personnel (performance bias) All outcomes | Low risk | Double‐blind (participant, care provider, outcomes assessor) |
| Blinding of outcome assessment (detection bias) All outcomes | Low risk | Double‐blind (participant, care provider, outcomes assessor) |
| Incomplete outcome data (attrition bias) All outcomes | Unclear risk | Out of 83 randomised participants, 35 dropped out before the training was completed (attrition 42%). In AT group, attrition rate was 38% (N = 19). In control group, attrition rate was 48% (N = 16). Reasons for dropping out of the study were not reported. However, there were no significant differences in demographic variables, cognition, symptom severity, or functioning between those who completed the study and those who dropped out. |
| Selective reporting (reporting bias) | Low risk | All outcome measures mentioned in registered protocol (NCT00655239) and publications methods reported. |
| Other bias | Low risk | We did not identify any other sources of bias. |
Woods‐1‐USA.
| Methods | Allocation: randomised Blinding: double‐blind Setting: New Haven, USA Inclusion criteria: met COPS criteria, ≥ 20 on SOPS Exclusion criteria: DSM‐IV any lifetime psychotic disorder or psychiatric disorder, inclusion symptoms due to drug/alcohol use, alcohol or drug abuse or dependence in past 3 months, antipsychotic medication in the past 3 months, dose change of antidepressant, anxiolytic, psychostimulant or mood stabiliser medication in past 8 weeks Duration: 24 weeks (12 weeks of RCT and 12 weeks open‐label administration)* |
|
| Participants | Diagnosis: people at high risk for developing psychosis N = 8 Sex: men and women, 75:25% M:F Age: average ˜16 SD 1 History: not reported |
|
| Interventions | 1. Glycine: 0.2 g/kg during the first 7 days, then 0.4 g/kg until end. N = 4 2. Placebo (sucrose). N = 4 |
|
| Outcomes | Transition to psychosis: SOPS Leaving the study early Mental state: SOPS, MADRS Cognitive functioning: Trails A, Stroop color word, AVLT, semantic (category) fluency, FAS, test of phonemic fluency, letter‐number sequencing, Trails B. Adverse effects: treatment‐emergent adverse effects, weight, cardiovascular (blood pressure, pulse) Unable to use: Cognitive functioning: WCS, CPT (identical pairs version), N‐back (available for 1 participant only) |
|
| Notes | *Results for 8 weeks Funding: NARSAD Distinguished Investigator Award, a research grant from Glytech Inc., the Donaghue Foundation Early Schizophrenia Initiative and National Institutes of Health Grant U01MH74356. Power, sample size calculation: not reported Adherence: see Table 14 |
|
| Risk of bias | ||
| Bias | Authors' judgement | Support for judgement |
| Random sequence generation (selection bias) | Unclear risk | Not described |
| Allocation concealment (selection bias) | Unclear risk | Not described |
| Blinding of participants and personnel (performance bias) All outcomes | Low risk | Study was double‐blind, placebo taste‐matched |
| Blinding of outcome assessment (detection bias) All outcomes | Unclear risk | Not described |
| Incomplete outcome data (attrition bias) All outcomes | Low risk | 2 participants out of 8 did not complete the study (attrition 25%). In the glycine group, 1 participant was withdrawn at week 5 due to non‐adherence (attrition rate 25%), and in the placebo group, 1 participant was withdrawn at week 3 due to transition to psychosis |
| Selective reporting (reporting bias) | Unclear risk | All the outcome measures mentioned in the registered protocol (NCT00291226) and publication methods reported. Data for some of the cognitive tasks were not used in our analyses as they were available for 1 participant only. |
| Other bias | Low risk | We did not identify any other sources of bias. |
Yung‐Australia.
| Methods | Allocation: randomised Blinding: double‐blind (participants, staff administering the treatment(s), assessing the outcomes and analysing the results/data) Setting: Personal Assessment and Crisis Evaluation (PACE) Clinic, Melbourne, Australia (a clinical service for young people at UHR of developing a psychotic disorder) Inclusion criteria: met CAARMS criteria, not previously psychotic, IQ > 70, adequate English skills, living in Melbourne metro area Exclusion criteria: history of previous psychotic/manic episode, history of medical condition that may account for symptoms leading to initial referral, clinically relevant neurologic, biochemical, or haematologic abnormalities, serious coexisting illnesses, lifetime antipsychotic dose of ≥ 15 mg of haloperidol (or equivalent), previous or current use of mood stabilising medication, history of severe drug allergy, IQ < 70, women who were pregnant or lactating Duration: 24 months (12 months' treatment, 12 months' follow‐up) |
|
| Participants | Diagnosis: people at UHR for developing psychosis N = 115 Sex: men and women Age: range 14‐30 years, average 18 History: no details |
|
| Interventions | 1. Risperidone + CBT: dose 0.5‐2.0 mg/day. N = 43 2. Placebo and CBT. N = 44 3. Placebo and supportive therapy. N = 28 |
|
| Outcomes | Transition to psychotic disorder: CAARMS Leaving the study early Mental state: BPRS, SANS Functioning: GAF Quality of life: QLS Adverse effects: UKU (number reporting adverse effects and number assessed to have adverse effects) Unable to use: Mental state: HRSD (high loss to follow‐up) Additional outcomes: Substance misuse: SUQ |
|
| Notes | Funding: major investigator‐initiated grant from Janssen‐Cilag Pharmaceuticals (RIS‐AUS‐9). Alison Yung, Lisa Phillips and Patrick McGorry have received investigator‐initiated funding from Janssen Pharmaceuticals. Patrick McGorry has received investigator‐initiated funding from Astra‐Zeneca. Power, sample size calculation: underpowered study (for a significance level of 0.05 and a power of 0.7, a sample of 75 was required in risperidone and cognitive therapy and in placebo and cognitive therapy groups, and 50 in group with placebo and supportive therapy (3:3:2 randomisation ratio)). Adherence: see Table 14 |
|
| Risk of bias | ||
| Bias | Authors' judgement | Support for judgement |
| Random sequence generation (selection bias) | High risk | Quote: "The randomisation sequence was created by an independent statistician, who created sealed envelopes containing the medication number and the group assignation code." Web‐based automated randomisation system, stratified by site, in random permuted blocks of 10, allocation list kept in a remote secure location, independent person randomly allocated participants Comment: good description |
| Allocation concealment (selection bias) | Unclear risk | Quote: "Sealed envelopes." Comment: precise allocation concealment method not described; it is unclear whether envelopes were sequentially numbered and opaque. Quote from the manuscript: "Medication packaged by automated process, codes stored in locked cabinet and not revealed until trial completed." Comment: it is unclear from this description who prepared packaging and held allocation list. |
| Blinding of participants and personnel (performance bias) All outcomes | Low risk | Double‐blind (participants, staff administering the treatment(s), assessing the outcomes and analysing the results/data) Psychiatrists were blind to the treatment allocation, but therapists knew which psychological treatment to provide. Therapists, therefore, also knew that, when participants allocated to supportive therapy, they were also receiving placebo. However, psychologists were blind to medication allocation for those participants receiving cognitive therapy. |
| Blinding of outcome assessment (detection bias) All outcomes | Low risk | Staff assessing outcomes blinded |
| Incomplete outcome data (attrition bias) All outcomes | Unclear risk | Of 115 randomised participants, 75 completed 12 months' assessment (attrition 35%). In risperidone and cognitive therapy group, attrition was 37% (N = 16, 3 became psychotic, 1 withdrew consent, 5 refused medication, 1 moved interstate, 6 dropped out without specifying a reason). In placebo and cognitive therapy group, attrition was 34% (N = 15, 4 became psychotic, 2 withdrew consent, 2 refused medication, 2 withdrew due to work or study commitments, 5 dropped out without specifying a reason). In placebo and supportive therapy group, attrition was 32% (N = 9, 3 became psychotic, 1 withdrew consent, 5 dropped out without specifying a reason). |
| Selective reporting (reporting bias) | Low risk | All outcome measures mentioned in registered protocol (ACTRN12605000247673) and publications were reported. Results for HRSD were not used in our analysis due to lack of baseline and follow‐up data for participants (see section Outcomes in the above table for detailed description) |
| Other bias | Low risk | We did not identify any other sources of bias. |
AIMS: Abnormal Involuntary Movement Scale; APS: Attenuated Psychotic Symptoms; AT: auditory training; AVLT: Auditory Verbal Learning Task; BDI‐II: Beck Depression Inventory‐II; BDI‐PC: Beck Depression Inventory; BAS: Behavioral Activation System; BLIPS: Brief Limited Intermittent Psychotic Symptoms; BMI: body‐mass index; BPRS: Brief Psychiatric Rating Scale; BSI: Brief Symptom Inventory; CAARMS: Comprehensive Assessment of At Risk Mental States; CBQ: Conflict Behavior Questionnaire; CBT: cognitive behavioral therapy;CDS: Calgary Depression Scale; CDSS: Calgary Depression Scale for Schizophrenia; CGI: Clinical Global Impression‐Severity of Illness Scale; CIDI: Composite International Diagnostic Interview; CMRS: Cardio‐metabolic risk factors; COPS: Criteria of Prodromal States; CPT: Continuous Performance Task; CPT‐IP: Continuous Performance Test: Identical Pairs; DSM‐IV: Diagnostic and Statistical Manual of Mental Disorders, Fourth Edition; DSM‐IV‐TR: Diagnostic and Statistical Manual of Mental Disorders, Fourth Edition, Text Revision; DSM‐V: Diagnostic and Statistical Manual of Mental Disorders, Fifth Edition; EEG: electroencelephalogram; EPS: extrapyramidal symptoms; ERIraos: Early Recognition Inventory; EST: Enhanced standard treatment; EQ‐5D: European Quality of Life; ESRS: Extrapyramidal Symptom Rating Scale; FACT: Family‐aided Assertive Community Treatment; FAS: Controlled Oral Word Association FFT: family‐focused treatment; GAF: Global Assessment of Functioning; GFR: Global Functioning‐Role; GFS: Global Functioning‐Social; GHQ2: General Health Questionnaire; HRSA: Hamilton Rating Scale for Anxiety; HRSD: Hamilton Rating scale for Depression; ICD‐10: International Classification of Diseases 10th revision; IPI: Integrated psychological intervention; IQ: intelligence quotient; ITT: intention‐to‐treat; MADRS: Montgomery–Asberg Depression Rating Scale; MANSA: Montgomery– Asberg Depression Rating Scale; MATRICS: Measurement and Treatment Research to Improve Cognition in Schizophrenia; MCCB: Measurement and Treatment Research to Improve Cognition in Schizophrenia consensus cognitive battery; MCT: Minnesota Clerical Test; MSCEIT: Mayer–Salovey Emotional Intelligence Test; NBI: needs‐based intervention; NFI: needs‐focused intervention; NDRL: Non Directive Reflective Listening; OLIFE: Oxford‐Liverpool Inventory of Feelings and Experiences; OpenCDMS: data collection system; OTI: Opiate Treatment Index; PANSS: Positive and Negative Syndrome Scale; PBEQ: Personal Beliefs about Experiences Questionnaire; PBIQ‐R: Personal Beliefs on Illness Questionnaire‐Revised; PCPW: Perceived Criticism and Perceived Warmth Scales; PIER: Portland Identification and Early Referral; POPS: Presence of Psychotic Symptoms; PSQI: Pittsburgh Sleep Quality Index; PST: Processing speed training; QALYs: Quality‐adjusted life years; QLS: Quality of Life Scale; QOL: quality of life; SANS: Scale for Assessment of Negative Symptoms; SAPS: Scale for Assessment of Positive Symptoms; SAS‐A: Social Anxiety Scale for Adolescents; SAS‐II: Social Adjustment Scale–II; SAS‐SR: Social Adjustment Scale‐Self Report; SD: standard deviation; SFS: Social Functioning Scale; SIAS: Social Interaction and Anxiety Scale; SIPS: Structured Interview for Prodromal Symptoms; SOFAS: Social and Occupational Functioning Assessment Scale; SOPS: Scale of Prodromal Symptoms; SPAI2: Social Phobia and Anxiety Inventory; SPI: Specific preventive intervention; SPS: Social Phobia Scale; SSRI: Selective serotonin reuptake inhibitors; SUQ: Substance Use Questionnaire; TAU: Treatment as usual; UKU: Udvalg for Kliniske Undersøgelser Adverse Effects Scale UHR: ultra high risk; WAI‐SF: Working Alliance Inventory‐Short Form; WAIS‐III: Wechsler Adult Intelligence Scale‐Third Edition; WCS: Wisconsin Card Sort Test; WMI: Working Memory Index; YMS: Young Mania Rating Scale
Characteristics of excluded studies [ordered by study ID]
| Study | Reason for exclusion |
|---|---|
| Berger‐Australia | Allocation: not randomised, open‐label study |
| Berry‐USA | Allocation: randomised Participants: participants with recent onset of non‐affective psychosis and cannabis dependence or abuse |
| Biagianti‐USA | Allocation: randomised Participants: participants in the early course of schizophrenia‐spectrum illness |
| Capra‐Australia | Allocation: randomised Pariticpants: not‐help seeking young participants with psychosis‐like experiences |
| CHANGSHA‐USA | Allocation: randomised Participants: adult Chines participants who met study's criteria for schizotaxia |
| Chien‐Hong Kong | Allocation: randomised Participants: family caregivers of people with recent‐onset psychosis |
| Cordes‐Germany | Allocation: randomised Participants: participants with schizophrenia |
| EDIPP‐USA | Allocation: not randomised, cutoff, regression discontinuity design |
| EPIP‐Singapoure | Allocation: not randomised, prospective assessment |
| Heresco‐Levy‐Israel | Allocation: randomised Participants: UHR ( (COPS) derived using the SIPS/SOPS scales) Intervention: sarcosine versus placebo Outcomes: no data; this study has been withdrawn prior to enrolment due to lack of participants (0 participants enrolled as stated on Clinicaltrials.gov for NCT00276263) |
| Holzer‐Switzerland | Allocation: randomised Participants: adolescent participants with psychosis or at high risk for psychosis. Results for UHR participants not separated from the whole sample |
| Keri‐Hungary | Allocation: not randomised, prospective study |
| Koren‐Israel | Allocation: randomised Participants: adults from the community Intervention: 1 of 2 vignettes depicting an at‐risk adolescent Outcomes: degree to which that adolescent is likely to seek help for and to feel stigmatised and hopeless because of his/her symptoms |
| LEGS‐USA | Allocation: randomised Participants: primary care practitioners |
| LEO CAT‐UK | Allocation: randomised Participants: participants with first episode of psychosis |
| LEO‐UK | Allocation: randomised Participants: participants with non‐affective psychosis presenting to mental health services for the first time. |
| Leweke‐Germany | Allocation: randomised Participants: participants with early schizophrenia |
| Lewis‐USA | Allocation: not randomised (participants assigned to intervention or control using method of minimisation to equate group membership on risk factors). Participants: people with schizophrenia or schizoaffective disorder |
| NEURAPRO‐Q‐Australia | Allocation: randomised Participants: UHR participants Intervention: quetiapine and placebo Outcomes: no data, study was terminated in July 2011 due to feasibility reasons, recruitment of participants never commenced (as stated on ANZCTR.org for ACTRN12610000244000) |
| O'Neill‐UK | Allocation: randomised Participants: participants with ARMS for psychosis Interventions: cannabidiol and placebo Outcomes: neuroimaging study (block design fMRI while performing a verbal paired associate learning task) with different types of outcomes, not included in our protocol (activation of different brain areas). |
| OPUS‐Denmark | Allocation: randomised Participants: participants with first‐episode of psychosis |
| Piskulic‐2‐Canada | Allocation: randomised Participants: participants at risk for serious mental disorders (inclusion criteria: subthreshold mood and psychotic symptoms) Intervention: cognitive remediation and motivational interviewing Outcomes: no data, terminated due to recruitment difficulties (actual enrollment of 12 participants according to Clinicaltrials.gov for NCT02582528) |
| RAISE‐ETP‐USA | Allocation: randomised Participants: participants with first episode of psychosis |
| Ramsay‐USA | Allocation: randomised Participants: participants with early schizophrenia |
| RAP‐USA | Allocation: randomised Participants: prodromal schizophrenia Intervention: sertraline and risperidone Outcomes: no data, "Terminated by the principal investigator, as a sufficient number of subjects could not be enrolled." (actual enrollment of 8 participants as stated on Clinicaltrials.gov for NCT00169988) |
| Schmechtig‐USA | Allocation: randomised Participants: participants with high and average schizotypy Intervention: 4 drug groups (nicotine, risperidone, amisulpiride, placebo) Outcomes: performance of prosaccade (PS), antisaccade (AS) and smooth pursuit eye movement (SPEM) tasks |
| Uher‐Canada | Allocation: randomised Participants: high‐risk offspring of parents with schizophrenia, bipolar disorder and severe recurrent depression from age of 3‐21 years |
| Vadhan‐USA | Allocation: not randomised Participants: marijuana users at clinical high risk for schizophrenia (CHR) and healthy marijuana‐using controls Intervention: marijuana |
| Woods‐2‐USA | Allocation: not randomised, open‐label study |
ARMS: At‐Risk Mental State; COPS: Criteria of Prodromal Syndromes; fMRI: functional magnetic resonance imaging; SIPS: Structured Interview for Prodromal Symptoms; SOPS: Scale of Prodromal Symptoms; UHR: ultra high risk;
Characteristics of studies awaiting assessment [ordered by study ID]
Armando‐Italy.
| Methods | Allocation: randomised Blindness: double‐blind Inclusion criteria: written informed consent (for > 18 written informed consent of parents), age 12‐26 years, UHR as classified by the CAARMS (Yung 2005), genetic diagnosis of 22q11DS. Exclusion criteria: acute suicidal behaviour (6 on CAARMS item 7.3) or aggressive behaviour (6 on CAARMS item 5.4), drug abuse that contributed decisively to presentation of index episode, dependency on morphine, cocaine, amphetamine (not THC), alcohol abuse if considered major problem, epilepsy, IQ < 70, pregnancy and lactation Duration: 12 weeks |
| Participants | Diagnosis: people with 22q11DS and UHR criteria for psychosis N = 80 planned Age: range 12‐26 years Sex: men and women |
| Interventions | 1. Omega‐3 PUFAs + standard care (omega‐3 PUFA + non‐neuroleptic, standard therapy in those with 22q11DS and UHR criteria for psychosis) 2. Placebo + standard care (placebo + non‐neuroleptic, standard therapy in those with 22q11DS and UHR criteria for psychosis) |
| Outcomes | 1. Transition to psychosis rate measured by the CAARMS
2. Mental status: PANSS, MADRS, WAIS‐R, WMS‐R, WCST, Trail Making Test‐Part A and B, CPT, Finger Tapping Test: (right and left) 3. Functioning: GAF 4. Adverse effects: UKU |
| Notes | We contacted study authors regarding the status of this study via email, but they did not respond. Protocol registration: ClinicalTrials.gov ID NCT02070211 |
Goie‐Norway.
| Methods | Allocation: randomised Blindness: single‐blind (outcomes assessor) Inclusion criteria: DSMIV schizophrenia, schizophreniform disorder and schizoaffective disorder or high risk for psychosis or being treated for psychotic disorder > 5 years, reporting executive problems through structured interview or selfreport, i.e. BRIEF scale Tscore < 55 Exclusion criteria: ongoing alcohol or substance abuse, premorbid neurological disease or insult and/or comorbid neurological disease, severe cognitive problems interfering with the capacity to participate, IQ > 70 Duration: not provided |
| Participants | Diagnosis: people with schizophrenia spectrum disorders or high‐risk individuals with executive deficits N = 100 Age: 16‐67 years Sex: men and women |
| Interventions | 1. Goal Management Training 2. Cognitive Rehabilitation Therapy |
| Outcomes | Mental state: Hopkins Symptom Checklist 10, PANSS. Functioning: GAF, everyday functioning from NORMENT, SFS Cognition: BRIEF, CPT‐III, Hotel Task, DKEFS, digit span and letter‐number sequencing, Iowa gambling task, dysexecutive questionnaire (self + informant), Cognitive Failures Questionnaire, Goal Attainment Scaling Self‐esteem: General Perceived Self‐Efficacy Scale, Rosenberg self‐esteem scale. Quality of life: Perceived Quality of Life Scale |
| Notes | Protocol registration: ClinicalTrials.gov ID NCT03048695 |
Langer‐Chile.
| Methods | Allocation: randomised Blindness: double‐blind Setting: Chile Inclusion criteria: FES or at high risk of psychosis, age 15‐35 years, clinical stability defined by medical and psychometric criteria (e.g. PANSS) Exclusion criteria: risk of suicide, severe intellectual disability (mental retardation), medical illness inconsistent with the intervention, substance abuse or dependence in past 6 months Duration: 8 weeks + 3 months' follow‐up |
| Participants | Diagnosis: FES and high‐risk of psychosis N = 48 FES, 48 high risk mental state Age: 15‐35 years Sex: men and women |
| Interventions | 1. MBI + TAU. N = 48 (24 FES) 2. TAU: standard care, pharmacology and psychosocial intervention under clinical guidelines |
| Outcomes | Mental state: MATRICS Psychological well‐being: Psychological well‐being scale, Rosenberg Self‐esteem scale, Five Facet Mindfulness Questionnaire, PANAS, PSWQ‐11, DASS‐21 |
| Notes | Protocol registration: ISRCTN24327446 |
Nemoto‐Japan.
| Methods | Allocation: randomised Setting: Japan Duration: 24 weeks of treatment + 1 year follow‐up |
| Participants | Diagnosis: schizophrenia (within 5 years of onset), chronic schizophrenia, or ARMS for psychosis N = 94 Sex: 50 men, 44 women |
| Interventions | 1. Cognitive training programme for divergent thinking (DT) 2. Cognitive training programme for convergent thinking (CT) Both training programmes administered as homework for 24 weeks |
| Outcomes | Clinical assessments and neurocognitive tests (not specified) |
| Notes | Based on the abstract, participants could potentially be eligible for this review, but the abstract did not provide sufficient information about participants or any data for analysis. Study authors did not respond to e‐mail request for clarifications. |
OMEGA3‐NAPLS‐USA.
| Methods | Allocation: randomised Blindness: double‐blind Setting: North America Inclusion criteria: SIPS criteria Exclusion criteria: antipsychotic medication or history of diabetes Duration: 24 weeks |
| Participants | Diagnosis: CHR people from NAPLS consortium N = 127 CHR participants (118 completed baseline assessment, 70 completed study) Race: 82.5% Latino, 66.7% white Age: range 12–30 years, average 18.5 SD 5 Sex: men and women, ˜60:40 M:F |
| Interventions | 1. Omega‐3: dose 740 mg/day, etyl‐eicosapentaeonic acid/400 mg/day DHA 2. Placebo Baseline diet characterisation assessed using a systematic checklist that includes Omega‐3 fatty acid foods |
| Outcomes | Transition to psychosis Leaving the study early Mental state: change in symptoms and functioning Physiological: fasting erythrocyte fatty acid composition Adverse effects |
| Notes | Published data not usable for analysis Protocol registration: ClinicalTrials.gov ID NCT01429454 |
POP‐Norway.
| Methods | Allocation: randomised Blindness: single (study personnel) Setting: Norway Inclusion criteria: listed in national register, residing in the catchment areas (Stavanger and Fonna), 13‐65 years, meet SIPS criteria, does not meet current or life‐time criteria for any psychotic disorder, symptoms not better accounted for by Axis I/II or substance use disorder (exception, schizotypal personality disorder), not used antipsychotic medication for > 4 weeks, no neurological/endocrine disorders that may cause presenting psychotic symptoms, IQ > 70, understand and speak Norwegian, understand and sign an informed consent or assent for minors document Duration: 2 years |
| Participants | Diagnosis: UHR state N = 240 (target) Sex: men and women History: recruited through information campaigns and assessed by low‐threshold detection teams |
| Interventions | 1. Prodromal treatment package: 1‐1 monitoring of clinical status (symptom levels (prodromal and psychotic), risk profiles (suicidality, dangerousness), instrumental and social functioning), 1‐1 case management (to help deal with clinical, familial, social and vocational crises, needs and deficits), omega‐3 fatty acids (2 g of fish oils containing approx. 1.5 g eicosapentaenoic acid/DHA + 80 mg Vitamin E/day for 12 weeks), individual CBT, to deal with social/cognitive distortions and deficits and to maintain real world investment, 26 sessions of CBT within a 6‐month period), individuals that experience functional loss will in addition receive single‐family psycho‐education (to inform participants and families about current problems, how to understand and cope with them, especially within the family). Anti‐anxiety agents and anti‐depressants will be available if the participant is so symptomatic that they otherwise would be prescribed these agents by their general doctors. Antipsychotic medication will be available if the participant either enters the study with any SIPS positive symptom score at the level of 5, or if any positive prodromal symptom score(s) moves from a level of 3 or 4 to a 5, open‐label use based on the participant's symptom profile |
| Outcomes | Mental state: transition to psychosis (SCID, PANSS), time to transition Neuroimaging and cognition: fMRI + working memory task, resting state task, dichotic listening task |
| Notes | We contacted study authors via email regarding study status, but they did not respond. Protocol registration: ISRCTN20328848 |
Woods‐3‐USA.
| Methods | Allocation: randomised Blindness: quadruple (participant, care provider, investigator, outcomes assessor). Setting: multisite study, USA Inclusion criteria: treatment‐seeking patients meeting SIPS criteria for psychosis prodrome, clinically referred, age range 16‐40 years Exclusion criteria: use of antipsychotic medication in last 3 months, initiation/increase in dosage of antidepressant within 6 weeks, medical contraindications to taking ziprasidone (QTcF ≥ 450 msec at screening or baseline, history of arrhythmia or QTc prolongation or syncope, family history of QTc prolongation, current receipt of medication known to prolong QTc, or K+, Mg++, or Ca++ below the normal range Duration: 24 weeks |
| Participants | Diagnosis: people at UHR for psychosis N = 51 Age: 16‐40 years Sex: men and women History: no details |
| Interventions | 1. Ziprasidone: dose 20‐160 mg/day in 2 doses. N = 24 2. Placebo: matched with ziprasidone. N = 27 Each participant offered Supportive Interpersonal Therapy session at each visit |
| Outcomes | Mental state: transition to psychosis (SIPS), SOPS |
| Notes | Due to insufficient information regarding the study and data presentation, published data were not usable for analysis. We contacted study authors via e‐mail three times, but they did not respond. Protocol registration: ClinicalTrials.gov ID NCT00635700 |
BRIEF: Behaviour Rating Inventory for Executive Functions; CAARMS: Comprehensive Assessment of At Risk Mental States; CBT: cognitive behavioural therapy; CHR: clinical high risk; PANSS: Positive and Negative Syndrome Scale; CPT: Continuous Performance Task; DASS‐21: Depression, Anxiety and Stress Scale; DHA: docosahexaenoic acid; DKEFS: Delis Kaplan Executive Function System; DSM‐IV: Diagnostic and Statistical Manual of Mental Disorders, Fourth Edition; FES: first episode schizophrenia; GAF: Global Assessment of Functioning Scale; IQ: intelligence quotient; MADRS: Montgomery‐Asberg Depression Rating Scale; MATRICS: Measurement and Treatment Research to Improve Cognition in Schizophrenia; MBI: Mindfulness‐based intervention; NORMENT: Norwegian Centre for Mental Disorders Research; PANAS: Positive and Negative Affect Schedule; PSWQ‐11: Penn State Worry Questionnaire; PUFA: Polyunsaturated fatty acid; SCID: Structured Clinical Interview for Diagnostic and Statistical Manual of Mental Disorders; SFS: Social Functioning Scale; SIPS: Structured Interview for Prodromal Symptoms; SOPS: Scale of Prodromal Symptoms; TAU: treatment as usual THC: tetrahydrocannabinol; UHR: ultra high risk; UKU: Udvalg for Kliniske Undersøgelser side effect rating scale; WAIS‐R: Wechsler Adult Intelligence Scales‐Revised; WCST: Wisconsin Card Sort Test; WMS‐R: Wechsler Memory Scale‐Revised
Characteristics of ongoing studies [ordered by study ID]
ChiCTR‐INR‐16009566.
| Trial name or title | Personalised strategy for non‐invasive early intervention on clinical high‐risk subjects for psychosis |
| Methods | Allocation: randomised Blindness: unclear Setting: China Inclusion criteria: 1. UHR (SIPS and SOPS criteria), 15‐45 years, IQ > 69, no substance or alcohol abuse within 3 months, no DSM‐V axis I disorders, no prior psychopharmacological treatment; 2. FES (DSM‐V), 15‐45 years, IQ > 69; PANSS ≥ 60, CGI ≥ 4, no other DSM‐V axis I disorders; no prior psychopharmacological treatment; 3. healthy controls: no mental disorders screened (SIPS/SOPS and SCID), 15‐45 years, IQ > 69, no history or family history of mental disorders, no substance or alcohol abuse Exclusion criteria: sensory/motion disorders (e.g. hearing disorders, blindness), neurological illness (brain injury, epilepsy), or other severe somatic illness which can lead to CHR symptoms, claustrophobia, with metallic objects in their head or any type of stimulator in their body |
| Participants | Diagnosis: UHR for psychosis, first episode of psychosis N: not provided Age: 15‐45 years (mean 23 years) Sex: men and women |
| Interventions | 1. Real rTMS 2. Sham rTMS 3. No intervention |
| Outcomes | Mental state: CHR SIPS/SOPS, PANSS Cognition: MCCB, social cognitive function |
| Starting date | January 2017 |
| Contact information | jijunwang27@163.com |
| Notes | Protocol registration: ChiCTR‐INR‐16009566 |
Deyoe‐USA/Mexico.
| Trial name or title | Compensatory cognitive training in clinical high risk Latino youth |
| Methods | Allocation: randomised Blindness: single Setting: USA Inclusion criteria: meet clinical high‐risk criteria, Latino descent, speak Spanish as preferred language Exclusion criteria: concomitant medical/neurological illness, brain injury with loss of consciousness > 30 min, current substance abuse (excluding nicotine), IQ < 80, high suicidal risk Duration: 12 weeks + 12 weeks' follow‐up |
| Participants | Diagnosis: UHR for psychosis N = 120 Age: 12‐30 years Sex: men and women |
| Interventions | 1. Compensatory cognitive training 2. Behavioral: recreational therapy |
| Outcomes | Neurocognition: Global Cognitive Index Functional capacity: UPSA/UPSA‐A Self‐reported functioning: SLoF Mental state: SOPS |
| Starting date | September 2016 |
| Contact information | kcadenhead@ucsd.edu |
| Notes | Protocol registration: ClinicalTrials.gov ID NCT02245607 |
ESPRIT B1‐Germany.
| Trial name or title | Multimodal prevention of psychosis ‐ a randomised trial investigating the efficacy of n‐acetylcysteine (NAC) and integrated preventive psychological intervention (IPPI) in subjects clinically at high risk for psychosis (ESPRIT B1) |
| Methods | Allocation: randomised Blindness: double Setting: Germany Inclusion criteria: age 18‐40 years, people with ability to follow study instructions, likely to attend and complete all required visits, written informed consent, ability to speak, write and understand German, meet Clinical High Risk Criteria (ESPRIT ultra high risk criteria) and/or Basic Symptom Criterion 'Cognitive Disturbances, COGDIS' (2/9 cognitive‐perceptive basic symptoms; assessed by SPIA) Duration: 26 months (26 weeks of treatment + 78 weeks' follow‐up) |
| Participants | Diagnosis: UHR for psychosis N = 200 Age: 18‐40 years Sex: men and women |
| Interventions | 1. Acetylcysteine: dose 2000 mg/day orally, 2 doses, continuously over 26 weeks parallel to the psychological intervention (IPPI or psychological stress management (PSM)) 2. Placebo: orally for 26 weeks parallel to the psychological intervention (IPPI or PSM). 3. Integrated preventive psychological intervention, IPPI: 21 sessions, 1‐20 weekly, last session 2 weeks later 4. Psychological stress management (PSM): 11 sessions; 1‐10 biweekly, last session 2 weeks later |
| Outcomes | Mental state: transition to psychosis (SIPS), symptom remission (APS/BLIPS and/or COGIDS), SIPS, BNSS. Psychosocial functioning: SOFAS, FROGS. Cognition: COGDIS, SPIA, UHR (SPIA); SATMC I & II, PoFA Adverse effects: weight, UKU Laboratory assessments |
| Starting date | September 2016 |
| Contact information | Not provided |
| Notes | Protocol registration: ClinicalTrials.gov ID NCT03149107 |
FOCUS‐Denmark.
| Trial name or title | A randomised clinical trial examining cognitive remediation plus standard treatment versus standard treatment in participants at ultra high risk psychosis‐ effect on cognitive functioning, functional outcome and symptomatology |
| Methods | Allocation: randomised Blindness: double Setting: Denmark Inclusion criteria: age 18‐40 years, meet criteria for UHR of psychosis (≥ 1 vulnerability, attenuated psychotic symptoms, brief limited intermittent psychotic symptoms, informed consent Exclusion criteria: history of psychotic episode of ≥ 1 week's duration, psychiatric symptoms explained by physical illness with psychotropic effect or acute intoxication, serious developmental disorder, currently receiving treatment with methylphenidate, rejection of informed consent Duration: 24 weeks |
| Participants | Diagnosis: UHR for psychosis N = 126 Age: 18‐40 years Sex: men and women |
| Interventions | 1. Cognitive remediation + standard care 2. Standard care |
| Outcomes | Mental state: BACS, MADRS, BPRS‐E, SCoRS, SANS, SPPI‐A, BRIEF‐A, CAARMS, ERT, SCSQ Global state: PSP, GAF, SFS, TASIT, SRS, HiSoC 3. Quality of life: QLS 4. Adverse events |
| Starting date | March 2014 |
| Contact information | merete.nordentoft@dadlnet.dk |
| Notes | Protocol registration: ClinicalTrials.gov ID NCT02098408 |
ISRCTN42478021.
| Trial name or title | Combined individual and family cognitive behavioural therapy compared with treatment as usual |
| Methods | Allocation: randomised (using secure telephone, 1:1 ratio) Blinding: double Setting: UK Inclusion criteria: aged 16‐35 years, screen positive on CAARMS for at‐risk mental state, living with at least one member of their family, help seeking Exclusion criteria: receipt of antipsychotic drugs, moderate‐severe learning disability, organic impairment, insufficient fluency in English Duration: 12 months |
| Participants | Diagnosis: UHR for psychosis N = 76 Age: 16‐35 years Sex: men and women |
| Interventions | 1. Individual + family therapy: maximum 25 individual therapy sessions, ˜1/week, 1 h, over 6 months, (focusing on whatever most concerned participant) + 4‐6 sessions of CBT with key family members or family support members (focusing on making sense of experiences, communication styles, problem solving and goal setting) + TAU, routine care from their care team or GP 2. TAU |
| Outcomes | Mental state: transition to psychosis (CAARMS defined), BDI, SIAS Health and social care: adapted EPQ, EQ‐5D |
| Starting date | March 2016 |
| Contact information | Greater Manchester West Mental Health NHS Foundation Trust Psychosis Research Unit, Rico House, Harrop House, Bury New Road |
| Notes | Protocol registration: ISRCTN42478021 |
NCT02047539.
| Trial name or title | Randomised controlled trial of aspirin vs placebo in the treatment of patients with the clinical risk syndrome for psychosis |
| Methods | Allocation: randomised Blindness: double Setting: USA Inclusion criteria: age 19‐35 years, > 1 of 3 CHR syndromes (SIPS), adequate decisional capacity Exclusion criteria: < 19 years old, pre‐existing gastrointestinal disease, heart disease, kidney disease, taking non‐steroidal anti‐inflammatory medications, hypersensitivity to NSAID, coexisting unstable major medical illness, pregnancy or breastfeeding, consumption > 2 drinks of alcohol/day, blood clotting disorder, taking ACE inhibitors, acetazolamide, anticoagulants, anticonvulsants, beta blockers, diuretics, methotrexate, oral hypoglycaemic or uricosuric agents, history of substance abuse in past 3 months or dependence in past 6 months. Duration: 12 weeks |
| Participants | Diagnosis: UHR N = 40 Age: 19‐35 years Sex: men and women |
| Interventions | 1. Aspirin: 100 mg/day 2. Placebo |
| Outcomes | Mental state: SOPS |
| Starting date | March 2014 |
| Contact information | scott.woods@yale.edu |
| Notes | Protocol registration: ClinicalTrials.gov ID NCT02047539 |
NCT02155699.
| Trial name or title | Exercise and markers of medial temporal health in youth at risk for psychosis |
| Methods | Allocation: randomised Blindness: single Setting: USA Inclusion criteria: age 16‐24, no history of brain injury or neurological disease, no contraindications to exercise training, no history or current treatment with antipsychotic, no contraindications for being in MRI scanner, meet criteria for a prodromal syndrome based on SIPS Exclusion criteria: extremely claustrophobic, significant head injury, other physical disorder that could affect brain functioning, mental retardation, substance use disorder within 6 months, psychotic disorder and/or serious self‐harm behaviours, pregnancy, contraindications to MRI, inability of participant or their parent/guardian to understand informed consent document, meeting criteria for an Axis I psychotic disorder Duration: 12 weeks + 24 months' follow‐up |
| Participants | Diagnosis: UHR for psychosis N = 45 Age: 16‐24 years Sex: men and women |
| Interventions | 1. Exercise 1: 65% of vo2max 2 sessions/week 2. Exercise 2: 85% intensity 3 sessions/week |
| Outcomes | Physiological: brain volume Cognition: MATRICS, relational and item‐specific coding and retrieval task (RISE) Mental state: attenuated symptoms Functioning: social role functioning |
| Starting date | July 2016 |
| Contact information | viyaj.mittal@colorado.edu |
| Notes | Protocol registration: ClinicalTrials.gov ID NCT02155699 |
NCT02234258.
| Trial name or title | Cognitive behavioral social skills training for youth at risk of psychosis |
| Methods | Allocation: randomised Blindness: single Setting: USA Inclusion criteria: prodromal criteria in past 4 years, 1 attenuated psychotic symptom ≤ 3, social functioning < 6 Exclusion criteria: meet criteria for psychotic/neurological disorder, IQ < 70 Duration: 12 months (6 months + 6 months' follow‐up) |
| Participants | Diagnosis: UHR for psychosis N = 225 Age: 14‐30 years Sex: men and women |
| Interventions | 1. Cognitive behavioral social skills (CBSST): 18‐week group comprised of 3 modules (cognitive skills, social skills, problem solving) 2. Psychoeducation support group |
| Outcomes | Functioning: GFS Insight: defeatist beliefs |
| Starting date | January 2015 |
| Contact information | jmadding@ucalgary.ca |
| Notes | Protocol registration: ClinicalTrials.gov ID NCT02234258 |
NCT02404194.
| Trial name or title | Optimizing cognitive training to improve functional outcome in clinical high risk (CHR) |
| Methods | Allocation: randomised Blindness: double Setting: USA Inclusion criteria: English speaking, ≥ 1 psychosis‐risk syndromes (SIPS) Exclusion criteria: IQ < 70, major medical illness or neurological disorder, history of Axis I psychotic disorder and/or clear evidence that psychosis risk syndrome is due to non‐schizophrenia‐spectrum Axis I or Axis II disorder Duration: 10 weeks + 9 months' follow‐up |
| Participants | Diagnosis: UHR for psychosis N = 76 Age: 15‐30 years Sex: men and women |
| Interventions | 1. Targeted cognitive training: 40 h computerised cognitive training 2. Computer games: 40 h of computer games |
| Outcomes | Cognition: MATRICS, behavioural assessment of cognition Global Functioning: Social and Role Scales, behavioural assessment of daily functioning |
| Starting date | March 2015 |
| Contact information | braintrainingstudy@gmail.com |
| Notes | Protocol registration: ClinicalTrials.gov ID NCT02404194 |
NCT02557945.
| Trial name or title | Gabapentin in patients at clinical risk for psychosis |
| Methods | Allocation: randomised Blindness: double Setting: USA Inclusion criteria: COPE patient, age 18‐30, capacity to give informed consent, currently using a reliable method of birth control (female) Exclusion criteria: metal implants in body or history of metal working, or more than one past MRI scan with gadolinium, asthmatic symptoms in past 3 years or known sensitivity to contrast agents, diagnosis of renal failure/disease, acute neurological, neuroendocrine, or medical disorder including renal insufficiency, lifetime diagnosis of hypertension or diabetes, IQ < 70, acute risk for suicide and/or violence, pregnancy, lactation, current abuse of substances (alcohol, cocaine, stimulants, cannabis, opiates, sedative hypnotics), current use or anticipated need for antipsychotics or mood stabilisers (all antipsychotics, also Depakote, lithium, lamotrigine, pregabalin or any medication with a mechanism of action like gabapentin), improvement in CGI score during study ≥ 6 Duration: 6 weeks |
| Participants | Diagnosis: UHR for psychosis N = 48 Age: 18‐30 years Sex: men and women |
| Interventions | 1. Gabapentin: up to 3600 mg/day (9 tablets, 3 times/day) 2. Placebo: up to 9 tablets (3 times/day) |
| Outcomes | Physiological: left CA1 cerebral blood volume (MRI measure) Mental state: SIPS, SOPS Cognitive function: hippocampal‐dependent verbal memory (CLVT‐II) |
| Starting date | August 2015 |
| Contact information | gb2428@columbia.edu |
| Notes | Protocol registration: ClinicalTrials.gov ID NCT02557945 |
NCT02751632.
| Trial name or title | The staged treatment in early psychosis study (STEP): a sequential multistage randomised clinical trial (SMART) of interventions for ultra high risk (UHR) of psychosis patients |
| Methods | Allocation: randomised Blindness: double Setting: Australia Inclusion criteria: age 12‐25 years, ability to speak adequate English and to provide informed consent, meet ≥ 1 UHR for psychosis groups: vulnerability (trait and state risk factor) group, APS group, BLIPS group with symptoms present during past year and associated with a significant reduction in or sustained low functioning Exclusion criteria: past psychotic episode of ≥ 1 week, attenuated psychotic symptoms only present during acute intoxication, organic brain disease known to cause psychotic symptoms, any metabolic, endocrine or other physical illness with known neuropsychiatric consequences, diagnosis of a serious developmental disorder, IQ < 70, history of developmental delay or intellectual disability Duration: 6 weeks (Step 1) + 18 weeks (Step 2) + 6 months (Step 3) |
| Participants | Diagnosis: UHR for psychosis N = 120 Age: 12‐30 years Sex: men and women |
| Interventions | SPS treatment: administered by allied health professionals on a 1‐1 basis, providing participants with emotional support and help with resolving problems in day‐to‐day life during 3‐6 sessions over 6 weeks, each session 30‐50 min The study treatment sequence involves 3 steps, without any break between them. Initially all participants receive SPS treatment (Step 1) A. Participants who improve with the SPS treatment: 1. SPS: sessions for up to 1 year 2. simple monitoring: 3‐monthly intervals for 1 year B. Participants who do not improve with the initial SPS treatment (proceed to Step 2) 1. SPS: 18 weeks, 1‐1 basis, frequency of sessions depending on clinical need and participant preference (> 6 sessions) 2. CBCM: strategies to help stress management (targets thinking and behavioural patterns), practical assistance, as well as yoga and mindfulness (similar intensity of treatment sessions as above) C. At the end of Step 2 C.i. Participants who improve 1. SPS: monthly sessions for further 6 months. 2. Simple monitoring: at 3‐monthly intervals for further 6 months. C.ii Participants who do not improve proceed to Step 3 1. CBCM + fluoxetine: dose 20 mg/day titrated at 6 weeks to 40 mg/day, 6 months 2. CBCM + placebo: 6 months If no improvement/deterioration by 12 weeks in Step 3, option to continue with treatment, increase dose, start new medication. Upon choosing, medication may either be an antipsychotic (quetiapine) or omega‐3 fatty acids ('fish oil'), taken in addition to the other treatment components of Step 3 |
| Outcomes | Functioning: GAF, SFS Global state: relapse Mental state: transition to psychotic disorder (CAARMS), BPRS, SANS, MADRS |
| Starting date | April 2016 |
| Contact information | barnaby.nelson@orygen.org.au |
| Notes | Protocol registration: ClinicalTrials.gov ID NCT02751632 |
NCT02951208.
| Trial name or title | Transcranial direct current stimulation coupled with virtual rehabilitation for negative symptoms in atrisk youth |
| Methods | Allocation: randomised Blindness: double Setting: Canada Inclusion criteria: age 16‐30 years, meet CHR criteria for a psychosis risk syndrome (SIPS), SOPS (negative subscale) score of > 11, > 1 negative symptom of severity ≥ 3 Exclusion criteria: psychotic disorder, IQ < 70, seizures or clinically significant neurological disorder that may contribute to prodromal symptoms, involvement in another treatment study in past 4 weeks Duration: 4 weeks |
| Participants | Diagnosis: people with CHR for psychosis N = 22 Age: 16‐30 years Sex: men and women |
| Interventions | 1. Active anodal tDCS*: over left DLPFC, for 30 minutes, 3/week for 4 weeks 2. Sham anodal tDCS**: over left DLPFC, for 30 minutes, 3/week for 4 weeks |
| Outcomes | Mental state: SOPS (negative and positive subscale), BSS, CDSS, MCCB, RAD, RMET, TASIT, ER40, IRI, SSQ Functioning: GAF, SFS Functional brain imaging: change in regional brain activity; structural brain imaging changes in brain structure (e.g. white matter tract integrity, measured with structural MRI) |
| Starting date | October 2016 |
| Contact information | george.foussias@camh.ca |
| Notes | *Other name: Active Transcranial Direct Current Stimulation Behavioral: Active VR Motivation Training. **Other Name: Sham Transcranial Direct Current Stimulation Behavioral: Sham VR Motivation Training Protocol registration: ClinicalTrials.gov ID NCT02951208 |
NCT02960451.
| Trial name or title | Randomised trial of usual care vs. specialised, phase specific care for youth at risk for psychosis |
| Methods | Allocation: randomised Blindness: open Setting: USA Inclusion criteria: 12‐30 years old, understand and sign an informed consent (or assent for minors) document in English, meet diagnostic criteria for prodromal syndrome COPS criteria Exclusion criteria: diagnosis of Axis I psychotic disorder, including mood disorder with psychotic symptoms, IQ < 70, clinically significant central nervous system disorder that may contribute to prodromal symptoms or confound their assessment, alcohol or substance dependence in the past 6 months. Duration: 24 months |
| Participants | Diagnosis: UHR for psychosis N = 128 Age: 12‐30 years Sex: men and women |
| Interventions | 1. PRIME care: specialist medication, cognitive behaviour therapy, family focused therapy 2. Usual care: education and psychotherapy as available form community providers |
| Outcomes | Functioning: GAF Service utilisation: hospitalisation and emergency room use |
| Starting date | January 2015 |
| Contact information | barbara.walsh@yale.edu |
| Notes | Protocol registration: ClinicalTrials.gov ID NCT02960451 |
OMEGA3‐Ireland.
| Trial name or title | Randomised control trial of omega3 fatty acids compared to placebo in the prevention of psychosis in very high risk individuals |
| Methods | Allocation: randomised Blindness: double Setting: Ireland Inclusion criteria: 13‐50 years, written informed consent, UHR (SIPS) Exclusion criteria: previous psychotic episode > 1 week's duration, previous manic episode > 1 week's duration, acute suicidal or aggressive behaviour, substance dependence, lactose intolerance/milk allergy, intellectual disability, previous treatment with antipsychotic or mood stabiliser for psychiatric indication > 2 weeks in past 3 months, consumption of over the counter or prescribed Omega3 fatty acids supplements within 12 weeks of entering study, pregnancy/breastfeeding, severe intercurrent illness that could affect ability of participant to take part in study Duration: 6 months |
| Participants | Diagnosis: UHR for psychosis N = 150 Age: 13‐45 years Sex: men and women |
| Interventions | 1. Omega3 fatty acids: 200 mL juice drinks, containing 1000 mg of eicosapentaenoic acid and 1000 mg docosahexaenoic acid – across 6 months 2. Placebo: matched with intervention, 200 mL juice drinks – across 6 months |
| Outcomes | Mental state: transition to psychosis (SIPS) Physiological: blood omega3:omega6 ratio |
| Starting date | September 2013 |
| Contact information | damianodriscoll@ucc.ie |
| Notes | Protocol registration: ClinicalTrials.gov ID NCT02848469 |
PREVENT‐Germany.
| Trial name or title | Rationale and baseline characteristics of PREVENT: a second‐generation intervention trial in subjects at‐risk (prodromal) of developing first‐episode psychosis evaluating cognitive behaviour therapy, aripiprazole, and placebo for the prevention of psychosis |
| Methods | Allocation: randomised (computer‐generated, restricted block randomisation, stratified by MADRS score, kept in a remote secure location and administered by an independent third party until all study data are collected and verified). Blindness: double Setting: Germany Inclusion criteria: Inclusion Criteria Checklist, SIPS/SOPS criteria Exclusion criteria: current or past antipsychotic treatment > 1 week, previous psychotic episode > 1 week, current suicidality or dangerous behaviour, alcohol or substance dependence, organic brain disease, IQ < 70, living out of area, other medical reasons like current or intended pregnancy, lactation or missing reliable method of contraception, taking drugs with anticipated interactions, etc. Duration: 12 months |
| Participants | Diagnosis: UHR for psychosis (APS, BLIPS, BS, family risk plus reduced functioning) N = 156 Age: 18‐40 years, average 23 years Sex: men and women |
| Interventions | 1. Aripiprazole + clinical management: dose range 5‐15 mg/day, 20 manualised sessions (1‐4 weekly sessions, then biweekly, 3 months, then monthly, following 8 months); initial session 45–60 min, with other sessions of 20–30 min. 2. CBT: 30 individual, 50‐min CBT sessions over 12‐months (weekly month 1‐4, then biweekly, 6 months, then monthly, the last 2 months) 3. Placebo + clinical management: tablets identical to aripiprazole |
| Outcomes | Mental state: transition to psychosis (≥ 1 of 5 SOPS‐positive items rated ≥ 6 longer than 7 days), time to transition, SIPS/SOPS, SPIA, PANSS, MADRS, BDI, STAI Quality of life: Modular System for Quality of Life Functioning: SOFAS, SAS. Adverse effects: UKU, EPSR |
| Starting date | April 2008 |
| Contact information | joachim.klosterkoetter@uk‐koeln.de |
| Notes | Protocol registration: ISRCTN: 02658871 |
Quarashi‐Pakistan.
| Trial name or title | Pilot study of minocycline and/or omega‐3 fatty acids added to treatment as usual for at risk mental states (NAYAB) |
| Methods | Allocation: randomised Blindness: double Setting: Pakistan Inclusion criteria: help‐seeking individuals, 16‐35 years, > 1 ARMS criteria, competent to provide informed consent Exclusion criteria: history of previously experiencing a psychotic illness, IQ < 70 and/or history of learning disability, pre‐existing inflammatory conditions, organic brain disease, treatment with an antipsychotic or mood‐stabilising agent, prior history of intolerance or serious adverse effects (hepatotoxicity, photosensitivity, blood dyscrasias) to any of the tetracyclines or omega‐ 3 fatty acids, concomitant penicillin therapy or concomitant anticoagulant therapy, active substance abuse (except nicotine or caffeine) or dependence within 3 months (DSM‐V), treatment with warfarin or lamotrigine, current or previous treatment with tetracycline antibiotics or omega‐3 fatty acids in the preceding 3 months before study entry, current treatment with any anti‐inflammatory medication, treatment with electroconvulsive therapy within 12 weeks preceding study, active expression of suicidal ideation (CAARMS item 7.3 severity score 6) or current aggression/dangerous behaviour (CAARMS item 5.4 severity score 6), relevant current or past haematologic, hepatic, renal, neurological or other medical disorder that in the opinion of the principal investigator may interfere with the study, pregnancy or breastfeeding women Duration: unclear |
| Participants | Diagnosis: UHR for psychosis N = 320 Age: 16‐35 years Sex: men and women |
| Interventions | 1. Minocycline + TAU: dose 200 mg/day 2. Omega‐3 fatty acids + TAU: dose 1.2 g/day 3. Minocycline + omega‐3 fatty acids + TAU: doses as above 4. Placebo + TAU |
| Outcomes | Mental state: transition to psychotic disorder, severity of at‐risk mental state (CAARMS) |
| Starting date | October 2015 |
| Contact information | ibchaudhry@btinternet.com |
| Notes | Protocol registration: ClinicalTrials.gov ID NCT02569307 |
Rurhman‐USA/UK.
| Trial name or title | Early intervention in attenuated psychosis syndrome: a phase II study evaluating efficacy, safety, and tolerability of oral BI 409306 |
| Methods | Allocation: randomised (secure telephone, 1:1 ratio) Blindness: double Setting: USA, UK Inclusion criteria: 16‐30 years, patients with APS (SIPS), with a screening risk profile based on NAPLS algorithm Exclusion criteria: unclear Duration: 52 weeks + 4 weeks' follow‐up |
| Participants | Diagnosis: UHR for psychosis N = 300 Age: 16‐30 years Sex: men and women |
| Interventions | 1. Oral BI 409306 2. Placebo |
| Outcomes | Global state: CGI‐S, PGI‐I Mental state: transition to psychosis (SOPS), time to transition (PANSS) Cognition: SCoRS, MATRICS, MCCB Physiological: EEG, event‐related potentials, and visual‐evoked potentials |
| Starting date | Q2 2017 |
| Contact information | Not provided |
| Notes | Protocol registration: ClinicalTrials.gov ID NCT01892384 |
ACE: angiotensin‐converting‐enzyme; APS: attenuated psychotic symptoms; ARMS: at risk mental state; BACS: Brief Assessment of Cognition in Schizophrenia; BDI: Beck Depression Inventory; BLIPS: Brief Limited Intermittent Psychotic Symptoms Group; BNSS: Brief Negative Symptom Scale; BPRS: Brief Psychiatric Rating Scale; BPRS‐E: Brief Psychiatric Rating Scale Expanded Version; BRIEF‐A: Behavior Rating Inventory of Executive Function, Adult Version; BS: basic symptoms; BSS: Beck Scale for Suicidal Ideation; CAARMS: Comprehensive Assessment of At Risk Mental States; CBCM: Cognitive Behavioural Case Management; CBT: cognitive behavioural therapy; CDSS: Calgary Depression Scale for Schizophrenia; CGI: Clinical Global Impression; CGI‐S: Clinical Global Impression ‐ Severity; CHR: clinical high risk; CLVT‐II: California Verbal Learning Test‐Second Edition; COGDIS: conceptual disorganization and cognitive basic symptoms; COPS: Criteria of Prodromal States; DLPFC: dorsolateral prefrontal cortex; DSM‐V: Diagnostic and Statistical Manual of Mental Disorders, Fifth Edition; EEG: electroencephalography; EPQ: Eysenck Personality Questionnaire; EPSR: Extrapyramidal Symptom Rating Scale; EQ‐5D: EuroQol 5D instrument; ER40: Emotion Recognition 40; ERT: Emotion Recognition Task; FES: first episode schizophrenia; FROGS: Functional Remission of General Schizophrenia; GAF: Global Assessment of Functioning GFS: Global Functioning Scale; HiSoC: High Risk Social Challenge; IQ: intelligence quotient; IRI: Interpersonal Reactivity Index; MADRS: Montgomery Asberg Depression Rating Scale; MATRICS: Measurement and Treatment Research to Improve Cognition in Schizophrenia; MCCB: Measurement and Treatment Research to Improve Cognition in Schizophrenia (MATRICS) Consensus Cognitive Battery; MRI: magnetic resonance imaging; NAPLS: North American Prodrome Longitudinal Study; NSAID: nonsteroidal anti‐inflammatory drug; PANSS: Positive and Negative Syndrome Scale; PGI‐I: Patient Global Impressions‐Improvements; PoFA: Pictures of Facial Affect; PSP: Personal and Social Performance Scale; QLS: Quality of Life Scale; RAD: Relationships Across Domains; RMET: Reading the Mind in the Eyes Task; rTMS: repetitive transcranial magnetic stimulation; SANS: Scale for the Assessment of Negative Symptoms SAS: Social Adjustment Scale; SATMC I & II: Social Attribution Task‐Multiple Choice; SCID: Structured Clinical Interview for Diagnostic and Statistical Manual of Mental Disorders (DSM); SCoRS: Schizophrenia Cognitive Rating Scale; SCSQ: Social Cognition Screening Questionnaire; SFS: Social Functioning Scale; SIAS: Social Interaction Anxiety Scale; SIPS: Structured Interview for Prodromal Symptoms; SLoF: Specific Level of Functioning Scale; SOFAS: Social and Occupational Functioning Assessment Scale; SOPS: Scale of Prodromal Symptoms; SPIA: Schizophrenia Proneness Instrument ‐ Adult Version; SPPI‐A: Schizophrenia Prediction Proneness Instrument ‐ Adult Version; SPS: support and problem solving; SRS: Social Responsiveness Scale; SSQ: Simulator Sickness Questionnaire; STAI: State Trait Anxiety Inventory; TASIT: Awareness of Social Inferences Test; TAU: treatment as usual; UHR: ultra high risk; UKU: Udvalg for Kliniske Undersøgelser side effect rating scale
Differences between protocol and review
Change in wording of outcomes: we have changed 'clinically important response' to 'clinically important change', and 'significant change' to 'clinically important change' in line with Cochrane Schizophrenia outcome names and to harmonise types of outcomes with 'Summary of findings' table outcomes. We clarified that outcomes in the 'Summary of findings' table should, ideally, be clinically important change.
We have updated some of the methods text to reflect latest changes in Cochrane Schizophrenia's methods template.
We have changed the title from 'Early interventions for prodromal stage of psychosis' to 'Interventions for prodromal stage of psychosis' as the interventions are not 'early' themselves, it is the stage of illness that is 'early'.
Contributions of authors
Dina Bosnjak Kuharic: writing and development of the protocol, data extraction, data analysis, data interpretation, writing the review, editing the review, final approval of the review.
Ivana Kekin: data extraction, data analysis, data interpretation, writing the review, editing the review, final approval of the review.
Joanne Hew: writing and development of the protocol, data analysis, editing the review, final approval of the review.
Martina Rojnić Kuzman: writing and development of the protocol, editing the review, final approval of the review.
Livia Puljak: data analysis, data interpretation, writing the review, editing the review, final approval of the review.
Sources of support
Internal sources
-
University Psychiatric Hospital, Zagreb, Croatia.
Employs review author
-
Clinical Hospital Centre Zagreb, Croatia.
Employs review authors
St Mary's Hospital, London, UK.
External sources
No external sources of support, Other.
Declarations of interest
Dina Bošnjak: none
Ivana Kekin: none
Joanne Hew: none
Martina Rojnić Kuzman: none
New
References
References to studies included in this review
ADAPT‐Canada {published data only}
- Addington J, Epstein I, Liu L, French P, Boydell KM, Zipursky RB. A randomised controlled trial of cognitive behavioral therapy for individuals at clinical high risk of psychosis. Schizophrenia Research 2011;125(1):54‐61. [CSzG: Ref21945] [DOI] [PubMed] [Google Scholar]
- Addington J, Zipursky R, Epstein I. ADAPT (Access, Detection and Psychological Treatments). Schizophrenia Research 2006;86(Suppl 1):S6. [CSzG: Ref13364] [Google Scholar]
- NCT00260273. Access, detection and psychological treatments. www.ClinicalTrials.gov/ct/show/ 2005. [CSzG: Ref14638]
Amminger‐Austria {published data only}
- Amminger G. Ethyl eicosapentanoic acid for prodromal psychosis. Stanley Foundation Research Programs 2009. [CSzG: Ref17423]
- Amminger G, Schafer M, Papageorgiou K, Cotton S, Harrigan S, Mackinnon A, et al. Indicated prevention with long‐chain omega‐3 fatty acids in adolescents at ultra‐high‐risk for psychosis: a randomised, placebo‐controlled trial. Early Intervention in Psychiatry 2008;2(Suppl 1):A29. [CSzG: Ref19107] [Google Scholar]
- Amminger GP, Chanen AM, Ohmann S, Klier CM, Mossaheb N, Bechdolf A, et al. Omega‐3 fatty acid supplementation in adolescents with borderline personality disorder and ultra‐high risk criteria for psychosis: a post hoc subgroup analysis of a double‐blind, randomised controlled trial. Canadian Journal of Psychiatry 2013;58(7):402‐8. [CSzG: Ref28534] [DOI] [PubMed] [Google Scholar]
- Amminger GP, Harris MS, McGorry PD, Henry LP. Omega‐3 fatty acids for indicated prevention: treatment results and pathomechanisms. European Archives of Psychiatry and Clinical Neuroscience 2013;263(Suppl. 1):S44‐5. [CSzG: Ref28434] [Google Scholar]
- Amminger GP, Leicester S, Yung AR, Yuen HP, McGorry PD. Age predicts transition to psychosis in an ultra‐high risk sample. Proceedings of the 3rd International Conference on Early Psychosis; 2002 Sep 25‐28; Copenhagen, Denmark. 2002:61.
- Amminger GP, McGorry PD. Update on omega‐3 polyunsaturated fatty acids in early ‐stage psychotic disorders. Neuropsychopharmacology 2012;37(1):309‐10. [CSzG: Ref23726] [DOI] [PMC free article] [PubMed] [Google Scholar]
- Amminger GP, Mechelli A, Rice S, Kim SW, Klier CM, McNamara RK, et al. Predictors of treatment response in young people at ultra‐high risk for psychosis who received long‐chain omega‐3 fatty acids. Translational Psychiatry 2015;5:e495. [CSzG: Ref29299] [DOI] [PMC free article] [PubMed] [Google Scholar]
- Amminger GP, Schafer MR. Indicated prevention with omega‐3 fatty acids in adolescents at ultra‐high risk for psychosis ‐ rationale, methods, and 3‐months outcome. Schizophrenia Research 2006;86(Suppl 1):S97‐8. [CSzG: Ref13367] [Google Scholar]
- Amminger GP, Schafer MR. Is it feasible to conduct a RCT in ultra‐high risk individuals at a child and adolescent psychiatric service?. Schizophrenia Research 2006;86(Suppl 1):S98. [CSzG: Ref13368] [Google Scholar]
- Amminger GP, Schafer MR, Klier CM, Papageorgiou K, Slavik J, Holzer I, et al. Indicated prevention with long‐chain omega‐3 fatty acids in young people at ultra‐high risk for psychosis: a randomised, placebo‐controlled trial. Early Intervention in Psychiatry 2010;4(Suppl 1):7. [CSzG: Ref23467] [Google Scholar]
- Amminger GP, Schafer MR, Schlogelhofer M, Klier CM, McGorry PD. Longer‐term outcome in the prevention of psychotic disorders by the Vienna omega‐3 study. Nature Communications 2015;6:7934. [CSzG: Ref33023] [DOI] [PMC free article] [PubMed] [Google Scholar]
- Amminger GP, Schlogelhofer M, Klier C, McGorry P, Schafer M. Longer‐term follow‐up in the Vienna omega‐3 psychosis prevention trial. Early Intervention in Psychiatry 2014;8:41. [CSzG: Ref29378] [Google Scholar]
- Amminger GP, Schäfer MR, Papageorgiou K, Klier CM, Cotton SM, Harrigan SM, et al. Long‐chain omega‐3 fatty acids for indicated prevention of psychotic disorders: a randomised, placebo‐controlled trial. Archives of General Psychiatry 2010;67(2):146‐54. [CSzG: Ref20680; DOI: 10.1001/archgenpsychiatry.2009.192.] [DOI] [PubMed] [Google Scholar]
- Amminger P, Mossaheb N, Schlgelhofer M, Schafer M. Fatty acid metabolism and the onset of psychotic disorder. European Psychiatry 2011;26(Suppl 1):2089. [CSzG: Ref22967] [Google Scholar]
- Anonymous. Fish oil may help ward off psychosis. Journal of Psychosocial Nursing and Mental Health Services 2010;48(5):55. [CSzG: Ref20739] [Google Scholar]
- Berger G, Amminger P, McGorry P. Stage dependant effect of omega‐3 fatty acids in emerging psychosis. European Psychiatry 2011;26(Suppl 1):1347. [CSzG: Ref22966] [Google Scholar]
- Berger GE, Proffitt TM, McConchie M, Yuen H, Wood SJ, Amminger GP, et al. Ethyl‐eicosapentaenoic acid in first‐episode psychosis: a randomised, placebo‐controlled trial. Journal of Clinical Psychiatry 2007;68(12):1867‐75. [CSzG: Ref15561; ISSN: 1555‐2101] [DOI] [PubMed] [Google Scholar]
- Ehrlich A. Evidence‐based medicine. Omega‐3 supplementation delays transition to psychotic disorder in ultra‐high‐risk adolescents and young adults. Clinical Advisor for Nurse Practitioners 2010;13(5):79‐80. [CSzG: Ref21562] [Google Scholar]
- Föcking M, Dicker P, Lopez LM, Cannon M, Schäfer MR, McGorry PD, et al. Differential expression of the inflammation marker IL12p40 in the at‐risk mental state for psychosis: a predictor of transition to psychotic disorder?. BMC Psychiatry 2016;16(1):326. [DOI: 10.1186/s12888-016-1039-7] [DOI] [PMC free article] [PubMed] [Google Scholar]
- Klier C, Hollmann M, Schlögelhofer M, Mossaheb N, Friedrich M, Amminger PG. Indicated prevention with omega‐3 fatty acids (EPA/DHA) in adolescents with "at‐risk‐mental‐state“ for psychosis. 8th World Congress of Psychiatry; 2005 Sep 10‐15; Cairo, Egypt. 2005. [CSzG: Ref12438]
- Lavoie S, Benninger F, Feucht M, Klier CM, Schaefer MR, Amminger GP. Correlates of EEG resting states with erythrocyte membrane omega‐3 fatty acid levels and psychopathological symptoms in individuals at ultra‐high risk for psychosis. Early Intervention in Psychiatry 2014;8:137. [CSzG: Ref29516] [Google Scholar]
- Lavoie S, Schafer MR, Whitford TJ, Benninger F, Feucht M, Klier CM, et al. Frontal delta power associated with negative symptoms in ultra‐high risk individuals who transitioned to psychosis. Schizophrenia Research 2012;138(2‐3):206‐11. [CSzG: Ref24256] [DOI] [PubMed] [Google Scholar]
- Lavoie S, Schafer MR, Whitford TJ, Benninger F, Feucht M, Klier CM, et al. Frontal delta power associated with negative symptoms in ultrahigh risk individuals who transitioned to psychosis. Early Intervention in Psychiatry 2012;6:38. [CSzG: Ref24960] [DOI] [PubMed] [Google Scholar]
- Mossaheb N, Papageorgiou K, Schafer MR, Becker J, Schloegelhofer M, Amminger GP. Changes in triglyceride levels in ultra‐high risk for psychosis individuals treated with omega‐3 fatty acids. Early Intervention in Psychiatry 2018; Vol. 12, issue 1:30‐36. [DOI: 10.1111/eip.12275] [DOI] [PubMed]
- Mossaheb N, Schafer MR, Schlogelhofer M, Klier CM, Cotton SM, McGorry PD, et al. Effect of omega‐3 fatty acids for indicated prevention of young patients at risk for psychosis: when do they begin to be effective?. Schizophrenia Research 2013;148(1‐3):163‐7. [CSzG: Ref28649] [DOI] [PubMed] [Google Scholar]
- NCT00396643. Indicated prevention with omega‐3 fatty acids in adolescents with ‘at‐risk‐mental‐state’ for psychosis: a randomised, double blind, placebo‐controlled treatment trial. www.ClinicalTrials.gov/ct/show/ 2006. [CSzG: Ref14873]
- Papageorgiou K, Schafer MR, Schlogelhofer M, Mossaheb N, Amminger GP. Indicated prevention with omega‐3 fatty acids in young people with 'at‐risk‐mental‐state' for psychosis: design of a 5‐year follow‐up. European Archives of Psychiatry and Clinical Neuroscience 2011;261:S55. [CSzG: Ref23749] [Google Scholar]
- Schafer MR, Klier CM, Papageorgiou K, Friedrich MH, Amminger GP. Early detection of psychotic disorders. Neuropsychiatrie 2007;21(1):37‐44. [CSzG: Ref15290] [PubMed] [Google Scholar]
- Smesny S, Milleit B, Hipler UC, Milleit C, Schafer MR, Klier CM, et al. Omega‐3 fatty acid supplementation changes intracellular phospholipase A2 activity and membrane fatty acid profiles in individuals at ultra‐high risk for psychosis. Molecular Psychiatry 2013;19(3):317‐24. [CSzG: Ref28243] [DOI] [PubMed] [Google Scholar]
- Smesny S, Milleit B, Schaefer MR, Hesse J, Schlögelhofer M, Langbein K, et al. Effects of omega‐3 PUFA on immune markers in adolescent individuals at ultra‐high risk for psychosis ‐ results of the randomised controlled Vienna omega‐3 study. Schizophrenia Research 2017;S0920‐9964(17):30039‐7. [DOI: 10.1016/j.schres.2017.01.026] [DOI] [PubMed] [Google Scholar]
Choi‐USA {published data only}
- Choi J, Corcoran C, Dixon L, Fiszdon J, Javitt D. Processing speed training and social functioning in young adults at clinical high risk for psychosis: a pilot study. Early Intervention in Psychiatry 2014;8:109. [CSzG: Ref29417] [Google Scholar]
- Choi J, Corcoran C, Dixon L, Javitt DC. Processing speed training and social functioning in teenagers and young adults at clinical high risk for psychosis. Schizophrenia Bulletin 2015;41:S41. [CSzG: Ref29418] [Google Scholar]
- Choi J, Corcoran CM, Fiszdon JM, Stevens M, Javitt DC, Deasy M, et al. Pupillometer‐based neurofeedback cognitive training to improve processing speed and social functioning in individuals at clinical high risk for psychosis. Psychiatric Rehabilitation Journal 2017;40(1):33‐42. [CSzG: Ref35317] [DOI] [PMC free article] [PubMed] [Google Scholar]
DEPTh‐Australia {published data only}
- Crittenden K, Fleming J, Startup M, Carr V, Baker A, Schall U, et al. Recruitment and engagement of youth in an ultra high risk treatment study. Early Intervention in Psychiatry 2008;2(Suppl 1):A127. [CSzG: Ref19115] [Google Scholar]
- Stain H, Bucci S, Halperin S, Emsley R, Shall U, Lewin T, et al. DEPTh: randomised controlled trial of cognitive behavioral therapy for young people at ultra high risk for psychosis. Early Intervention in Psychiatry 2014;8:15. [CSzG: Ref29673] [Google Scholar]
- Stain HJ, Bucci S, Baker A, Carr V, Emsley R, Halpin S, et al. A randomised controlled trial of CBT for young people at risk for psychosis: the Detection and Evaluation of Psychological Therapy (DEPTh) trial. European Archives of Psychiatry and Clinical Neuroscience 2015;1:S8‐9. [CSzG: Ref33810] [Google Scholar]
- Stain HJ, Bucci S, Baker AL, Carr V, Emsley R, Halpin S, et al. A randomised controlled trial of cognitive behaviour therapy versus non‐directive reflective listening for young people at ultra high risk of developing psychosis: the detection and evaluation of psychological therapy (DEPTh) trial. Schizophrenia Research 2016;176(2‐3):212‐9. [CSzG: Ref35298] [DOI] [PubMed] [Google Scholar]
- Stain HJ, Crittenden K, Startup M, Carr V, Baker A, Schall U, et al. Rural and urban youth at ultra high risk for psychosis: baseline characteristics from the DEPTh randomised controlled trial of cognitive behavior therapy. Schizophrenia Bulletin 2011;37:322. [CSzG: Ref22815] [Google Scholar]
- Stain HJ, Crittenden K, Startup M, Carr V, Baker A, Schall U, et al. The DEPTh randomised controlled trial of cognitive behaviour therapy for youth at ultra high risk for psychosis: baseline characteristics for rural and urban youth. Australian and New Zealand Journal of Psychiatry 2010:25‐6. [CSzG: Ref21845]
- Stain HJ, Crittenden K, Startup M, Carr V, Baker A, Schall U, et al. The DEPTh randomised controlled trial of cognitive behaviour therapy targeting ultra high risk for psychosis: baseline comparisons for rural and urban youth. Early Intervention in Psychiatry 2010;4(Suppl 1):113. [CSzG: Ref23498] [Google Scholar]
- Stain HJ, Startup M, Carr V, Baker A, Schall U. The DEPTh project: a multisite RCT for youths at risk for psychosis. Schizophrenia Research 2006;86(Suppl 1):S51‐2. [CSzG: Ref13401] [Google Scholar]
- Startup M. The DEPTh project: detection, evaluation, and psychological therapy for health. Australian New Zealand Clinical Trials Registry 2006. [CszG: Ref18442]
EDIE‐2‐UK {published data only}
- Byrne RE, Morrison AP. Young people at risk of psychosis: their subjective experiences of monitoring and cognitive behaviour therapy in the early detection and intervention evaluation 2 trial. Psychology and Psychotherapy 2014;87(3):357‐71. [CSzG: Ref29312] [DOI] [PubMed] [Google Scholar]
- Flach C, French P, Dunn G, Fowler D, Gumley AI, Birchwood M, et al. Components of therapy as mechanisms of change in cognitive therapy for people at risk of psychosis: analysis of the EDIE‐2 trial. British Journal of Psychiatry 2015;207(2):123‐9. [CSzG: Ref33109] [DOI] [PubMed] [Google Scholar]
- Morrison A. Early detection and intervention evaluation for individuals at high risk of psychosis 2. http://www.controlled‐trials.com 2008. [CSzG: Ref18285]
- Morrison A. Early detection and intervention evaluation for people at risk of psychosis (edie‐2): A multisite randomised controlled trial of cognitive therapy for at‐risk mental states. Early Intervention in Psychiatry 2012;6:11. [CSzG: Ref24968] [Google Scholar]
- Morrison A, French P, Bentall R, Lewis S, Birchwood M, Fowler D, et al. Early detection and psychological intervention using cognitive therapy for individuals at high risk of psychosis EDI2: baseline characteristics. Early Intervention in Psychiatry 2008;2(Suppl 1):A15. [CSzG: Ref19128] [DOI] [PubMed] [Google Scholar]
- Morrison AP. EDIE‐2: early detection and psychological intervention for individuals at high risk of psychosis (2). www.controlled‐trials.com 2007. [CSzG: Ref15381]
- Morrison AP, Birchwood M, Pyle M, Flach C, Stewart SL, Byrne R, et al. Impact of cognitive therapy on internalised stigma in people with at‐risk mental states. British Journal of Psychiatry 2013;203(2):140‐5. [CSzG: Ref28630] [DOI] [PubMed] [Google Scholar]
- Morrison AP, French P, Stewart SL, Birchwood M, Fowler D, Gumley AI, et al. Early detection and intervention evaluation for people at risk of psychosis: multisite randomised controlled trial. BMJ 2012;344(7852):e2233. [CSzG: Ref24208] [DOI] [PMC free article] [PubMed] [Google Scholar]
- Morrison AP, French P, Stewart SL, Birchwood M, Fowler D, Gumley AI, et al. Early detection and intervention evaluation for people at‐risk of psychosis. Schizophrenia Research 2012;136:S17. [CSzG: Ref29554] [DOI] [PMC free article] [PubMed] [Google Scholar]
- Morrison AP, Pyle M, Stewart SL, French P, Byrne R, Flach C, et al. Internalised stigma in young people at high risk of developing psychosis: findings from a cognitive therapy trial. Schizophrenia Research 2014;153:S42. [CSzG: Ref29555] [Google Scholar]
- Morrison AP, Stewart SL, French P, Bentall RP, Birchwood M, Byrne R, et al. Early detection and intervention evaluation for people at high‐risk of psychosis‐2 (EDIE‐2): trial rationale, design and baseline characteristics. Early Intervention in Psychiatry 2011;5(1):24‐32. [CSzG: Ref22695] [DOI] [PubMed] [Google Scholar]
- Morrison T. Early detection and psychological intervention for individuals at high risk of psychosis. EDIE‐2. Data on File 2006. [CSzG: Ref13874]
- Pelosi AJ. Rational policy making for early psychosis might yet become possible. BMJ 2012;344(7856):e3137. [CSzG: Ref24326] [DOI] [PubMed] [Google Scholar]
- Pyle M, Stewart SL, French P, Byrne R, Patterson P, Gumley A, et al. Internalised stigma, emotional dysfunction and unusual experiences in young people at risk of psychosis. Early Intervention in Psychiatry 2015;9(2):133‐40. [CSzG: Ref29813] [DOI] [PubMed] [Google Scholar]
EDIE‐NL {published data only}
- Dragt S, Gaag M. Prevention of psychosis with a cognitive behavioural intervention in help‐seeking young people with an at risk mental state for developing psychosis. www.trialregister.nl/trialreg/index.asp 2007. [CSzG: Ref19655]
- Ising HK, Kraan TC, Rietdijk J, Dragt S, Klaassen RM, Boonstra N, et al. Four‐year follow‐up of cognitive behavioral therapy in persons at ultra‐high risk for developing psychosis: the Dutch Early Detection Intervention Evaluation (EDIE‐NL) trial. Schizophrenia Bulletin 2016;42(5):1243‐52. [CSzG: Ref35214] [DOI] [PMC free article] [PubMed] [Google Scholar]
- Ising HK, Lokkerbol J, Rietdijk J, Dragt S, Klaassen RM, Kraan T, et al. Four‐year cost‐effectiveness of cognitive behavior therapy for preventing first‐episode psychosis: the Dutch Early Detection Intervention Evaluation (EDIE‐NL) trial. Schizophrenia Bulletin 2017;43(2):365‐74. [CSzG: Ref35824] [DOI] [PMC free article] [PubMed] [Google Scholar]
- Ising HK, Smit F, Veling W, Rietdijk J, Dragt S, Klaassen RM, et al. Cost‐effectiveness of preventing first‐episode psychosis in ultra‐high‐risk subjects: multi‐centre randomised controlled trial. Psychological Medicine 2015;45(7):1435‐46. [CSzG: Ref27798] [DOI] [PubMed] [Google Scholar]
- Kraan TC, Ising HK, Fokkema M, Velthorst E, Berg DP, Kerkhoven M, et al. The effect of childhood adversity on 4‐year outcome in individuals at ultra high risk for psychosis in the Dutch Early Detection Intervention Evaluation (EDIE‐NL) Trial. Psychiatry Research 2017;247:55‐62. [CSzG: Ref35559] [DOI] [PubMed] [Google Scholar]
- Nieman DH, Ruhrmann S, Rietdijk J, Dragt S, Ising H, Klaassen R, et al. Preventive psychotherapy. Schizophrenia Research 2014;153:S42‐3. [CSzG: Ref29601] [Google Scholar]
- Rietdijk J, Dragt S, Klaassen R, Ising H, Nieman D, Wunderink L, et al. A single blind randomised controlled trial of cognitive behavioural therapy in a help‐seeking population with an at risk mental state for psychosis: the Dutch Early Detection and Intervention Evaluation (EDIE‐NL) trial. Trials 2010;11:30. [CSzG: Ref20654] [DOI] [PMC free article] [PubMed] [Google Scholar]
- Gaag M. The effects of CBT in personswith ultra high risk: the Dutch EDIE trial. European Archives of Psychiatry and Clinical Neuroscience 2011;261:S18. [CSzG: Ref23756] [Google Scholar]
- Gaag M, Nieman D, Wunderink L, Klaassen R, Rietdijk J, Dragt S, et al. The results of a specific CBT intervention in young help‐seeking patients with social decline and an ultra‐high risk for developing a first‐episode of psychosis. Early Intervention in Psychiatry 2012;6:12. [CSzG: Ref24985] [Google Scholar]
- Gaag M, Nieman DH, Rietdijk J, Dragt S, Ising HK, Klaassen RMC, et al. Cognitive behavioral therapy for subjects at ultrahigh risk for developing psychosis: A randomised controlled clinical trial. Schizophrenia Bulletin 2012;38(6):1180‐8. [CSzG: Ref24935] [DOI] [PMC free article] [PubMed] [Google Scholar]
- Gaag M, Nieman DH, Rietdijk J, Dragt S, Ising HK, Klaassen RMC, et al. The effects of cognitive behavioural therapy for subjects at ultra‐high risk for developing psychosis. Schizophrenia Bulletin 2013;39:S356. [CSzG: Ref28121] [Google Scholar]
- Gaag M. The prevention of psychosis in at risk mental state. www.controlled‐trials.com 2008. [CSzG: Ref17488]
- Gaag M, Nieman D, Berg D. CBT for those at risk of a first episode psychosis: Evidence‐based psychotherapy for people with an 'at risk mental state'. 1st Edition. Hove, UK: Routledge, 2013. [Google Scholar]
- Gaag M, Nieman D, Wunderink L, Klaassen R, Rietdijk J, Dragt S, et al. The results of a specific CBT intervention in young help‐seeking patients with social decline and an ultra‐high risk for developing a first episode of psychosis. Schizophrenia Research 2012;136:S17. [CSzG: Ref29692] [Google Scholar]
EDIE‐UK {published data only}
- French P, Shryane N, Bentall RP, Lewis SW, Morrison AP. Effects of cognitive therapy on the longitudinal development of psychotic experiences in people at high risk of developing psychosis. British Journal of Psychiatry. Supplements 2007;191(Suppl 51):s82‐7. [CSzG: Ref16121] [DOI] [PubMed] [Google Scholar]
- Lewis S. EDIE ‐ Early detection and intervention for psychosis. National Research Register 2001; Vol. 3. [CSzG: Ref13023]
- Lewis S. EDIE ‐ early detection and intervention for psychosis (in primary care). National Research Register 2002; Vol. 1. [CszG: Ref9342]
- Morrison A. Early detection and intervention for psychosis in primary care. National Research Register 2003. [CSzG: Ref15485]
- Morrison A. Findings from a randomised controlled trial and clinical service delivering cognitive therapy to people at ultra‐high risk of developing psychosis. Schizophrenia Research 2004;70(1):43‐4. [CSzG: Ref11526] [Google Scholar]
- Morrison A. Follow‐up of prodromal symptoms. National Research Register 2004; Vol. 3. [CSzG: Ref13036]
- Morrison A, Bentall R, French P, Kilcommons A, Lewis SW. Very early intervention in prodromal psychosis: a randomised trial. Schizophrenia Research 2002;53(3 Suppl 1):42. [CSzG: Ref8096] [Google Scholar]
- Morrison A, French P, Walford L, Lewis S, Kilcommons A, Green J, et al. A randomised controlled trial of cognitive therapy for the prevention of psychosis in people at ultra‐high risk. Schizophrenia Research 2004;67(1):7. [CSzG: Ref11324] [DOI] [PubMed] [Google Scholar]
- Morrison A, French P, Watford L, Lewis S, Kilcommons A, Green J, et al. Randomised controlled trial of cognitive therapy for the prevention of psychosis in people at ultra‐high risk. Schizophrenia Research 2004;70(1):63. [CSzG: Ref11527] [DOI] [PubMed] [Google Scholar]
- Morrison AP. Cognitive therapy for the prevention of psychosis in people at ultra‐high risk: results of a randomised controlled trial. Schizophrenia Research 2006;86(Suppl 1):S59. [CSzG: Ref13388] [DOI] [PubMed] [Google Scholar]
- Morrison AP, Bentall RP, French P, Kilcommons A, Green J, Walford L, et al. Cognitive therapy in ultra high risk individuals for psychosis: randomised controlled trial. Schizophrenia Research 2003;60:326. [CSzG: Ref9726] [Google Scholar]
- Morrison AP, Bentall RP, French P, Walford L, Kilcommons A, Knight A, et al. Randomised controlled trial of early detection and cognitive therapy for preventing transition to psychosis in high‐risk individuals. Study design and interim analysis of transition rate and psychological risk factors. British Journal of Psychiatry. Supplements 2002;181(43):s78‐84. [CSzG: Ref8737] [DOI] [PubMed] [Google Scholar]
- Morrison AP, Bentall RP, French P, Walford L, Kilcommons A, Lewis S. Early detection and intervention for psychosis in primary care. 12th World Congress of Psychiatry; 2002 Aug 24‐29; Yokohama, Japan. 2002. [CSzG: Ref8932]
- Morrison AP, French P, Parker S, Roberts M, Stevens H, Bentall RP, et al. Three‐year follow‐up of a randomised controlled trial of cognitive therapy for the prevention of psychosis in people at ultrahigh risk. Schizophrenia Bulletin 2007;33(3):682‐7. [CSzG: Ref15288] [DOI] [PMC free article] [PubMed] [Google Scholar]
- Morrison AP, French P, Walford L, Lewis SW, Kilcommons A, Green J, et al. Cognitive therapy for the prevention of psychosis in people at ultra‐high risk: randomised controlled trial. British Journal of Psychiatry 2004;185:291‐7. [CSzG: Ref11450] [DOI] [PubMed] [Google Scholar]
- Morrison T. Early detection and intervention for psychosis in primary care. National Research Register 2001; Vol. 1. [CSzG: Ref13037]
- Morrison T, Bentall R, French P, Kilcommons A, Green J, Lewis S. Early detection and intervention for psychosis in primary care. 3rd International Conference on Early Psychosis; 2002 Sep 25‐28; Copenhagen, Denmark. 2002:44. [CSzG: Ref8932]
- Renton J, Morrison A. Effectiveness of cognitive therapy for psychosis and implications for early intervention. Schizophrenia Research 2004;70(1):142. [CSzG: Ref11536] [Google Scholar]
EDIP‐USA {unpublished data only}
- McFarlane WR, Cook WL, Woodberry KA. A randomised clinical trial of familyaided assertive community treatment for young persons at high risk for onset of an initial psychosis. Schizophrenia Bulletin 2011;37:314. [CSzG: Ref22796] [Google Scholar]
- NCT01597141. Psychosis: early detection, intervention and prevention. ClinicalTrials.gov/show/NCT01597141 2012. [CSzG: Ref24315]
EIPS‐Germany {published data only}
- Bechdolf A. Preventing progression to first‐episode psychosis in people in the early initial prodromal state. Early Intervention in Psychiatry 2012;6:11. [CSzG: 24944] [Google Scholar]
- Bechdolf A, Buhler B, Berning J, Wagner M, Stamm E, Streit M. Cognitive behavioural therapy in the early initial prodromal state of psychosis: first results. Schizophrenia Research 2004;67(1):202. [CSzG: Ref11285] [Google Scholar]
- Bechdolf A, Klosterkotter J. Cognitive‐behavioural treatment (CBT) in the early initial prodromal state of psychosis: concept and practical approach. Schizophrenia Research 2004;70(1):52. [CSzG: Ref11506] [Google Scholar]
- Bechdolf A, Ruhrmann S, Janssen B, Bottlender R, Wagner M, Maurer K, et al. Early recognition and intervention for people at risk of schizophrenia [Fruherkennung und intervention bei personen mit erhohtem psychoserisiko]. Psychoneuroendocrinology 2004;30(11):606‐14. [CSzG: Ref11376] [Google Scholar]
- Bechdolf A, Ruhrmann S, Wagner M, Kuhn KU, Janssen B, Bottlender R, et al. Interventions in the initial prodromal states of psychosis in Germany: concept and recruitment. British Journal of Psychiatry. Supplements 2005;187(Suppl 48):s45‐8. [CSzG: Ref12511] [DOI] [PubMed] [Google Scholar]
- Bechdolf A, Veith V, Berning J, Stamm E, Decker P, Janssen B, et al. Cognitive behavioral therapy (CBT) in the early initial prodromal state of psychosis: first results of a randomised trial. Schizophrenia Research 2004;70(1):62‐3. [CSzG: Ref11507] [Google Scholar]
- Bechdolf A, Wagner M, Ruhrmann S, Harrigan S, Putzfeld V, Pukrop R, et al. Preventing progression to first‐episode psychosis in early initial prodromal states. British Journal of Psychiatry 2012;200(1):22‐9. [CSzG: Ref24206] [DOI] [PubMed] [Google Scholar]
- Bechdolf A, Wagner M, Ruhrmann S, Harrigan S, Veith V, Pukrop R, et al. CBT for prevention of first episode psychosis in people in an putative early initial prodromal state. Early Intervention in Psychiatry 2008;2(Suppl 1):A16. [CSzG: 19109] [Google Scholar]
- Bechdolf A, Wagner M, Veith V, Pukrop R, Berning J, Stamm E, et al. A randomised controlled trial of cognitive‐behavioral therapy in the early initial prodromal state of psychosis. 13th Biennial Winter Workshop on Schizophrenia Research; 2006 Feb 4‐10; Davos, Switzerland. Davos, Switzerland: Elsevier Science Bv, 2006:22‐3. [CSzG: 20193]
- Bechdolf A, Wagner M, Veith V, Ruhrmann R, Janssen B, Bottlender R, et al. A randomised controlled multicenter trial of cognitive behaviour therapy in the early initial prodromal state of psychosis. Schizophrenia Research 2006;86(Suppl 1):S8. [CSzG: 13369] [DOI] [PubMed] [Google Scholar]
- Bechdolf A, Wagner M, Veith V, Ruhrmann S, Pukrop R, Brockhaus‐Dumke A, et al. Randomised controlled multicentre trial of cognitive behaviour therapy in the early initial prodromal state: effects on social adjustment post treatment. Early Intervention in Psychiatry 2007;1(1):71‐8. [CSzG: 16450] [DOI] [PubMed] [Google Scholar]
- Bechdolf A, Wessels H, Wagner M, Kuhr K, Berning J, Putzfeld V, et al. Predictors of treatment response to psychosocial interventions in people at risk. European Archives of Psychiatry and Clinical Neuroscience 2015;1:S9. [CSzG: 33601] [Google Scholar]
- Hafner H, Maurer K, Ruhrmann S, Bechdolf A, Klosterkotter J, Wagner M, et al. Early detection and secondary prevention of psychosis: facts and visions. European Archives of Psychiatry and Clinical Neuroscience 2004;254(2):117‐28. [CSzG: 18539] [DOI] [PubMed] [Google Scholar]
- Kommescher M, Wagner M, Putzfeld V, Berning J, Janssen B, Decker P, et al. Coping as a predictor of treatment outcome in people at clinical high risk of psychosis. Early Intervention in Psychiatry 2016;10(1):17‐27. [CSzG: 32187] [DOI] [PubMed] [Google Scholar]
- NCT00204087. Psychological intervention for persons at risk of psychosis in the early initial prodromal state. www.ClinicalTrials.gov/ct/show/ 2005. [CSzG: 14890]
- Wessels H, Wagner M, Frommann I, Berning J, Putzfeld V, Janssen B, et al. Neuropsychological functioning as a predictor of treatment response to psychoeducational, cognitive behavioral therapy in people at clinical high risk of first episode psychosis. Psychiatrische Praxis 2015;42(6):313‐9. [CSzG: 33130] [DOI] [PubMed] [Google Scholar]
- Zarafonitis S, Wagner M, Putzfeld V, Berning J, Janssen B, Decker P, et al. Psychoeducation for persons at risk of psychosis. Psychotherapeut 2012;57(4):326‐34. [CSzG: 24807] [Google Scholar]
Kantrowitz‐USA {published data only}
- Kantrowitz JT, Woods SW, Petkova E, Cornblatt B, Corcoran CM, Chen H, et al. D‐serine for the treatment of negative symptoms in individuals at clinical high risk of schizophrenia: a pilot, double‐blind, placebo‐controlled, randomised parallel group mechanistic proof‐of‐concept trial. Lancet Psychiatry 2015;2(5):403‐12. [CSzG: 29487] [DOI] [PubMed] [Google Scholar]
- NCT00826202. D‐serine for the schizophrenia prodrome. www.ClinicalTrials.gov/ct/show/ 2009. [CSzG: 17391]
LIPS‐Germany {published data only}
- Bechdolf A, Ruhrmann S, Wagner M, Kuhn KU, Janssen B, Bottlender R, et al. Interventions in the initial prodromal states of psychosis in Germany: concept and recruitment. British Journal of Psychiatry. Supplements 2005;187(Suppl 48):s45‐8. [CSzG: 12511] [DOI] [PubMed] [Google Scholar]
- Hafner H, Maurer K, Ruhrmann S, Bechdolf A, Klosterkotter J, Wagner M, et al. Early detection and secondary prevention of psychosis: facts and visions. European Archives of Psychiatry and Clinical Neuroscience 2004;254(2):117‐28. [CSzG: 18539] [DOI] [PubMed] [Google Scholar]
- Ruhrmann S, Bechdolf A, Kuhn KU, Wagner M, Schultze‐Lutter F Janssen B, et al. Acute effects of treatment for prodromal symptoms for people putatively in a late initial prodromal state of psychosis. British Journal of Psychiatry. Supplements 2007;51:s88‐95. [CSzG: 16127] [DOI] [PubMed] [Google Scholar]
- Ruhrmann S, Hoppmann B, Theysohn S, Picker H, Kuhn K‐U, Schultze‐Lutter F, et al. Acute symptomatic treatment effects in persons clinically at risk for psychosis. Schizophrenia Research 2006;86(Suppl 1):S8. [CSzG: 13397] [Google Scholar]
- Ruhrmann S, Hoppmann B, Theysohn S, Picker H, Kuhn K‐U, Schultze‐Lutter F, et al. Intervention in the late initial prodromal state (LIPS) of psychosis. Schizophrenia Research 2006;86(Suppl 1):S96. [CSzG: 13398] [Google Scholar]
Miklowitz‐USA {published data only}
- Marvin SE, Miklowitz DJ, O'Brien MP, Cannon TD. Family‐focused therapy for individuals at clinical high risk for psychosis: treatment fidelity within a multisite randomised trial. Early Intervention in Psychiatry 2016;10(2):137‐43. [CSzG: 29018] [DOI] [PMC free article] [PubMed] [Google Scholar]
- Marvin SE, Miklowitz DJ, O'Brien MP, Cannon TD. Treatment fidelity and differentiation in a randomised controlled trial of family‐focused therapy for youth at clinical high risk of psychosis. Early Intervention in Psychiatry 2012;6:95. [CSzG: 24965] [Google Scholar]
- Miklowitz DJ, O'Brien MP, Schlosser DA, Addington J, Candan KA, Marshall C, et al. Family‐focused treatment for adolescents and young adults at high risk for psychosis: results of a randomised trial. Journal of the American Academy of Child and Adolescent Psychiatry 2014;53(8):848‐58. [CSzG: 29019] [DOI] [PMC free article] [PubMed] [Google Scholar]
- NCT01907282. Prevention trial of family focused treatment in youth at risk for psychosis. Clinicaltrials.gov/show/NCT01907282 2010. [CSzG: 27965]
- O'Brien MP, Miklowitz DJ, Candan KA, Marshall C, Domingues I, Walsh BC, et al. A randomised trial of family focused therapy with populations at clinical high risk for psychosis: effects on interactional behavior. Journal of Consulting and Clinical Psychology 2013;82(1):90‐101. [CSzG: 28565] [DOI] [PMC free article] [PubMed] [Google Scholar]
- O'Brien MP, Miklowitz DJ, Cannon TD. Decreases in perceived maternal criticism predict improvement in subthreshold psychotic symptoms in a randomised trial of family‐focused therapy for individuals at clinical high risk for psychosis. Journal of Family Psychology 2015;29(6):945–951.. [CSzG: 32212] [DOI] [PMC free article] [PubMed] [Google Scholar]
- Schlosser DA, Miklowitz DJ, O'Brien MP, Silva SD, Zinberg JL, Cannon TD. A randomised trial of family focused treatment for adolescents and young adults at risk for psychosis: study rationale, design and methods. Early Intervention in Psychiatry 2012;6(3):283‐91. [CSzG: 24491] [DOI] [PMC free article] [PubMed] [Google Scholar]
NEURAPRO‐AAE {published data only}
- ACTRN12608000475347. A comparison study of fish oil capsules and psychological therapy versus placebo capsules and psychological therapy in patients at risk of developing a psychotic disorder. Australian New Zealand Clinical Trials Registry 2009. [CSzG: 18420]
- HKCTR‐1438. The NEURAPRO‐E (North America, EURope, Australia PROdrome) Study: a multicenter RCT of omega‐3 fatty acids and cognitive‐behavioural case management for symptomatic patients at ultra‐high risk for early progression to schizophrenia and other psychotic disorders. www.hkClinicaltrials.com/trial_details.aspx?trialID=d09bd177‐b9fd‐4162‐b04f‐3ebfed49baa3 2011. [CSzG: 29270]
- McGorry P, Markulev C, Nelson B, Yuen HP, Schaefer M, Yung AR, et al. The NEURAPRO‐E study: a multicenter RCT of omega‐3 fatty acids and cognitive‐behavioural case management for patients at ultra high risk of schizophrenia and other psychotic disorders. Schizophrenia Bulletin 2015;41:S322‐3. [CSzG: 29546] [Google Scholar]
- McGorry PD, Nelson B, Markulev C, Yuen HP, Schafer MR, Mossaheb N, et al. Effect of omega‐3 polyunsaturated fatty acids in young people at ultrahigh risk for psychotic disorders: the NEURAPRO randomised clinical trial. JAMA psychiatry 2017;74(1):19‐27. [CSzG: 35590] [DOI] [PubMed] [Google Scholar]
- Nelson B, Amminger G, Markulev C, Yuen HP, Lavoie S, Schaefer M, et al. NEURAPOR: a multi‐center RCT of omega‐3 polyunsaturated fatty acids versus placebo in young people at ultra‐high risk of psychotic disorders: medium‐term outcome. Schizophrenia Bulletin 2017;43:S107. [CSzG: 36016] [DOI] [PMC free article] [PubMed] [Google Scholar]
Nordentoft‐Denmark {published data only}
- Nordentoft M, Jeppesen P, Petersen L, Thorup A, Ohlenschlaeger J, Christensen T, et al. Transition rates from schizotypal disorder to psychotic disorder for first‐contact patients included in the opus trial. A randomised clinical trial of integrated treatment and standard treatment. European Psychiatry 2007;22:S129‐S. [CSzG: 20471] [DOI] [PubMed] [Google Scholar]
- Nordentoft M, Thorup A, Petersen L, Ohlenschlaeger J, Melau M, Christensen TO, et al. Transition rates from schizotypal disorder to psychotic disorder for first‐contact patients included in the OPUS trial. A randomised clinical trial of integrated treatment and standard treatment. Schizophrenia Research 2006;83(1):29‐40. [CSzG: 13197] [DOI] [PubMed] [Google Scholar]
- Nordentoft M, Thorup A, Petersen L, Ohlenschlaeger J, Melau M, Christensen TO, et al. Transition rates from schizotypal disorder to psychotic disorder for first‐contact patients included in the opus trial. A randomised clinical trial of integrated treatment and standard treatment. Schizophrenia Research 2006;86(Suppl 1):S44. [CSzG: 13393] [DOI] [PubMed] [Google Scholar]
PACE‐Australia {published data only}
- McGorry P. Can the onset of schizophrenia be delayed or prevented?. International Journal of Neuropsychopharmacology 2002;5(Suppl 1):S26. [CSzG: 8351] [Google Scholar]
- McGorry P, Adlard S, Yung A, McDonald A, Phillips L, Hearn N. Detection and intervention in pre‐psychotic schizophrenia. Current Opinion in Psychiatry 1999;12(Suppl 1):S62. [CSzG: 4836] [Google Scholar]
- McGorry P, Yung A, Francey S, Phillips L, Nelson B. A blinded, placebo‐controlled randomised trial of low‐dose risperidone, intensive psychological treatment and befriending in young people at risk of psychotic disorder: baseline characteristics of the sample. Acta Neuropsychiatrica 2006;18(6):261. [CSzG: 35157] [DOI] [PubMed] [Google Scholar]
- McGorry PD, Hearn N, Germano D, Bravin J, Phillips LJ, Yung AR, et al. Prepsychotic intervention in schizophrenia: a stitch in time?. 152nd Annual Meeting of the American Psychiatric Association; 1999 May 15‐20; Washington DC, USA. 1999. [CSzG: 3584]
- McGorry PD, Phillips LJ, Nelson B, Leicester S, Baker K, Krstev H, et al. A double blind, placebo‐controlled randomised trial of low‐dose risperidone, cognitive‐behaviour therapy, and befriending in young people with subthreshold symptoms at incipient risk of psychotic disorder: six month outcome data. Schizophrenia Bulletin 2007;33(2):446. [CSzG: 15203] [Google Scholar]
- McGorry PD, Phillips LJ, Yung AR, Francey S, Germano D, Bravin J, et al. A randomised controlled trial of interventions in the pre psychotic phase of psychotic disorders. Schizophrenia Research 2000;41(1):9. [CSzG: 5149] [Google Scholar]
- McGorry PD, Yung AR, Phillips L, Adlard S, Hallgren M, Patton G, et al. Pre‐psychotic intervention in schizophrenia: a stitch in time?. Schizophrenia Research 1998;29(1‐2):160. [CSzG: 3585] [Google Scholar]
- McGorry PD, Yung AR, Phillips LJ, Yuen HP, Francey S, Cosgrave EM, et al. Randomised controlled trial of interventions designed to reduce the risk of progression to first‐episode psychosis in a clinical sample with subthreshold symptoms. Archives of General Psychiatry 2002;59(10):921‐8. [CSzG: 8576] [DOI] [PubMed] [Google Scholar]
- Philipps LJ, McGorry P, Yung A, Francey D, Germano F, Bravin J, et al. The development of preventive interventions for early psychosis: early findings and directions for the future. 7th World Congress of Biological Psychiatry; 2001 Jul 1‐6; Berlin, Germany. 2001; Vol. 2, issue Suppl 1. [CSzG: 7614]
- Phillips L, Cotton S, Yuen HP, Mihalopoulos C, Shih S, Kelly D, et al. Cost effectiveness of a preventive intervention for young people at ultra high risk of developing psychosis. Schizophrenia Bulletin 2007;33(2):488‐9. [CSzG: 15227] [Google Scholar]
- Phillips LJ, Cotton S, Mihalopoulos C, Shih S, Yung AR, Carter R, et al. Cost implications of specific and non‐specific treatment for young persons at ultra high risk of developing a first episode of psychosis. Early Intervention in Psychiatry 2009;3(1):28‐34. [CSzG: 18308] [DOI] [PubMed] [Google Scholar]
- Phillips LJ, Leicester SB, O'Dwyer LE, Francey SM, Koutsogiannis J, Abdel‐Baki A, et al. The PACE clinic: identification and management of young people at "ultra" high risk of psychosis. Journal of Psychiatric Practice 2002;8(5):255‐69. [CSzG: 18235] [DOI] [PubMed] [Google Scholar]
- Phillips LJ, McGorry PD, Yuen HP, Ward J, Donovan K, Kelly D, et al. Medium term follow‐up of a randomised controlled trial of interventions for young people at ultra high risk of psychosis. Schizophrenia Research 2007;96(1‐3):25‐33. [CSzG: 15544] [DOI] [PubMed] [Google Scholar]
- Phillips LJ, Yung AR, Yuen HP, Pantelis C, McGorry PD. Prediction and prevention of transition to psychosis in young people at incipient risk for schizophrenia. American Journal of Medical Genetics 2002;114(8):929‐37. [CSzG: 18236] [DOI] [PubMed] [Google Scholar]
Piskulic‐Canada {published data only}
- NCT01619319. Effects of cognitive remediation on cognition in young people at clinical high risk of psychosis. ClinicalTrials.gov/show/NCT01619319 2012. [CSzG: 24387]
- Piskulic D, Barbato M, Addington J. Cognitive remediation in young people at clinical high risk of psychosis. Early Intervention in Psychiatry 2012;6:89. [CSzG: 24973] [Google Scholar]
- Piskulic D, Barbato M, Addington J. Effects of cognitive remediation on cognition in young people at clinical high risk of psychosis. Schizophrenia Research 2012;136:S245‐6. [CSzG: 29632] [Google Scholar]
- Piskulic D, Barbato M, Liu L, Addington J. Effects of cognitive remediation on cognition in young people at clinical high risk of psychosis. Schizophrenia Research 2014;153(Suppl. 1):S218. [CSzG: 28827] [Google Scholar]
- Piskulic D, Barbato M, Liu L, Addington J. Effects of cognitive remediation therapy on cognition in young people at clinical high risk of psychosis. Early Intervention in Psychiatry 2014;8:86. [CSzG: 29633] [Google Scholar]
PRIME‐USA {published data only}
- Block JJ, McGlashon TH. Ethical concerns regarding olanzapine versus placebo in patients prodromally symptomatic for psychosis... McGlashan TH, Zipursky RB, Perkins D, Addington J, Miller T, Woods SW et al. Randomised, double‐blind trial of olanzapine versus placebo in patients prodromally symptomatic for psychosis. Am J Psychiatry 2006;163:790‐9. American Journal of Psychiatry 2006; Vol. 163, issue 10:1838. [CSzG: 13960]
- Breier AF, Zipursky RB, Perkins DO, Addington JM, Tohen MF, David SR, et al. A trial of olanzapine versus pbo in the prodrome: protocol and baseline sample. 155th Annual Meeting of the American Psychiatric Association; 2002 May 18‐23; Philadelphia, Pennsylvania, USA. 2002. [CSzG: 8951]
- Hawkins KA, Addington J, Keefe R, Christensen B, Woods S, Zipursky R, et al. Neuropsychological functioning in the first episode prodrome and early psychosis. Schizophrenia Research 2004;70(1):101. [CSzG: 11515] [Google Scholar]
- Hawkins KA, Addington J, Keefe RS, Christensen B, Woods SW, Miller TJ, et al. Effect of olanzapine versus placebo on the neuropsychological status of prodromal subjects. Schizophrenia Research 2004;67(1):205. [CSzG: Ref11301] [DOI] [PubMed] [Google Scholar]
- Hawkins KA, Addington J, Keefe RS, Christensen B, Woods SW, Zipursky RB, et al. Effect of olanzapine vs. placebo on the neuropsychological status of prodromal subjects. 12th Biennial Winter Workshop on Schizophrenia; 2004 Feb 7‐13; Davos, Switzerland. 2004. [CSzG: 16470]
- Hawkins KA, Keefe RS, Christensen BK, Addington J, Woods SW, Callahan J, et al. Neuropsychological course in the prodrome and first episode of psychosis: findings from the PRIME North America double blind treatment study. Schizophrenia Research 2008;105(1‐3):1‐9. [CSzG: 16983] [DOI] [PubMed] [Google Scholar]
- Hoffman RE, Woods S, Preda A, Tohen M, Breier A, Glist J, et al. Excessive top‐down perceptual processing and reduced real‐world investment exhibited by prodromal patients predict subsequent conversion to schizophrenia. Schizophrenia Research 2006;86(Suppl 1):S46. [CSzG: 13377] [Google Scholar]
- Hoffman RE, Woods SW, Hawkins KA, Pittman B, Tohen M, Preda A, et al. Extracting spurious messages from noise and risk of schizophrenia‐spectrum disorders in prodromal population. British Journal of Psychiatry 2007;191(2):355‐6. [CSzG: 16068] [DOI] [PubMed] [Google Scholar]
- McGlashan T, Zipursky R, Perkins D, Addington J. Olanzapine for treatment of the schizophrenia prodrome: 2‐year results of a randomised placebo‐controlled study. Schizophrenia Research 2004;67(1):164. [CSzG: 11320] [Google Scholar]
- McGlashan TH. Intervention in the prodrome to first psychosis. 2nd International Conference on Early Psychosis; 2000 Mar 31 ‐ Apr 2; New York, New York, USA. 2000. [CSzG: 10191]
- McGlashan TH. Treatment intervention in the New Haven PRIME clinic prodromal sample. Current Opinion in Psychiatry 1999;12(Suppl 1):S62. [CSzG: 4835] [Google Scholar]
- McGlashan TH, Miller TJ, Woods SW. Psychosis treatment prior to psychosis onset: ethical issues. Schizophrenia Research 2002;53(3 Suppl 1):15. [CSzG: 8093] [DOI] [PubMed] [Google Scholar]
- McGlashan TH, Miller TJ, Woods SW, Rosen J, Davidson L, Preda A, et al. Ethical issues in the pre‐onset treatment of schizophrenia. 154th Annual Meeting of the American Psychiatric Association; 2001 May 5‐10; New Orleans, Louisiana, USA. Marathon Multimedia, 2001. [CSzG: 8018]
- McGlashan TH, Miller TJ, Woods SW, Rosen J, Davidson L, Preda A, et al. Ethical issues in the pre‐onset treatment of schizophrenia. 155th Annual Meeting of the American Psychiatric Association; 2002 May 18‐23; Philadelphia, Pennsylvania, USA. 2002. [CSzG: 9005]
- McGlashan TH, Miller TJ, Zipursky RB, Woods SW, Perkins DO, Hawkins KA, et al. Intervention in the schizophrenic prodrome: the prevention through risk identification, management, and education initiative. 156th Annual Meeting of the American Psychiatric Association; 2003 May 17‐22; San Francisco, California, USA. 2003. [CSzG: 9803]
- McGlashan TH, Vaglum P, Friis S, Johannessen JO, Simonsen E, Larsen TK, et al. Early detection and intervention in first episode psychosis: empirical update of the tips and prime projects. Schizophrenia Bulletin 2005;31:496. [CSzG: 11622] [Google Scholar]
- McGlashan TH, Vaglum P, Friis S, Johannessen JO, Simonsen E, Larsen TK, et al. Early detection and intervention in first episode psychosis: empirical update of the tips and prime projects. Schizophrenia Bulletin 2005;31:496. [CSzG: 11622] [Google Scholar]
- McGlashan TH, Vaglum P, Friis S, Johannessen JO, Simonsen E, Larsen TK, et al. Early detection and intervention in first episode psychosis: empirical update of the tips and prime projects. Schizophrenia Bulletin 2005;31:496. [CSzG: 11622] [Google Scholar]
- McGlashan TH, Zipursky RB, Perkins D, Addington J, Miller T, Woods SW, et al. Randomised, double‐blind trial of olanzapine versus placebo in patients prodromally symptomatic for psychosis. American Journal of Psychiatry 2006;163(5):790‐9. [CSzG: 12654] [DOI] [PubMed] [Google Scholar]
- McGlashan TH, Zipursky RB, Perkins D, Addington J, Miller TJ, Woods SW, et al. The PRIME North America randomised double‐blind clinical trial of olanzapine versus placebo in patients at risk of being prodromally symptomatic for psychosis. I. Study rationale and design. Schizophrenia Research 2003;61(1):7‐18. [CSzG: 9828] [DOI] [PubMed] [Google Scholar]
- McGlashan TH, Zipursky RB, Perkins DO, Addington J, Woods SW, Miller TJ, et al. Olanzapine versus placebo treatment of the schizophrenia prodrome: one year results. Schizophrenia Research 2003;60:295. [CSzG: 9722] [Google Scholar]
- McGlashan TH, Zipursky RB, Perkins DO, Addington JM, Woods SW, Lindborg S, et al. Olanzapine versus pbo for the schizophrenic prodrome: one‐year results. 156th Annual Meeting of the American Psychiatric Association; 2003 May 17‐22; San Francisco, California, USA. 2003. [CSzG: 9804]
- McGlashlan TH, Zipursky RB, Perkins DO, Addington J, Miller TH, Woods SW, et al. A prodromal trial of olanzapine versus placebo baseline results. 3rd International Conference on Early Psychosis; 2002 Sep 25‐28; Copenhagen, Denmark. 2002:42. [CSzG: 8934]
- Mcglashan T, Zipursky R, Perkins D, Addington J, Miller T, Woods S, et al. Pharmacotherapy in the prodromal phase of first psychosis: results and implications. Schizophrenia Research 2004;70(1):6. [CSzG: 11524] [Google Scholar]
- Mcglashan T, Zipursky R, Perkins D, Addington J, Woods S, Miller T, et al. Olanzapine vs. placebo for prodromal schizophrenia. Schizophrenia Research 2004;67(1):6. [CSzG: 11321] [Google Scholar]
- Miller TJ, Zipursky RB, Perkins D, Addington J, Woods SW, Hawkins KA, et al. The PRIME North America randomised double‐blind clinical trial of olanzapine versus placebo in patients at risk of being prodromally symptomatic for psychosis. II. Baseline characteristics of the "prodromal" sample. Schizophrenia Research 2003;61(1):19‐30. [CSzG: 9829] [DOI] [PubMed] [Google Scholar]
- Rosen JL, Woods SW, Miller TJ, McGlashan TH. Prospective observations of emerging psychosis. Journal of Nervous and Mental Disease 2002;190:133‐41. [CSzG: 8274] [DOI] [PubMed] [Google Scholar]
- Taylor HE, Parker S, Mansell W, Morrison AP. Effects of appraisals of anomalous experience on distress in people at risk of psychosis. Behavioural and Cognitive Psychotherapy 2012;41(1):24‐33. [CSzG: 24374] [DOI] [PubMed] [Google Scholar]
- Woods S, Zipursky R, Perkins D, Addington J, Marquez E, Breier A, et al. Olanzapine versus placebo for prodromal symptoms. 3rd International Conference on Early Psychosis; 2002 Sep 25‐28; Copenhagen, Denmark. 2002:43. [CSzG: 8933]
- Woods SW. Randomised trial of olanzapine versus placebo in the symptomatic acute treatment of the schizophrenic prodrome. Biological Psychiatry 2003;54(4):497. [CSzG: 19829] [DOI] [PubMed] [Google Scholar]
- Woods SW, Breier A, Zipursky RB, Perkins DO, Addington J, Miller TJ, et al. Olanzapine versus placebo for prodromal symptoms. Schizophrenia Research. 2003. [CSzG: 9978]
- Woods SW, Breier A, Zipursky RB, Perkins DO, Addington J, Miller TJ, et al. Olanzapine versus placebo for prodromal symptoms. Schizophrenia Research 2003;60:306‐7. [CSzG: 9752] [DOI] [PubMed] [Google Scholar]
- Woods SW, Breier A, Zipursky RB, Perkins DO, Addington J, Miller TJ, et al. Randomised trial of olanzapine versus placebo in the symptomatic acute treatment of the schizophrenic prodrome. Biological Psychiatry 2003;54(4):453‐64. [CSzG: 9994] [DOI] [PubMed] [Google Scholar]
- Woods SW, McGlashan TH. Sample size planning for prodromal intervention trials. Schizophrenia Research 2002;53(3 Suppl 1):40. [CSzG: 8116] [Google Scholar]
- Woods SW, Zipursky RB, Perkins DO, Addington JM, Miller TJ, Breier AF, et al. Olanzapine versus placebo for prodromal symptoms. 155th Annual Meeting of the American Psychiatric Association; 2002 May 18‐23; Philadelphia, Pennsylvania, USA. 2002. [CSzG: 9053]
Vinogradov‐USA {published data only}
- Loewy R, Fisher M, Mathalon DH, Vinogradov S. Interim analyses of a randomised controlled trial of computerised cognitive training in clinical high risk for psychosis. Schizophrenia Bulletin 2013;39:S238‐9. [CSzG: 28151] [Google Scholar]
- Loewy R, Fisher M, Schlosser DA, Biagianti B, Stuart B, Mathalon DH, et al. Intensive auditory cognitive training improves verbal memory in adolescents and young adults at clinical high risk for psychosis. Schizophrenia Bulletin 2016;42(Suppl 1):S118‐26. [CSzG: 35221] [DOI] [PMC free article] [PubMed] [Google Scholar]
- Vinogradov S, Loewy R, Fisher M, Lee A, Niendam T, Ragland JD, et al. Neuroplasticity‐based cognitive training in ultra‐high risk adolescents and recent onset patients with schizophrenia. Schizophrenia Research 2012;136:S30. [CSzG: 29703] [Google Scholar]
Woods‐1‐USA {published data only}
- NCT00291226. Glycine vs Placebo for the Schizophrenia Prodrome. www.ClinicalTrials.gov/ct/show/ 2006. [CSzG: 14759]
- Woods S, Walsh B, Hawkins K, Miller T, Saksa J, D'Souza D, et al. Glycine treatment of the risk syndrome for psychosis: Report of two pilot studies. Early Intervention in Psychiatry 2012;6:29. [CSzG: 24987] [Google Scholar]
- Woods SW, Kantrowitz JT, Javitt DC. NMDAR‐based treatments for patients at clinical high risk for psychosis. Biological Psychiatry 2014;1:11S. [CSzG: 29041] [Google Scholar]
- Woods SW, Walsh BC, Hawkins KA, Miller TJ, Saksa JR, D'Souza DC, et al. Glycine treatment of the risk syndrome for psychosis: report of two pilot studies. European Neuropsychopharmacology 2013;23(8):931‐40. [CSzG: 28750] [DOI] [PMC free article] [PubMed] [Google Scholar]
Yung‐Australia {published data only}
- McGorry P. Second generation intervention research in the pre‐psychotic phase of illness in schizophrenia and related psychoses. Australian New Zealand Clinical Trials Registry 2000. [CSzG: 18439]
- McGorry PD, Nelson B, Phillips LJ, Yuen HP, Francey S, Thampi A, et al. Randomised controlled trial of interventions for young people at ultra‐high risk of psychosis: 12‐month outcome. Schizophrenia Research 2012;136:S17‐8. [CSzG: 29547] [Google Scholar]
- McGorry PD, Nelson B, Phillips LJ, Yuen HP, Francey SM, Thampi A, et al. Randomised controlled trial of interventions for young people at ultra‐high risk of psychosis: twelve‐month outcome. Journal of Clinical Psychiatry 2013;74(4):349‐56. [CSzG: 28737] [DOI] [PubMed] [Google Scholar]
- Nelson B, Phillips LJ, Yung AR, Francey SM, Leicester S, Baker K, et al. A double blind, placebo‐controlled randomised trial of low‐dose risperidone, intensive psychological treatment and supportive therapy in young people with subthreshold symptoms at incipient risk of psychotic disorder: baseline characteristics of the sample. Schizophrenia Bulletin 2007;33(2):450. [CSzG: 15212] [Google Scholar]
- Phillips LJ, Nelson B, Yuen HP, Francey SM, Simmons M, Stanford C, et al. Randomised controlled trial of interventions for young people at ultra‐high risk of psychosis: study design and baseline characteristics. Australian and New Zealand Journal of Psychiatry 2009;;43(9):818–29. [DOI] [PubMed] [Google Scholar]
- Yung A, Amminger P, Berger G, Thompsom A, Phillips L, Nelson B, et al. Randomised controlled trial of antipsychotic and cognitive therapy in young people at ultra‐high risk of psychosis. Early Intervention in Psychiatry 2012;6:11. [CSzG: 24989] [Google Scholar]
- Yung A, Nelson B, Phillips L, Francey S, Leicester S, Yuen H, et al. A double blind, placebo‐controlled randomised trial of low‐dose risperidone, cognitive‐behaviour therapy, and supportive therapy in young people at ultra high risk of psychotic disorder: 12 month outcome data. Early Intervention in Psychiatry 2008;2(Suppl 1):A12. [CSzG: 19138] [Google Scholar]
- Yung AR, Phillips LJ, Nelson B, Francey SM, Yuen HP, Simmons MB, et al. Randomised controlled trial of interventions for young people at ultra high risk for psychosis: 6‐month analysis. Journal of Clinical Psychiatry 2011;72(4):430‐40. [CSzG: 22929] [DOI] [PubMed] [Google Scholar]
References to studies excluded from this review
Berger‐Australia {published data only}
- Berger G. Lithium in patients at ultra high risk of developing a first psychotic episode. Stanley Foundation Research Programs 2006.
- Berger GE, Wood SJ, Ross M, Hamer CA, Wellard RM, Pell G, et al. Neuroprotective effects of low‐dose lithium in individuals at ultra‐high risk for psychosis. A longitudinal MRI/MRS study. Current Pharmaceutical Design 2012;18:570‐5. [DOI] [PubMed] [Google Scholar]
Berry‐USA {published data only}
- Berry K, Gregg L, Lobban F, Barrowclough C. Therapeutic alliance in psychological therapy for people with recent onset psychosis who use cannabis. Comprehensive Psychiatry 2016;67:73‐80. [DOI] [PubMed] [Google Scholar]
Biagianti‐USA {published data only}
- Biagianti B, Roach BJ, Fisher M, Loewy R, Ford JM, Vinogradov S, et al. Trait aspects of auditory mismatch negativity predict response to auditory training in individuals with early illness schizophrenia. Neuropsychiatric Electrophysiology 2017;3:2. [DOI] [PMC free article] [PubMed] [Google Scholar]
Capra‐Australia {published data only}
- ACTRN12612000963820. An evaluation of the effectiveness of an internet‐based treatment program for psychotic like experiences. www.anzctr.org.au/ACTRN12612000963820.aspx 2012.
CHANGSHA‐USA {published data only}
- Stone WS, Hsi X, Giuliano AJ, Seidman LJ, Tsuang MT. Validation of a liability syndrome for schizophrenia ('schizotaxia') and effects of low dose risperidone on neurocognitive, clinical and social functioning: results from the Changsha study. European Psychiatry 2011;26(Suppl 1):1508. [Google Scholar]
- Stone WS, Hsi X, Giuliano AJ, Tan L, Zhu S, Li L, et al. Are neurocognitive, clinical and social dysfunctions in schizotaxia reversible pharmacologically? Results from the Changsha study. Asian Journal of Psychiatry 2012;5(1):73‐82. [DOI] [PMC free article] [PubMed] [Google Scholar]
Chien‐Hong Kong {published data only}
- Chien WT, Yip AL, Liu JY, McMaster TW. The effectiveness of manual‐guided, problem‐solving‐based self‐learning programme for family caregivers of people with recent‐onset psychosis: a randomised controlled trial with 6‐month follow‐up. International Journal of Nursing Studies 2016;59:141‐55. [DOI] [PubMed] [Google Scholar]
Cordes‐Germany {published data only}
- Cordes J, Kahl K, Janner M, Muller H, Wagner M, Maier W, et al. Prevalence of the metabolic syndrome in men and women at risk of psychosis. European Archives of Psychiatry and Clinical Neuroscience 2011;261:S33. [Google Scholar]
- NCT00169702. The effect of a weight management program to prevent weight gain and metabolic abnormalities during treatment with the atypical neuroleptic olanzapine: a randomised study. www.ClinicalTrials.gov/ct/show/ 2005.
EDIPP‐USA {published data only}
- Anonymous. Re: McFarlane, W. R., et al: clinical and functional outcomes after 2 years in the early detection and intervention for the prevention of psychosis multisite effectiveness trial. Schizophr Bull. 2015 Jan;41(1):30‐43. Schizophrenia Bulletin 2015;41(2):532. [DOI] [PMC free article] [PubMed] [Google Scholar]
- McFarlane WR, Levin B, Travis L, Lucas FL, Lynch S, Verdi M, et al. Clinical and functional outcomes after 2 years in the early detection and intervention for the prevention of psychosis multisite effectiveness trial. Schizophrenia Bulletin 2015;41(1):30‐43. [DOI] [PMC free article] [PubMed] [Google Scholar]
- NCT00531518. Early detection and intervention for the prevention of psychosis, a multisite study. www.ClinicalTrials.gov/ct/show/ 2007.
EPIP‐Singapoure {published data only}
- Chong S. Translational and clinical research programme in psychosis. Early Intervention in Psychiatry 2008;2(Suppl 1):A130. [DOI] [PubMed] [Google Scholar]
Heresco‐Levy‐Israel {published data only}
- NCT00276263. Sarcosine (n‐methylglycine) trial for individuals at risk for developing schizophrenia and related disorders. www.ClinicalTrials.gov/ct/show/ 2006.
Holzer‐Switzerland {published data only}
- Holzer L, Urben S, Passini CM, Jaugey L, Herzog MH, Halfon O, et al. A randomised controlled trial of the effectiveness of computer‐assisted cognitive remediation (CACR) in adolescents with psychosis or at high risk of psychosis. Behavioural and Cognitive Psychotherapy 2014;42(4):421‐34. [DOI] [PubMed] [Google Scholar]
- Holzer L, Urben S, Pihet S, Jaugey L. A randomised controlled trial of the effectiveness of a computer‐assisted cognitive remediation (CACR) program in adolescents with psychosis or at high risk of psychosis: short‐term and long‐term outcomes. Neuropsychiatrie de L'Enfance et de L'Adolescence 2012;60(5 Suppl):S71. [Google Scholar]
- Jaugey L, Urben S, Pihet S, Halfon O, Holzer L. Short‐and long‐term outcomes of a randomised controlled trial of a computer‐assisted cognitive remediation (CACR) program in adolescents with psychosis or at high risk of psychosis. Biological Psychiatry 2012;8(Suppl 1):84S. [Google Scholar]
- Torrisi R, Holzer L, Pihet S, Suter S, Aeberhard A, Pellanda V, et al. Computer‐assisted cognitive remediation program for adolescents at high risk of psychosis or with psychotic disorders: preliminary results. 15th Biennial Winter Workshop in Psychoses; 2009 Nov 15‐18; Barcelona, Spain. 2009.
- Urben S, Pihet S, Jaugey L, Halfon O, Holzer L. A randomised controlled trial of the effectiveness of a computer‐assisted cognitive remediation (CACR) program in adolescents with psychosis or at high risk of psychosis: short term and long term outcomes. Early Intervention in Psychiatry 2012;6:41. [Google Scholar]
- Urben S, Pihet S, Jaugey L, Halfon O, Holzer L. Computer‐assisted cognitive remediation in adolescents with psychosis or at risk for psychosis: a 6‐month follow‐up. Acta Neuropsychiatrica 2012;24(6):328‐35. [DOI] [PubMed] [Google Scholar]
Keri‐Hungary {published data only}
- Keri S, Kelemen O, Janka Z. Therapy of mental states at high risk for psychosis: preliminary results from Hungary [A psychosis szempontjából nagy kockázatú mentális állapotok és kezelésük: első hazai eredmények]. Orvosi Hetilap 2006;147(5):201‐4. [PubMed] [Google Scholar]
Koren‐Israel {published data only}
- Koren D, Radin S, Libas Y. "Attenuated psychosis syndrome" versus "endangered realitytesting syndrome": a community‐based experimental vignette study of their effect on stigma, hope and help‐seeking. Early Intervention in Psychiatry 2014;8:136. [Google Scholar]
LEGS‐USA {published data only}
- ISRCTN70185866. LEGS cluster randomised trial: liaison with education and general practices to detect and refine referrals of people with at‐risk‐mental‐states (ARMS). isrctn.org/ISRCTN70185866 2010.
- Jones P. LEGS cluster randomised trial: liaison with education and general practices to detect and refine referrals of people with at‐risk‐mental‐states (ARMS). National Institute for Health Research 2009.
- Perez J, Jin H, Russo DA, Stochl J, Painter M, Shelley G, et al. Clinical effectiveness and cost‐effectiveness of tailored intensive liaison between primary and secondary care to identify individuals at risk of a first psychotic illness (the LEGs study): a cluster‐randomised controlled trial. Lancet Psychiatry 2015;2(1):984‐93. [DOI] [PMC free article] [PubMed] [Google Scholar]
- Perez J, Russo D, Jin H, Stochl J, Painter M, Graffy J, et al. Liaison with primary care to detect individuals at clinical high risk for psychosis: the LEGS CRCT. Schizophrenia Bulletin 2015;41:S130. [Google Scholar]
- Perez J, Russo DA, Stochl J, Byford S, Zimbron J, Graffy JP, et al. Comparison of high and low intensity contact between secondary and primary care to detect people at ultra‐high risk for psychosis: study protocol for a theory‐based, cluster randomised controlled trial. Trials 2013;14:222. [DOI] [PMC free article] [PubMed] [Google Scholar]
LEO CAT‐UK {published data only}
- Power P, Craig T, Mcguire P, Iacoponi E, Garety P, Russell M. A randomised controlled trial of an early detection team in first episode psychosis: the LEO CAT trial. Schizophrenia Research 2004;67(1):36. [Google Scholar]
- Power P, Iacoponi E, Russell M, Fisher H, Mcguire P, Garety P, et al. A randomised controlled trial of an early detection team in first‐episode psychosis: provisional findings of the LEO CAT study. Schizophrenia Research 2004;70(1):131. [Google Scholar]
- Power P, Monteiro E, Pobee I, Burnside A, Pugh C, Reynolds N, et al. 18 months outcome of first episode psychosis patients attending the LEO service in south London. Early Intervention in Psychiatry 2008;2(Suppl 1):A6. [Google Scholar]
LEO‐UK {published data only}
- Craig T, Garety P, Power P, Rahaman N, Colbert S, Fornells‐Ambrojo M. Lambeth early onset service: a randomised controlled trial. Schizophrenia Research 2004;70(1):145‐6. [DOI] [PMC free article] [PubMed] [Google Scholar]
- Craig TK. Brixton early psychosis project. National Research Register 2000.
- Craig TK, Garety P, Power P, Rahaman N, Colbert S, Fornells‐Ambrojo M, et al. The Lambeth Early Onset (LEO) Team: randomised controlled trial of the effectiveness of specialised care for early psychosis. BMJ 2004;329(7474):1067‐70. [DOI] [PMC free article] [PubMed] [Google Scholar]
- Garety PA, Craig TK, Dunn G, Fornells‐Ambrojo M, Colbert S, Rahaman N, et al. Specialised care for early psychosis: symptoms, social functioning and patient satisfaction: randomised controlled trial. British Journal of Psychiatry 2006;188(1):37‐45. [DOI] [PubMed] [Google Scholar]
- Garety PA, Craig TK, Dunn G, Fornells‐Ambrojo M, Colbert S, Rahaman N, et al. Specialised care for early psychosis: symptoms, social functioning and patient satisfaction: randomised controlled trial: corrigenda. British Journal of Psychiatry 2006;188(3):295. [DOI] [PubMed] [Google Scholar]
- Power P, Craig T, Garety P, Rahaman N, Colbert S, Fornells‐Ambrojo M. Lambeth early onset (LEO) trial: a randomised controlled trial of assertive community follow‐up in early psychosis: initial 6 month data. Unknown Source. 1994.
- Power P, Iacoponi E, Reynolds N, Fisher H, Russell M, Garety P, et al. The Lambeth Early Onset Crisis Assessment Team Study: general practitioner education and access to an early detection team in first‐episode psychosis. British Journal of Psychiatry. Supplements 2007;51:s133‐9. [DOI] [PubMed] [Google Scholar]
- Power P, McGuire P, Iacoponi E, Garety P, Morris E, Valmaggia L, et al. Lambeth early onset (LEO) and outreach & support in South London (OASIS) service. Early Intervention in Psychiatry 2007;1(1):97‐103. [DOI] [PubMed] [Google Scholar]
- Tempier R, Balbuena L, Lepnurm M, Craig TK. Perceived emotional support in remission: results from an 18‐month follow‐up of patients with early episode psychosis. Social Psychiatry and Psychiatric Epidemiology 2013;48(12):1897‐904. [DOI] [PubMed] [Google Scholar]
Leweke‐Germany {published data only}
- DRKS00011151. Enhancing recovery in early schizophrenia a multi‐center, two‐arm, double‐blind, randomised clinical trial investigating cannabidiol vs. placebo as an add‐on to an individualised antipsychotic treatment using either amisulpride or quetiapine. apps.who.int/trialsearch/Trial2.aspx?TrialID=DRKS00011151 2016. [http://www.drks.de/DRKS00011151]
Lewis‐USA {published data only}
- Lewis L, Unkefer EP, O'Neal SK, Crith CJ, Fultz J. Cognitive rehabilitation with patients having persistent, severe psychiatric disabilities. Psychiatric Rehabilitation Journal 2003;26(4):325‐31. [DOI] [PubMed] [Google Scholar]
NEURAPRO‐Q‐Australia {published data only}
- McGorry P, Amminger P. A comparison study of quetiapine medication and psychological therapy versus placebo tablets and psychological therapy in patients who are deemed at risk of developing a psychotic disorder. Australian New Zealand Clinical Trials Registry 2010.
O'Neill‐UK {published data only}
- O'Neill A, Wilson R, Appiah‐Kusi E, Bossong M, McGuire P, Bhattacharyya S. Effects of cannabidiol on mediotemporal and dorsostriatal activity during encoding and recall, in the at‐risk mental state for psychosis. Schizophrenia Bulletin 2017;43:S187. [Google Scholar]
OPUS‐Denmark {published data only}
- Albert N, Jensen H, Melau M, Hjorthoj C, Nordentoft M. How long should a specialised assertive early intervention program last?. Early Intervention in Psychiatry 2014;8:10. [Google Scholar]
- Bertelsen M, Jeppesen P, Petersen L, Thorup A, Ohlenschlaeger J, Quach P, et al. Course of illness in a sample of 265 patients with first‐episode psychosis ‐ five‐year follow‐up of the Danish OPUS trial. Schizophrenia Research 2009;107(2‐3):173‐8. [DOI] [PubMed] [Google Scholar]
- Bertelsen M, Jeppesen P, Petersen L, Thorup A, Ohlenschlaeger J, Quach P, et al. First episode of psychosis intensive early intervention programme versus standard treatment ‐ secondary publication. Ugeskrift for Laeger 2009;171(41):2992‐5. [PubMed] [Google Scholar]
- Bertelsen M, Jeppesen P, Petersen L, Thorup A, Ohlenschlaeger J, Quach P, et al. Five‐year follow‐up of a randomised multicenter trial of intensive early intervention vs standard treatment for patients with a first episode of psychotic illness: the OPUS trial. Archives of General Psychiatry 2008;65(7):762‐71. [DOI] [PubMed] [Google Scholar]
- Bertelsen M, Jeppesen P, Petersen L, Thorup A, Ohlenschlaeger J, Quach P, et al. Suicidal behaviour and mortality in first‐episode psychosis: the OPUS trial. British Journal of Psychiatry. Supplements 2007;191(Suppl 51):s140‐6. [DOI] [PubMed] [Google Scholar]
- Ellersgaard D, Mors O, Thorup A, Jorgensen P, Jeppesen P, Nordentoft M. A prospective study of the course of delusional themes in first episode non‐affective psychosis. Early Intervention in Psychiatry 2012;6:67. [DOI] [PubMed] [Google Scholar]
- Ellersgaard D, Mors O, Thorup A, Jorgensen P, Jeppesen P, Nordentoft M. Prospective study of the course of delusional themes in first‐episode non‐affective psychosis. Early Intervention in Psychiatry 2014;8(4):340‐7. [DOI] [PubMed] [Google Scholar]
- Hastrup LH, Kronborg C, Bertelsen M, Jeppesen P, Jorgensen P, Petersen L, et al. Cost‐effectiveness of early intervention in first‐episode psychosis: economic evaluation of a randomised controlled trial (the opus study). British Journal of Psychiatry 2013;202(1):35‐41. [DOI] [PubMed] [Google Scholar]
- Hastrup LH, Kronborg C, Nordentoft M, Simonsen E. Cost‐effectiveness of a randomised multicenter trial in first‐episode psychosis (OPUS) in Denmark. Journal of Mental Health Policy and Economics 2011;14:S10. [Google Scholar]
- Jeppesen P, Abel MB, Krarup G, Jorgensen P, Nordentoft M. Family burden and expressed emotion in first episode psychosis. The OPUS‐trial. 3rd International Conference on Early Psychosis; 2002 Sep 25‐28; Copenhagen, Denmark. 2002:59.
- Jeppesen P, Hemmingsen R, Jírgensen P, Reisby N, Abel M‐B, Nordentoft M. OPUS project: impact of mental disorder on caregivers. 11th World Congress of Psychiatry; 1999 Aug 6‐11; Hamburg, Germany 1999;2:157. [Google Scholar]
- Jeppesen P, Hemmingsen R, Reisby N, Jørgensen P, Nordentoft M, Abel M‐B. The impact of mental disorder on caregivers. 11th World Congress of Psychiatry; 1999 Aug 6‐11; Hamburg, Germany 1999;2:187. [Google Scholar]
- Jeppesen P, Nordentoft M, Abel M, Hemmingsen RP, Joergensen, Kassow P. OPUS‐project: a RCT of integrated psychiatric treatment for recent onset psychotic patients. Schizophrenia Research 2001;49(1‐2):262. [Google Scholar]
- Jeppesen P, Petersen L, Thorup A, Abel M‐B, Oehlenschlaeger J, Christensen TO, et al. Integrated treatment of first‐episode psychosis: effect of treatment on family burden: OPUS trial. British Journal of Psychiatry 2005;48(Suppl):s85‐90. [DOI] [PubMed] [Google Scholar]
- Jeppesen P, Petersen L, Thorup A, Abel M‐B, Ohlenschlaeger J, Christensen TO, et al. The association between pre‐morbid adjustment, duration of untreated psychosis and outcome in first‐episode psychosis. Psychological Medicine 2008;38(8):1157‐66. [DOI] [PubMed] [Google Scholar]
- Jørgensen P, Jeppesen P, Abel MB, Kassow P, Krarup G, Hemmingsen R, et al. Early intervention in schizophrenia. Nordic Journal of Psychiatry 2002;56(2):8. [Google Scholar]
- Jørgensen P, Nordentoft M, Abel MB, Gouliaev G, Jeppesen P, Kassow P. Early detection and assertive community treatment of young psychotics: the OPUS study rationale and design of the trial. Social Psychiatry and Psychiatric Epidemiology 2000;35(7):283‐7. [DOI] [PubMed] [Google Scholar]
- Nordentoft M, Bertelsen M, Jeppesen P, Thorup A, Petersen L, Ohlenschlaeger J, et al. OPUS trial: a randomised multicentre trial of integrated versus standard treatment for patients with a first episode of psychotic illness. Nordic Journal of Psychiatry 2007;61(6):488. [Google Scholar]
- Nordentoft M, Bertelsen M, Thorup A, Jeppesen P, Petersen L. The OPUS‐trial; a randomised multi‐centre trial of integrated versus standard treatment for patients with a first episode of psychotic illness‐five‐years follow‐up. 12th International Congress on Schizophrenia Research; 2009 Mar 28‐Apr 1; San Diego, CA. San Diego, CA, USA: Oxford Univ Press, 2009:370.
- Nordentoft M, Jeppesen P, Abel M, Kassow P, Petersen L, Thorup A, et al. OPUS study: suicidal behaviour, suicidal ideation and hopelessness among patients with first‐episode psychosis. One‐year follow‐up of a randomised controlled trial. British Journal of Psychiatry. Supplements 2002;181(Suppl 43):S98‐106. [DOI] [PubMed] [Google Scholar]
- Nordentoft M, Jeppesen P, Abel M, Petersen L, Thorup A, Christensen T, et al. Opus‐project: a randomised controlled trial of integrated psychiatric treatment in first‐episode psychosis ‐ clinical outcome improved. Proceedings of the 3rd International Conference on Early Psychosis; 2002 Sep 25‐28; Copenhagen, Denmark. 2002:56.
- Nordentoft M, Jeppesen P, Abel MB, Hemmingsen R, Reisby N. Can duration of untreated psychosis be shortened and does optimal treatment program improve outcome? A randomised controlled study. Nordisk Psykiatrisk Tidsskrift 1998;52(41):76. [Google Scholar]
- Nordentoft M, Jeppesen P, Jorgensen P, Abel M, Kassow P, Reisby N, et al. OPUS‐project: a randomised controlled trial of first episode psychotic patients: better compliance. Schizophrenia Research 2000;41(1):B145. [Google Scholar]
- Nordentoft M, Jeppesen P, Jørgensen P, Abel MB, Kassow P, Reisby N, et al. OPUS ‐ project: a randomised controlled trial of first episode psychotic patients better compliance. 2nd International Conference on Early Psychosis; 2000 Mar 31 ‐ Apr 2; New York, New York, USA. 2000.
- Nordentoft M, Jeppesen P, Kassow P, Abel M, Petersen L, Thorup A, et al. OPUS‐project: a randomised controlled trial of integrated psychiatric treatment in first‐episode psychosis‐clinical outcome improved. Schizophrenia Research 2002;53(3 Suppl 1):51. [Google Scholar]
- Nordentoft M, Jeppesen P, Kassow P, et al. OPUS project: a randomised controlled trial of integrated psychiatric treatment in first episode psychosis ‐ clinical outcome improved. Schizophrenia Research 2002;53(Suppl. 1):51. [Google Scholar]
- Nordentoft M, Jeppesen P, Petersen L, Thorup A, Abel M, Ohlenschlaeger JK, et al. OPUS project: a randomised controlled trial of integrated psychiatric treatment in first episode psychosis. Schizophrenia Research 2003;60:297. [Google Scholar]
- Nordentoft M, Jeppesen P, Petersen L, Thorup A, Jorgensen P. Duration of untreated psychosis predicts psychotic symptoms but not negative symptoms. Schizophrenia Bulletin 2005;31:234. [Google Scholar]
- Nordentoft M, Jeppesen P, Petersen L, Thorup A, Ohlenschlaeger J, Christensen T, et al. The OPUS trial: a randomised multi‐centre trial of integrated versus standard treatment for 547 first‐episode psychotic patients. 12th Biennial Winter Workshop on Schizophrenia; 2004 Feb 7‐13; Davos, Switzerland. 2004.
- Nordentoft M, Jeppesen P, Petersen L, Thorup a, Krarup G, Abel M, et al. The Danish OPUS‐trial: a randomised controlled trial of integrated treatment among 547 first‐episode psychotic patients. One and two years follow‐up. Schizophrenia Research 2004;67(1):35‐6. [Google Scholar]
- Nordentoft M, Jeppesen P, Ventegodt AT, Joergensen P, Abel M, Petersen L, et al. OPUS‐project: a randomised controlled trial of first episode psychotic patients: patient satisfaction, depression and suicidal behaviour. Schizophrenia Research 2001;49(1‐2):265. [Google Scholar]
- Nordentoft M, Jorgensen P, Jeppesen P, Kassow P, Abel MB, Resiby N, et al. OPUS‐project: differences in clinical and social outcome of a randomised controlled trial of integrated care of first‐episode psychotic patients. Schizophrenia Research 1999;36(1‐3):330. [Google Scholar]
- Nordentoft M, Melau M, Iversen T, Petersen L, Jeppesen P, Thorup A, et al. From research to practice: How OPUS treatment was accepted and implemented throughout Denmark. Early Intervention in Psychiatry 2015;9(2):156‐62. [DOI] [PubMed] [Google Scholar]
- Nordentoft M, Melau M, Jeppesen P, Petersen L, Thorup A, Ohlenschlager J, et al. The OPUS‐trial; a randomised single‐blinded trial of integrated versus standard treatment for patients with a first episode of psychotic illness ‐ results of five‐years follow‐up and presentation of a new trial. Schizophrenia Research 2010;117(2‐3):116. [Google Scholar]
- Nordentoft M, Ohlenschlaeger J, Thorup A, Petersen L, Jeppesen P, Bertelsen M. Deinstitutionalization revisited: a 5‐year follow‐up of a randomised clinical trial of hospital‐based rehabilitation versus specialised assertive intervention (OPUS) versus standard treatment for patients with first‐episode schizophrenia spectrum disorders. Psychological Medicine 2010;40(10):1619‐26. [DOI] [PubMed] [Google Scholar]
- Nordentoft M, Petersen L, Jeppesen P, Thorup AA, Abel MB, Ohlenschlaeger J, et al. OPUS: a randomised, multicenter clinical trial of integrated treatment compared with standard treatment before the first episode psychosis ‐ secondary publication. Ugeskrift for Laeger 2006;168(4):381‐4. [PubMed] [Google Scholar]
- Nordentoft M, Reisby N, Jeppesen P, Abel M‐B, Kassow P, Jírgensen P. OPUS‐project: differences in treatment outcome of a randomised controlled trial of integrated psychiatric treatment of first‐episode psychotic patients. 11th World Congress of Psychiatry; 1999 Aug 6‐11; Hamburg, Germany. 1999; Vol. 2:165.
- Nordentoft M, Secher G, Bertelsen M, Thorup A, Austin S, Albert N, et al. Opus: concept and recent findings. European Archives of Psychiatry and Clinical Neuroscience 2011;261:S37‐S8. [Google Scholar]
- Nordentoft M, Secher G, Hjorthoj CR, Austin S, Thorup A, Jeppesen P, et al. Ten‐year follow‐up of the OPUS specialised early intervention trial for patients with a first episode of psychosis. Schizophrenia Bulletin 2015;41:S149. [DOI] [PMC free article] [PubMed] [Google Scholar]
- Nordentoft M, Thorup A, Petersen L, Jeppesen P, Krarup G, Christensen T, et al. The OPUS trial: a randomised multi‐centre trial of integrated versus standard treatment for 547 first‐episode psychotic patients. 13th Biennial Winter Workshop on Schizophrenia Research; 2006 Feb 4‐10; Davos, Switzerland. Davos, Switzerland: Elsevier Science Bv, 2006:8.
- Petersen L, Jeppesen P, Thorup A, Abel MB, Ohlenschlaeger J, Christensen TO, et al. A randomised multicentre trial of integrated versus standard treatment for patients with a first episode of psychotic illness. BMJ 2005;331(7517):602‐8. [DOI] [PMC free article] [PubMed] [Google Scholar]
- Petersen L, Jeppesen P, Thorup A, Ohlenschlaeger J, Christensen T, Krarup G, et al. Substance abuse in first‐episode schizophrenia‐spectrum disorders. Schizophrenia Research 2006;86(Suppl 1):S44. [Google Scholar]
- Petersen L, Nordentoft M, Jeppesen P, Ohlenschaeger J, Thorup A, Christensen TO, et al. Improving 1‐year outcome in first‐episode psychosis: OPUS trial. British Journal of Psychiatry 2005;48(Suppl):s98‐103. [DOI] [PubMed] [Google Scholar]
- Petersen L, Nordentoft M, Thorup A, Oehlenschlaeger J, Jeppesen P, Christensen T, et al. The OPUS trial: a randomised multi‐centre trial of integrated versus standard treatment for 547 first‐episode psychotic patients. Schizophrenia Bulletin 2005;31:531. [Google Scholar]
- Secher RG, Austin SF, Ole Mors NP, Nordentoft M. The OPUS‐trial: Intensive, early, psycho‐social intervention versus treatment as usual for first‐episode psychosis patients. Results from the 10‐year follow‐up. European Archives of Psychiatry and Clinical Neuroscience 2011;261:S59. [Google Scholar]
- Secher RG, Hjorthoj CR, Austin SF, Thorup A, Jeppesen P, Mors O, et al. Ten‐Year Follow‐up of the OPUS Specialised Early Intervention Trial for Patients With a First Episode of Psychosis. Schizophrenia Bulletin 2015;41(3):617‐26. [DOI] [PMC free article] [PubMed] [Google Scholar]
- Secher RG, Hjorthoj CR, Austin SF, Thorup A, Jeppesen P, Mors O, et al. Ten‐year follow‐up of the OPUS specialised early intervention trial for patients with a first episode of psychosis. Schizophrenia Bulletin 2015;41(3):617‐26. [DOI] [PMC free article] [PubMed] [Google Scholar]
- Stevens H, Agerbo E, Dean K, Mortensen PB, Nordentoft M. Reduction of crime in first‐onset psychosis: a secondary analysis of the OPUS randomised trial. Journal of Clinical Psychiatry 2013;74(5):e439‐44. [DOI] [PubMed] [Google Scholar]
- Thorup A. Gender differences in first‐episode psychosis at five‐year followup ‐ results from the Danish OPUS study gender differences have been found. Early Intervention in Psychiatry 2010;4(Suppl 1):53. [Google Scholar]
- Thorup A, Albert N, Bertelsen M, Petersen L, Jeppesen P, Quack P, et al. Gender differences in first‐episode psychosis at 5‐year follow‐up ‐ two different courses of disease? Results from the OPUS study at 5‐year follow‐up. European Psychiatry 2013;29(1):44‐51. [DOI] [PubMed] [Google Scholar]
- Thorup A, Nordentoft M, Petersen L, Oehlensschlaeger J, Abel M, Jeppesen P, et al. The Danish OPUS‐project: psychopathology and gender differences in first episode psychotic patients. 3rd International Conference on Early Psychosis; 2002 Sep 25‐28; Copenhagen, Denmark. 2002:59.
- Thorup A, Petersen L, Jeppesen P, Nordentoft M. The quality of life among first‐episode psychotic patients in the OPUS trial. Schizophrenia Research 2010;116(1):27‐34. [DOI] [PubMed] [Google Scholar]
- Thorup A, Petersen L, Jeppesen P, Ohlenschlaeger J, Christensen T, Krarup G, et al. Integrated treatment ameliorates negative symptoms in first episode psychosis ‐ results from the Danish OPUS trial. Schizophrenia Research 2005;79(1):95‐105. [DOI] [PubMed] [Google Scholar]
- Øhlenschlæger J, Thorup A, Petersen L, Jeppesen P, Abel M, Nordentoft M. Coercion in first episode psychosis. 3rd International Conference on Early Psychosis; 2002 Sep 25‐28; Copenhagen, Denmark. 2002:89‐90.
Piskulic‐2‐Canada {published data only}
- NCT02582528. Cognitive remediation in youth at risk of serious mental Illness. ClinicalTrials.gov/show/NCT02582528 2015.
RAISE‐ETP‐USA {published data only}
- Brunette MF. Facilitators and barriers to implementation of coordinated specialty care in U.S. community mental health clinic. Schizophrenia Bulletin 2015;41:S304. [Google Scholar]
- Cadenhead K, Addington J, Bearden C, Cannon T, Cornblatt B, Mathalon D, et al. Metabolic abnormalities prior to the onset of psychosis: another risk factor for psychosis?. Neuropsychopharmacology 2015;40:S565. [Google Scholar]
- Correll CU, Robinson DG, Schooler NR, Brunette MF, Mueser KT, Rosenheck RA, et al. Cardiometabolic risk in patients with first‐episode schizophrenia spectrum disorders: baseline results from the RAISE‐ETP study. JAMA Psychiatry 2014;71(12):1350‐63. [DOI] [PubMed] [Google Scholar]
- Glynn SM, Gingerich S, Mueser KT, Cather C, Penn D. The role of family intervention in coordinated specialty care for first episode psychosis. Schizophrenia Bulletin 2015;41:S173. [Google Scholar]
- Kane J, Schooler N, Robinson D, Addington J, Kane JM. The NIMH RAISE ETP (Early Treatment Program): initial results. Early Intervention in Psychiatry 2014;8:1. [Google Scholar]
- Kane JM. RAISE‐ETP: NAVIGATE vs usual care ‐ two year outcomes. Schizophrenia Bulletin 2015;41:S317. [Google Scholar]
- Kane JM. The RAISE ETP study: initial results. Early Intervention in Psychiatry 2014;8:2. [Google Scholar]
- Kane JM, Robinson DG, Schooler NR, Mueser KT, Penn DL, Rosenheck RA, et al. Comprehensive versus usual community care for first‐episode psychosis: 2‐year outcomes from the NIMH RAISE early treatment program. American Journal of Psychiatry 2016;173:362‐72. [DOI] [PMC free article] [PubMed] [Google Scholar]
- Mueser KT. Description and implementation of the RAISE‐ETP study psychosocial treatment model: the NAVIGATE program. Schizophrenia Bulletin 2015;41:S325‐6. [Google Scholar]
- Mueser KT, Penn DL, Addington J, Brunette MF, Gingerich S, Glynn SM, et al. The NAVIGATE Program for first‐episode psychosis: rationale, overview, and description of psychosocial components. Psychiatric Services 2015;66(7):680‐90. [DOI] [PMC free article] [PubMed] [Google Scholar]
- Robinson DG, Schooler NR, John M, Correll CU, Marcy P, Addington J, et al. Prescription practices in the treatment of first‐episode schizophrenia spectrum disorders: data from the national RAISE‐ETP study. American Journal of Psychiatry 2015;172(3):237‐48. [DOI] [PMC free article] [PubMed] [Google Scholar]
- Schooler N. RAISE‐ETP study design, site selection and implementation model. Early Intervention in Psychiatry 2014;8:1. [Google Scholar]
- Schooler NR. The RAISE‐ETP study design, research and implementation model. Schizophrenia Bulletin 2015;41:S332‐3. [Google Scholar]
Ramsay‐USA {published data only}
- Ramsay I, Fryer S, Boos A, Roach BJ, Fisher M, Loewy R, et al. Targeted cognitive training is neuroprotective against thalamic volume loss in early schizophrenia. Schizophrenia Bulletin 2017;43:S49. [Google Scholar]
RAP‐USA {published data only}
- Cornblatt B. Risperidone vs sertraline for prodromal schizophrenia. Stanley Foundation Research Programs 2009.
- NCT00169988. Sertraline alone vs in combination with risperidone in the treatment of attenuated positive and negative symptoms. www.ClinicalTrials.gov/ct/show/ 2005.
Schmechtig‐USA {published data only}
- Schmechtig A, Dourish C, Craig K, Dawson GR, Williams S, Deakin W, et al. Effects of risperidone, amisulpride and nicotine on eye movement control and their modulation by high schizotypy. Pharmacopsychiatry 2011;21:A99. [DOI] [PubMed] [Google Scholar]
- Schmechtig A, Lees J, Dawson G, Dourish C, Craig K, Deakin B, et al. Effects of high schizotypy on control of eye movements: Modulation by antipsychotic drugs and nicotine. Neuropsychopharmacology 2010;35:S389. [Google Scholar]
- Schmechtig A, Lees J, Dawson G, Dourish C, Craig K, Deakin B, et al. Effects of high schizotypy on control of eye movements: modulation by antipsychotic drugs and nicotine. 49th Annual Meeting of the American College of Neuropsychopharmacology; 2010 Dec 5‐9; Miami, Florida. 2010.
- Schmechtig A, Lees J, Dawson GR, Dourish CT, Craig KJ, Deakin JF, et al. Effects of risperidone, amisulpride and nicotine on eye movement control and their modulation by schizotypy. Pharmacopsychiatry. 2011:306. [DOI] [PubMed]
Uher‐Canada {published data only}
- Uher R, Cumby J, MacKenzie LE, Morash‐Conway J, Glover JM, Aylott A, et al. A familial risk enriched cohort as a platform for testing early interventions to prevent severe mental illness. BMC Psychiatry 2014;14:344. [DOI] [PMC free article] [PubMed] [Google Scholar]
- Uher R, Cumby J, McKenzie L, Morash J, Bagnell A, Propper L, et al. Families overcoming risks and building opportunities for wellbeing (FORBOW): a high‐risk cohort multiple randomised controlled trial. Early Intervention in Psychiatry 2014;8:6. [Google Scholar]
Vadhan‐USA {published data only}
- Vadhan NP, Corcoran CM, Bedi GI, Lieberman JG, Haney M. Marijuana smokers at clinical high‐risk for schizophrenia exhibit an enhanced subjective, behavioral and physiological response to smoked marijuana. Comprehensive Psychiatry 2013;54(8):e37. [Google Scholar]
Woods‐2‐USA {published data only}
- NCT00268749. Glycine treatment of prodromal symptoms. www.ClinicalTrials.gov/ct/show/ 2005.
- Woods S. A 12‐week open label trial of glycine treatment of prodromal symptoms of schizophrenia in 25 patients. Glycine is an amino acid that stimulates the NMDA receptor. Some theories of schizophrenia posit that NMDA receptors may be hypoactive. Stanley Foundation Research Programs 2002.
References to studies awaiting assessment
Armando‐Italy {published data only}
- Armando M, Crescenzo F, Vicari S, Digilio MC, Pontillo M, Papaleo F, et al. Indicated prevention with long‐chain polyunsaturated omega‐3 fatty acids in patients with 22q11DS genetically at high risk for psychosis. Protocol of a randomised, double‐blind, placebo‐controlled treatment trial. Early Intervention in Psychiatry 2014;10(5):390‐6. [DOI: 10.1111/eip.12197] [DOI] [PubMed] [Google Scholar]
Goie‐Norway {published data only}
- NCT03048695. Goal management training for patients with schizophrenia or high risk for schizophrenia. ClinicalTrials.gov/show/NCT03048695 2017.
Langer‐Chile {published data only}
- ISRCTN24327446. The effect of mindfulness based intervention in cognitive functions and psychological well‐being applied as an early intervention in schizophrenia and high risk mental state. www.isrctn.com/ISRCTN24327446 2016. [DOI] [PMC free article] [PubMed]
- Langer AI, Schmidt C, Mayol R, Diaz M, Lecaros J, Krogh E, et al. The effect of a mindfulness‐based intervention in cognitive functions and psychological well‐being applied as an early intervention in schizophrenia and high‐risk mental state in a Chilean sample: study protocol for a randomised controlled trial. Trials 2017;18(1):233. [DOI] [PMC free article] [PubMed] [Google Scholar]
Nemoto‐Japan {published data only}
- Nemoto T, Takeshi K, Niimura H, Tobe M, Ito R, Saito H, et al. Phase‐specific cognitive remediation in the early course of schizophrenia. Early Intervention in Psychiatry 2014;8:42. [Google Scholar]
OMEGA3‐NAPLS‐USA {published data only}
- Cadenhead K, Addington J, Bearden CE, Cannon T, Cornblatt B, Mathalon D, et al. Metabolic parameters prior to the onset of psychosis in the North American Prodrome Longitudinal Studies (NAPLS) consortium. Schizophrenia Bulletin 2015;41:S124. [Google Scholar]
- Cadenhead K, Addington J, Cannon T, Cornblatt B, Mathalon D, McGlashan T, et al. Omega‐3 fatty acid versus placebo in a clinical high‐risk sample from the North American Prodrome Longitudinal studies (NAPLS) consortium. Schizophrenia Bulletin 2017;43:S16. [Google Scholar]
- Kelsven S, Addington J, Bearden C, Cannon T, Cornblatt B, Mathalon D, et al. Metabolic abnormalities and omega‐3 fatty acids in Latinos at clinical high risk for psychosis. Schizophrenia Bulletin 2017;43:S14‐5. [Google Scholar]
POP‐Norway {published data only}
- ISRCTN20328848. Primary prevention of psychosis through interventions in the prodromal phase. www.isrctn.com/ISRCTN20328848 2014.
- Joa I, Gisselgard J, Bronnick K, McGlashan T, Johannessen JO. Primary prevention of psychosis through interventions in the symptomatic prodromal phase, a pragmatic Norwegian ultra high risk study. BMC Psychiatry 2015;15:89. [DOI] [PMC free article] [PubMed] [Google Scholar]
Woods‐3‐USA {published data only}
- Woods S, Saksa J, Compton M, Daley M, Rajarethinam R, Graham K, et al. Effects of ziprasidone versus placebo in patients at clinical high risk for psychosis. Schizophrenia Bulletin 2017;43:S58. [Google Scholar]
References to ongoing studies
ChiCTR‐INR‐16009566 {published data only}
- ChiCTR‐INR‐16009566. Personalised strategy for non‐invasive early intervention on clinical high‐risk subjects for psychosis. apps.who.int/trialsearch/Trial2.aspx?TrialID=ChiCTR‐INR‐16009566 2016.
Deyoe‐USA/Mexico {published data only}
- Deyoe J, Kelsven S, Robles‐Guerrero C, Mirzakhanian H, Perez G, Reyes‐Madrigal F, et al. Compensatory cognitive training in high‐risk Latino youth. Schizophrenia Bulletin 2017;43:S150‐1. [Google Scholar]
- NCT02245607. Compensatory cognitive training in clinical high risk Latino youth. ClinicalTrials.gov/show/NCT02245607 2014.
ESPRIT B1‐Germany {published data only}
- Falkai P, Leweke FM, Ruhrmann S, Woelwer W. Enhancing schizophrenia prevention and recovery through innovative treatments ‐ a new network approach in Germany. Early Intervention in Psychiatry 2014;8:20. [Google Scholar]
- NCT03149107. Multimodal prevention of psychosis ‐ a randomised trial investigating the efficacy of N‐acetylcysteine (NAC) and integrated preventive psychological intervention (IPPI) in subjects clinically at high risk for psychosis. ClinicalTrials.gov/show/NCT03149107 2017.
- Ruhrmann S, Hellmich M, Hurlemann R, Maier W, Klosterkotter J. N‐acetylcysteine (NAC) and integrated preventive psychological intervention (IPPI) in subjects clinically at high risk for psychosis. Early Intervention in Psychiatry 2014;8:20. [DOI] [PubMed] [Google Scholar]
FOCUS‐Denmark {published data only}
- Glenthoj LB, Fagerlund B, Randers L, Hjorthoj CR, Wenneberg C, Krakauer K, et al. The FOCUS trial: an RCT evaluating the effectiveness of cognitive remediation therapy for patients at ultra‐high risk of psychosis. Early Intervention in Psychiatry 2014;8:109. [Google Scholar]
- Glenthoj LB, Fagerlund B, Randers L, Hjorthoj CR, Wenneberg C, Krakauer K, et al. The FOCUS trial: cognitive remediation plus standard treatment versus standard treatment for patients at ultra‐high risk for psychosis: study protocol for a randomised controlled trial. Trials 2015;16(1):25. [DOI] [PMC free article] [PubMed] [Google Scholar]
- NCT02098408. Effects of neurocognitive and social cognitive remediation in patients at ultra‐high risk of psychosis [A randomised clinical trial examining cognitive remediation plus standard treatment versus standard treatment in participants at ultra‐high risk of psychosis. ‐ effect on cognitive functioning, functional outcome and symptomatology. Mental health services in the capital region, Denmark]. Clinicaltrials.gov/show/NCT02098408. Denmark, 2014.
- Wenneberg C, Nordentoft M, Glenthoj BY, Rostrup E, Glenthoj LB, Krakauer K, et al. Glutamatergic disturbances in subjects at ultra‐high risk of psychosis and the effect of cognitive remediation therapy. Early Intervention in Psychiatry 2014;8:168. [Google Scholar]
ISRCTN42478021 {published data only}
- ISRCTN42478021. Combined individual and family cognitive behavioural therapy compared with treatment as usual. www.isrctn.com/ 2016.
NCT02047539 {published data only}
- NCT02047539. Randomised controlled trial of aspirin vs placebo in the treatment of pre‐psychosis [Randomised controlled trial of aspirin vs placebo in the treatment of patients with the clinical risk syndrome for psychosis]. Clinicaltrials.gov/show/NCT02047539. USA, 2014.
NCT02155699 {published data only}
- NCT02155699. Exercise and markers of medial temporal health in youth at ultra high‐risk for psychosis. Clinicaltrials.gov/show/NCT02155699 2014.
NCT02234258 {published data only}
- NCT02234258. Cognitive behavioral social skills training for youth at risk of psychosis. Clinicaltrials.gov/show/NCT02234258 2015.
NCT02404194 {published data only}
- NCT02404194. Targeted cognitive training in clinical high risk (CHR) for psychosis. www.ClinicalTrials.gov/ct/show/ 2015.
NCT02557945 {published data only}
- NCT02557945. Gabapentin in patients at clinical risk for psychosis. ClinicalTrials.gov/show/NCT02557945 2015.
NCT02751632 {published data only}
- ACTRN12616000098437. Staged Treatment in Early Psychosis (STEP): a sequential multistage randomised clinical trial (SMART) of interventions for ultra high risk (UHR) of psychosis patients. apps.who.int/trialsearch/Trial2.aspx?TrialID=ACTRN12616000098437 2016.
- NCT02751632. The staged treatment in early psychosis study. ClinicalTrials.gov/show/NCT02751632 2016.
NCT02951208 {published data only}
- NCT02951208. tDCS coupled with virtual rehabilitation for negative symptoms in at‐risk youth. ClinicalTrials.gov/show/NCT02951208 2016.
NCT02960451 {published data only}
- NCT02960451. PRIME vs usual care for clinical high risk. ClinicalTrials.gov/show/NCT02960451 2016.
OMEGA3‐Ireland {published data only}
- NCT02848469. Irish omega‐3 study. ClinicalTrials.gov/show/NCT02848469 2016.
PREVENT‐Germany {published data only}
- Bechdolf A, Mueller H, Stuetzer H, Wagner M, Maier W, Lautenschlager M, et al. Rationale and baseline characteristics of prevent: a second‐generation intervention trial in subjects at‐risk (prodromal) of developing first‐episode psychosis valuating cognitive behavior therapy, aripiprazole, and placebo for the prevention of psychosis. Schizophrenia Bulletin 2011;37(Suppl 2):111‐21. [DOI] [PMC free article] [PubMed] [Google Scholar]
- Bechdolf A, Muller H, Stutzer H, Lambert M, Karow A, Zink M, et al. PREVENT: a randomised controlled trial for the prevention of first‐episode psychosis comparing cognitive‐behavior therapy (CBT), clinical management, and aripiprazole combined and clinical management and placebo combined. Schizophrenia Bulletin 2017;43:S56‐7. [Google Scholar]
- Bechdolf A, Muller H, Stutzer H, Wagner M, Maier W, Lautenschlager M, et al. Rationale and baseline characteristics of prevent: a second generation intervention trial in subjects at‐risk (prodromal) of developing first episode psychosis evaluating cognitive behaviour therapy, aripiprazole and placebo for the prevention of psychosis. Schizophrenia Research 2012;136:S18. [DOI] [PMC free article] [PubMed] [Google Scholar]
- Bechdolf A, Veith V, Vogeley K, Brockhaus‐Dumke A, Ruhrmann S, Schultze‐Lutter F, et al. PREVENT: a second generation intervention trial in subjects at risk of developing first episode psychosis evaluating CBT, aripiprazole and placebo for the prevention of psychosis. Early Intervention in Psychiatry 2008;2(Suppl 1):A11. [Google Scholar]
- Bechdolf A, Wessels H, Wagner M, Kuhr K, Berning J, Putzfeld V, et al. Predictors of treatment response to psychosocial interventions in people at risk. European Archives of Psychiatry and Clinical Neuroscience 2015;1:S9. [Google Scholar]
- Klosterkötter J. Secondary prevention of schizophrenia: a randomised controlled trial. www.controlled‐trials.com 2007.
Quarashi‐Pakistan {published data only}
- NCT02569307. Pilot study of minocycline and/or omega‐3 fatty acids added to treatment as usual for at risk mental states. ClinicalTrials.gov/show/NCT02569307 2015.
- Qurashi I, Chaudhry IB, Khoso AB, Farooque S, Lane S, Husain MO, et al. A randomised, double‐blind, placebo‐controlled trial of minocycline and/or omega‐3 fatty acids added to treatment as usual for at‐risk mental states (NAYAB): study protocol. Trials 2017;18(1):524. [doi: 10.1186/s13063‐017‐2275‐y] [DOI] [PMC free article] [PubMed] [Google Scholar]
Rurhman‐USA/UK {published data only}
- Keefe R, Woods S, Cannon T, Ruhrmann S, Mathalon D, McGuire P, et al. Early intervention in attenuated psychosis syndrome: a phase II study evaluating efficacy, safety, and tolerability of oral BI 409306. Schizophrenia Bulletin 2017;43:S216. [DOI] [PMC free article] [PubMed] [Google Scholar]
Additional references
Abi‐Dargham 2004
- Abi‐Dargham A. Do we still believe in the dopamine hypothesis? New data bring new evidence. International Journal of Neuropsychopharmacology 2004;7(Suppl 1):S1‐5. [DOI] [PubMed] [Google Scholar]
Addington 1990
- Addington D, Addington J, Maticka‐Tyndale E. Specificity of the Calgary Depression Scale for schizophrenics. Schizophrenia Research 1994;11:239‐44. [DOI] [PubMed] [Google Scholar]
Addington 2017
- Addington J, Addington D, Abidi S, Raedler T, Remington G. Canadian treatment guidelines for individuals at clinical high risk of psychosis. Canadian Journal of Psychiatry. Revue Canadienne de Psychiatrie 2017;62(9):656‐61. [DOI] [PMC free article] [PubMed] [Google Scholar]
Ainsworth 2007
- Ainsworth J, Harper R. The PsyGrid Experience: Using Web Services in the Study of Schizophrenia. International Journal of Healthcare Information Systems and Informatics 2007;2(2):1‐20. [Google Scholar]
Allen 2012
- Allen P, Chaddock CA, Howes OD, Egerton A, Seal ML, Fusar‐Poli P, et al. Abnormal relationship between medial temporal lobe and subcortical dopamine function in people with an ultra high risk for psychosis. Schizophrenia Bulletin 2012;38(5):1040–9. [DOI: 10.1093/schbul/sbr017] [DOI] [PMC free article] [PubMed] [Google Scholar]
Altman 1996
- Altman DG, Bland JM. Detecting skewness from summary information. BMJ 1996;313(7066):1200. [DOI] [PMC free article] [PubMed] [Google Scholar]
Amminger 2010
- Amminger GP, Schafer MR, Papageorgiou K, Klier CM, Cotton SM, Harrigan SM, et al. Long‐chain omega‐3 fatty acids for indicated prevention of psychotic disorders: a randomised, placebo‐controlled trial. Archives of General Psychiatry 2010;67(2):146‐54. [DOI] [PubMed] [Google Scholar]
Anderson 2015
- Anderson K, Laxhman N, Priebe S. Can mental health interventions change social networks? A systematic review. BMC Psychiatry 2015;15:297. [DOI: 10.1186/s12888-015-0684-6] [DOI] [PMC free article] [PubMed] [Google Scholar]
Andreasen 1983
- Andreasen NC. Scale for the Assessment of Negative Symptoms (SANS). Iowa City: University of Iowa, 1983. [Google Scholar]
Andreasen 1984
- Andreasen NC. Scale for the Assessment of Positive Symptoms (SAPS). Iowa City: University of Iowa, 1984. [Google Scholar]
Andreasen 2013
- Andreasen NC, Liu D, Ziebell S, Vora A, Ho BC. Relapse duration, treatment intensity, and brain tissue loss in schizophrenia: a prospective longitudinal MRI study. American Journal of Psychiatry 2013;170(6):609‐15. [DOI] [PMC free article] [PubMed] [Google Scholar]
Andrew 1979
- Andrew DM, Paterson DG, Longstaff HP. Minnesota Clerical Test Manual. 2nd Edition. San Antonio: Harcourt Assessment Company, Psychological Corporation, 1979. [Google Scholar]
Anticevic 2015
- Anticevic A, Haut K, Murray JD, Repovs G, Yang GJ, Diehl C, et al. Association of thalamic dysconnectivity and conversion to psychosis in youth and young adults at elevated clinical risk. JAMA Psychiatry 2015;72(9):882‐91. [DOI: 10.1001/jamapsychiatry.2015.0566] [DOI] [PMC free article] [PubMed] [Google Scholar]
APA 1994
- American Psychiatric Association. Diagnostic and Statistical Manual of Mental Disorders, Fourth edition. 4th Edition. Washington: American Psychiatric Association, 1994. [Google Scholar]
APA 2013
- American Psychiatric Association. Diagnostic and Statistical Manual of Mental Disorders, Fifth Edition. 5th Edition. Arlington: American Psychiatric Association, 2013. [Google Scholar]
Barnes 1989
- Barnes TR. A rating scale for drug‐induced akathisia. British Journal of Psychiatry 1989;154:672–6. [DOI] [PubMed] [Google Scholar]
Beck 1961
- Beck AT, Ward CH, Mendelson M, Mock J, Erbaugh J. An inventory for measuring depression. Archives of General Psychiatry 1961;4:561–71. [DOI] [PubMed] [Google Scholar]
Beck 1996
- Beck AT, Steer RA, Brown GK. Beck Depression Inventory‐II. San Antonio: Psychological Corporation, 1996. [Google Scholar]
Berger 2012
- Berger GE, Wood SJ, Ross M, Hamer CA, Wellard RM, Pell G, et al. Neuroprotective effects of low‐dose lithium in individuals at ultra‐high risk for psychosis. A longitudinal MRI/MRS study. Current Pharmaceutical Design 2012;18(4):570‐5. [DOI] [PubMed] [Google Scholar]
Bergman 2017
- Bergman H, Walker DM, Nikolakopoulou A, Soares‐Weiser K, Adams CE. Systematic review of interventions for treating or preventing antipsychotic‐induced tardive dyskinesia. Health Technology Assessment (Winchester, England) 2017;21(43):1‐218. [PUBMED: 28812541] [DOI] [PMC free article] [PubMed] [Google Scholar]
Birchwood 1990
- Birchwood M, Smith J, Cochrane R, Wetton S, Copestake S. The Social Functioning Scale: the development and validation of a new scale adjustment for use in family intervention programmes with schizophrenic patients. British Journal of Psychiatry 1990;157:853–9. [DOI] [PubMed] [Google Scholar]
Birchwood 1993
- Birchwood M, Mason R, MacMillan F, Healy J. Depression, demoralisation and control over psychotic illness: a comparison of depressed and non‐depressed patients with a chronic psychosis. Psychological Medicine 1993;23:387–95. [DOI: 10.1017/s0033291700028488] [DOI] [PubMed] [Google Scholar]
Birchwood 2012
- Birchwood M, Jackson Ch, Brunet K, Holden J, Barton K. Personal beliefs about illness questionnaire‐revised (PBIQ‐R): reliability and validation in a first episode sample. British Journal of Clinical Psychology 2012;51:448–58. [DOI] [PubMed] [Google Scholar]
Bland 1997
- Bland JM. Statistics notes. Trials randomised in clusters. BMJ 1997;315:600. [DOI] [PMC free article] [PubMed] [Google Scholar]
Boissel 1999
- Boissel JP, Cucherat M, Li W, Chatellier G, Gueyffier F, Buyse M, et al. The problem of therapeutic efficacy indices. 3. Comparison of the indices and their use [Apercu sur la problematique des indices d'efficacite therapeutique, 3: comparaison des indices et utilisation. Groupe d'Etude des Indices D'efficacite]. Therapie 1999;54(4):405‐11. [PUBMED: 10667106] [PubMed] [Google Scholar]
Broome 2005
- Broome MR, Woolley JB, Johns LC, Valmaggia LR, Tabraham P, Gafoor R, et al. Outreach and support in south London (OASIS): implementation of a clinical service for prodromal psychosis and the at risk mental state. European Psychiatry 2005;20(5‐6):372‐8. [DOI] [PubMed] [Google Scholar]
Cai 2015
- Cai Y, Zhu Y, Zhang W, Wang Y, Zhang C. Comprehensive family therapy: an effective approach for cognitive rehabilitation in schizophrenia. Neuropsychiatric Disease and Treatment 2015;11:1247–53. [DOI] [PMC free article] [PubMed] [Google Scholar]
Cannon 2008
- Cannon TD, Cadenhead K, Cornblatt B, Woods SW, Addington J, Walker E, et al. Prediction of psychosis in youth at high clinical risk: a multisite longitudinal study in North America. Archives of General Psychiatry 2008;65(1):28‐37. [DOI] [PMC free article] [PubMed] [Google Scholar]
Chouinard 1980
- Chouinard G, Ross‐Chouinard A, Annable L, Jones B. The extrapyramidal symptom rating scale. Canadian Journal of Neurological Sciences 1980;7(3):233. [Google Scholar]
Chung 2015
- Chung Y, Jacobson A, He G, Erp TG, McEwen S, Addington J, et al. Prodromal symptom severity predicts accelerated gray matter reduction and third ventricle expansion among clinically high risk youth developing psychotic disorders. Molecular Neuropsychiatry 2015;1(1):13‐22. [DOI] [PMC free article] [PubMed] [Google Scholar]
Cornblatt 2002
- Cornblatt B, Lencz T, Obuchowski M. The schizophrenia prodrome: treatment and high‐risk perspectives. Schizophrenia Research 2002;54(1‐2):177‐86. [DOI] [PubMed] [Google Scholar]
Cornblatt 2007a
- Cornblatt BA, Lencz T, Smith CW, Olsen R, Auther AM, Nakayama E, et al. Can antidepressants be used to treat the schizophrenia prodrome? Results of a prospective, naturalistic treatment study of adolescents. Journal of Clinical Psychiatry 2007;68(4):546‐57. [DOI] [PubMed] [Google Scholar]
Cornblatt 2007b
- Cornblatt BA, Auther AM, Niendam T, Smith CH, Zinberg J, Bearden CE, et al. Preliminary findings for two new measures of social and role functioning in the prodromal phase of schizophrenia. Schizophrenia Bulletin 2007;33(3):688‐702. [DOI] [PMC free article] [PubMed] [Google Scholar]
Davies 2018a
- Davies C, Radua J, Cipriani A, Stahl D, Provenzani U, McGuire P, et al. Efficacy and acceptability of interventions for attenuated positive psychotic symptoms in individuals at clinical high risk of psychosis: a network meta‐analysis. Frontiers in Psychiatry / Frontiers Research Foundation 2018;9:187. [DOI] [PMC free article] [PubMed] [Google Scholar]
Davies 2018b
- Davies C, Cipriani A, Ioannidis JP, Radua J, Stahl D, Provenzani U, et al. Lack of evidence to favor specific preventive interventions in psychosis: a network meta‐analysis. World Psychiatry 2018;17(2):196‐209. [DOI: 10.1002/wps.20526] [DOI] [PMC free article] [PubMed] [Google Scholar]
Deeks 2000
- Deeks J. Issues in the selection for meta‐analyses of binary data. 8th International Cochrane Colloquium; 2000 Oct 25‐28; Cape Town. Cape Town: The Cochrane Collaboration, 2000.
Deeks 2017
- Deeks JJ, Higgins JP, Altman DG (editors), on behalf of the Cochrane Statistical Methods Group. Chapter 9: Analysing data and undertaking meta‐analyses. In: Higgins JPT, Churchill R, Chandler J, Cumpston MS (editors), Cochrane Handbook for Systematic Reviews of Interventions version 5.2.0 (updated June 2017), Cochrane, 2017. Available from www.training.cochrane.org/handbook.
Derogatis 1995
- Derogatis L. Brief Symptom Inventory. Baltimore: Research, CP, 1995. [Google Scholar]
Devoe 2018a
- Devoe DJ, Peterson A, Addington J. Negative symptom interventions in youth at risk of psychosis: a systematic review and network meta‐analysis. Schizophrenia Bulletin 2018;44(4):807‐23. [DOI: 10.1093/schbul/sbx139; PUBMED: 29069511] [DOI] [PMC free article] [PubMed] [Google Scholar]
Devoe 2018b
- Devoe DJ, Farris MS, Townes P, Addington J. Interventions and social functioning in youth at risk of psychosis: a systematic review and meta‐analysis. Early Intervention in Psychiatry 2018;13(2):169‐180. [DOI: 10.1111/eip.12689] [DOI] [PubMed] [Google Scholar]
Devoe 2018c
- Devoe DJ, Farris MS, Townes P, Addington J. Attenuated psychotic symptom interventions in youth at risk of psychosis: a systematic review and meta‐analysis. Early Intervention in Psychiatry 2018;13(1):3‐17. [DOI: 10.1111/eip.12677] [DOI] [PMC free article] [PubMed] [Google Scholar]
Divine 1992
- Divine GW, Brown JT, Frazier LM. The unit of analysis error in studies about physicians' patient care behavior. Journal of General Internal Medicine 1992;7(6):623‐9. [DOI] [PubMed] [Google Scholar]
Dolder 2003
- Dolder CR, Lacro JP, Leckband S, Jeste DV. Interventions to improve antipsychotic medication adherence: review of recent literature. Journal of Clinical Psychopharmacology 2003;23(4):389–99. [DOI] [PubMed] [Google Scholar]
Donner 2002
- Donner A, Klar N. Issues in the meta‐analysis of cluster randomised trials. Statistics in Medicine 2002;21(19):2971‐80. [DOI] [PubMed] [Google Scholar]
Durham 2005
- Durham RC, Chambers JA, Power KG, Sharp DM, Macdonald RR, Major KA, et al. Long‐term outcome of cognitive behaviour therapy clinical trials in central Scotland. Health Technology Assessment 2005;9(42):1‐174. [DOI] [PubMed] [Google Scholar]
Egger 1997
- Egger M, Davey Smith G, Schneider M, Minder C. Bias in meta‐analysis detected by a simple, graphical test. BMJ 1997;315:629‐34. [DOI] [PMC free article] [PubMed] [Google Scholar]
Elbourne 2002
- Elbourne DR, Altman DG, Higgins JP, Curtina F, Worthington HV, Vail A. Meta‐analyses involving cross‐over trials: methodological issues. International Journal of Epidemiology 2002;31(1):140‐9. [DOI] [PubMed] [Google Scholar]
Emsley 2013
- Emsley R, Chiliza B, Asmal R, Harvey BH. The nature of relapse in schizophrenia. BMC Psychiatry 2013;13:50. [DOI] [PMC free article] [PubMed] [Google Scholar]
Falloon 1985
- Falloon IR, Boyd JL, McGill CW, Williamson M, Razani J, Moss HB, et al. Family management in the prevention of morbidity of schizophrenia. Clinical outcome of a two‐year longitudinal study. Archives of General Psychiatry 1985;42(9):887–96. [DOI] [PubMed] [Google Scholar]
Furukawa 2006
- Furukawa TA, Barbui C, Cipriani A, Brambilla P, Watanabe N. Imputing missing standard deviations in meta‐analyses can provide accurate results. Journal of Clinical Epidemiology 2006;59(7):7‐10. [DOI] [PubMed] [Google Scholar]
Fusar‐Poli 2007
- Fusar‐Poli P, Valmaggia L, McGuire P. Can antidepressants prevent psychosis?. Lancet 2007;370(9601):1746‐8. [DOI] [PubMed] [Google Scholar]
Fusar‐Poli 2016
- Fusar‐Poli P, Schultze‐Lutter F, Cappucciati M, Rutigliano G, Bonoldi I, Stahl D, et al. The dark side of the moon: meta‐analytical impact of recruitment strategies on risk enrichment in the clinical high risk state for psychosis. Schizophrenia Bulletin 2016;42(3):732‐43. [DOI] [PMC free article] [PubMed] [Google Scholar]
Glasziou 2018
- Glasziou P, Chalmers I. Research waste is still a scandal ‐ an essay by Paul Glasziou and Iain Chalmers. BMJ (Clinical Research Ed.) 2018;363:k4645. [PUBMED: 30420358] [Google Scholar]
Gold 1997
- Gold JM, Carpenter C, Randolph C, Goldberg TE, Weinberger DR. Auditory working memory and Wisconsin Card Sorting Test performance in schizophrenia. Archives of General Psychiatry 1997;54:159‐65. [DOI] [PubMed] [Google Scholar]
Golden 1978
- Golden C. Stroop Color and Word Test: Manual for Clinical and Experimental Uses. Chicago: Stoelting, 1978. [Google Scholar]
Goldman 1992
- Goldman HH, Skodol AE, Lave TR. Revising axis V for DSM‐ IV: a review of measures of social functioning. American Journal of Psychiatry 1992;149(9):1148‐56. [DOI] [PubMed] [Google Scholar]
GRADEpro GDT [Computer program]
- McMaster University (developed by Evidence Prime). GRADEpro GDT. Version 19 September 2019. Hamilton (ON): McMaster University (developed by Evidence Prime).
Gulliford 1999
- Gulliford MC. Components of variance and intraclass correlations for the design of community‐based surveys and intervention studies: data from the Health Survey for England 1994. American Journal of Epidemiology 1999;149(9):876‐3. [DOI] [PubMed] [Google Scholar]
Guy 1976
- Guy W (editor). ECDEU Assessment Manual for Psychopharmacology. Rockville: US Department of Health, Education, and Welfare, 1976. [Google Scholar]
Guy 1976b
- Guy W. ECDEU Assessment Manual for Psychopharmacology (DOTES: Dosage Record and Treatment Emergent Symptom Scale). Rockville: National Institute of Mental Health, 1976. [Google Scholar]
Hamilton 1959
- Hamilton M. The assessment of anxiety states by rating. British Journal of Medical Psychology 1959;32:50–5. [DOI] [PubMed] [Google Scholar]
Hamilton 1960
- Hamilton, M. A rating scale for depression. Journal of Neurology, Neurosurgery, and Psychiatry 1960;23:56‐62. [DOI] [PMC free article] [PubMed] [Google Scholar]
Heaton 1993
- Heaton RK, Chelune GJ, Talley JL, Kay GG, Curtis G. Wisconsin Card Sorting Test, Manual. Odessa: Psychological Assessment Resources, 1993. [Google Scholar]
Heinrichs 1984
- Heinrichs DW, Hanlon TE, Carpenter WT. The quality of life scale: an instrument for rating the schizophrenic deficit syndrome. Schizophrenia Bulletin 1984;10(3):388. [DOI] [PubMed] [Google Scholar]
Higgins 2003
- Higgins JP, Thompson SG, Deeks JJ, Altman DG. Measuring inconsistency in meta‐analyses. BMJ 2003;327:557‐60. [DOI] [PMC free article] [PubMed] [Google Scholar]
Higgins 2011a
- Higgins JP, Deeks JJ (editors). Chapter 7: Selecting studies and collecting data. In: Higgins JPT, Green S (editors), Cochrane Handbook for Systematic Reviews of Interventions. Version 5.1.0 (updated March 2011). The Cochrane Collaboration, 2011. Available from www.cochrane‐handbook.org.
Higgins 2011b
- Higgins JP, Deeks JJ, Altman DG (editors). Chapter 16: Special topics in statistics. In: Higgins JPT, Green S (editors). Cochrane Handbook for Systematic Reviews of Interventions. Version 5.1.0 (updated March 2011). The Cochrane Collaboration, 2011. Available from handbook.cochrane.org.
Higgins 2017
- Higgins JP, Altman DG, Sterne JA (editors). Chapter 8: Assessing risk of bias in included studies. In: Higgins JPT, Churchill R, Chandler J, Cumpston MS (editors), Cochrane Handbook for Systematic Reviews of Interventions version 5.2.0 (updated June 2017), Cochrane, 2017. Available from www.training.cochrane.org/handbook.
Hogarty 1991
- Hogarty GE, Anderson CM, Reiss DJ, Kornblith SJ, Greenwald DP, Urlich RF, et al. Family psychoeducation, social skills training, and maintenance chemotherapy in the aftercare treatment of schizophrenia. II. Two‐year effects of a controlled study on relapse and adjustment. Archives of General Psychiatry 1991;48(4):340–7. [DOI] [PubMed] [Google Scholar]
Howes 2012
- Howes OD, Fusar‐Poli P, Bloomfield M, Selvaraj S, McGuire P. From the prodrome to chronic schizophrenia: the neurobiology underlying psychotic symptoms and cognitive impairments. Current Pharmaceutical Design 2012;18(4):459‐65. [DOI] [PMC free article] [PubMed] [Google Scholar]
Häfner 1992
- Häfner H, Riecher‐Rössler A, Hambrecht M, Maurer K, Meissner S, Schmidtke A, et al. IRAOS: an instrument for the assessment of onset and early course of schizophrenia. Schizophrenia Research 1992;6:209–23. [DOI] [PubMed] [Google Scholar]
Jaaskelainen 2013
- Jaaskelainen E, Juola P, Hirvonen N, McGrath JJ, Saha S, Isohanni M, et al. A systematic review and meta‐analysis of recovery in schizophrenia. Schizophrenia Bulletin 2013;39(6):1296–306. [DOI] [PMC free article] [PubMed] [Google Scholar]
Jauhar 2014
- Jauhar S, McKenna PJ, Radua J, Fung E, Salvador R, Laws KR. Cognitive–behavioural therapy for the symptoms of schizophrenia: systematic review and meta‐analysis with examination of potential bias. British Journal of Psychiatry 2014;204(1):20‐9. [DOI: 10.1192/bjp.bp.112.116285] [DOI] [PubMed] [Google Scholar]
Job 2006
- Job DE, Whalley HC, McIntosh AM, Johnstone EC, Lawrie SM. Grey matter changes can improve the prediction of schizophrenia in subjects at high risk. BMC Psychiatry 2006;4:29. [DOI] [PMC free article] [PubMed] [Google Scholar]
Kantrowitz 2015
- Kantrowitz JT, Woods SW, Petkova E, Cornblatt B, Corcoran CM, Chen H, et al. D‐serine for the treatment of negative symptoms in individuals at clinical high risk of schizophrenia: a pilot, double‐blind, placebo‐controlled, randomised parallel group mechanistic proof‐of‐concept trial. Lancet Psychiatry 2015;2(5):403‐12. [DOI: 10.1016/S2215-0366(15)00098-X] [DOI] [PubMed] [Google Scholar]
Kay 1987
- Kay SR, Opler LA. The Positive and Negative Syndrome Scale (PANSS) for schizophrenia. Schizophrenia Bulletin 1987;13(2):261‐76. [PUBMED: 3616518] [DOI] [PubMed] [Google Scholar]
La Greca 1993
- Greca AM, Stone WL. Social anxiety scale for children revised: factor structure and concurrent validity. Journal of Clinical Child Psychology 1993;22:17–27. [DOI: 10.1207/s15374424jccp2201_2] [DOI] [Google Scholar]
Leon 2006
- Leon AC, Mallinckrodt CH, Chuang‐Stein C, Archibald DG, Archer GE, Chartier K. Attrition in randomised controlled clinical trials: methodological issues in psychopharmacology. Biological Psychiatry 2006;59(11):1001‐5. [PUBMED: 16905632] [DOI] [PubMed] [Google Scholar]
Leucht 2005a
- Leucht S, Kane JM, Kissling W, Hamann J, Etschel E, Engel R. Clinical implications of Brief Psychiatric Rating Scale scores. British Journal of Psychiatry 2005;187:366‐71. [PUBMED: 16199797] [DOI] [PubMed] [Google Scholar]
Leucht 2005b
- Leucht S, Kane JM, Kissling W, Hamann J, Etschel E, Engel RR. What does the PANSS mean?. Schizophrenia Research 2005;79(2‐3):231‐8. [PUBMED: 15982856] [DOI] [PubMed] [Google Scholar]
Levine 1986
- Levine J, Schooler NR. SAFTEE: a technique for the systematic assessment of side effects in clinical trials. Psychopharmacology Bulletin 1986;22(2):343‐81. [PubMed] [Google Scholar]
Lingjærde 1987
- Lingjærde O, Ahlfors UG, Bech P, Dencker SJ, Elgen K. The UKU side effect rating scale. A new comprehensive rating scale for psychotropic drugs and a cross‐sectional study of side effects in neuroleptic‐treated patients. Acta Psychatrica Scandinavica 1987;76:Suppl 334. [DOI] [PubMed] [Google Scholar]
Marshall 2000
- Marshall M, Lockwood A, Bradley C, Adams C, Joy C, Fenton M. Unpublished rating scales: a major source of bias in randomised controlled trials of treatments for schizophrenia. British Journal of Psychiatry 2000;176:249‐52. [DOI] [PubMed] [Google Scholar]
Mattick 1998
- Mattick RP, Clarke JC. Development and validation of measures of social phobia scrutiny fear and social interaction anxiety. Behaviour Research and Therapy 1998;36:455–70. [DOI] [PubMed] [Google Scholar]
Maurer 2004
- Maurer K, Horrmann F, Schmidt G, Trendler G, Häfner H. The early recognition inventory ERIraos: a two‐step procedure for detection of ‘‘at‐risk mental states’’. Schizophrenia Research 2004;70 (suppl):s76. [Google Scholar]
McAusland 2015
- McAusland L, Buchy L, Cadenhead KS, Cannon TD, Cornblatt BA, Heinssen R, et al. Anxiety in youth at clinical high risk for psychosis. Early Intervention in Psychiatry 2017; Vol. 11, issue 6:480‐487. [DOI: 10.1111/eip.12274] [DOI] [PMC free article] [PubMed]
Miller 1999
- Miller TJ, McGlashan TH, Woods SW, Stein K, Driesen N, Corcoran CM, et al. Symptom assessment in schizophrenic prodromal states. Psychiatric Quarterly 1999;70:273‐87. [DOI] [PubMed] [Google Scholar]
Miller 2003
- Miller TJ, McGlashan TH, Rosen JL, Cadenhead K, Cannon T, Ventura J, et al. Prodromal assessment with the structured interview for prodromal syndromes and the scale of prodromal symptoms: predictive validity, interrater reliability, and training to reliability. Schizophrenia Bulletin 2003;29(4):703‐15. [DOI] [PubMed] [Google Scholar]
Montgomery 1979
- Montgomery SA, Asberg M. A new depression scale designed to be sensitive to change. British Journal of Psychiatry 1979;134:382‐9. [DOI] [PubMed] [Google Scholar]
Morrison 2004
- Morrison AP, French P, Walford L, Lewis SW, Kilcommons A, Green J, et al. Cognitive therapy for the prevention of psychosis in people at ultra‐high risk randomised controlled trial. British Journal of Psychiatry 2004;185(4):291–7. [DOI] [PubMed] [Google Scholar]
Neuchterlein 2008
- Nuechterlein KH, Green MF, Kern RS, Baade LE, Barch DM, Cohen JD. The MATRICS Consensus Cognitive Battery, part 1: test selection, reliability, and validity. American Journal of Psychiatry 2008;165:203–13. [DOI] [PubMed] [Google Scholar]
Overall 1962
- Overall JE, Gorham DR. The Brief Psychiatric Rating Scale. Psychological Reports 1962;10:799‐812. [Google Scholar]
Priebe 1999
- Priebe S, Huxley P, Knight S, Evans S. Application and results of the Manchester Short Assessment of Quality of Life (MANSA). International Journal of Social Psychiatry 1999;45:7–12. [DOI] [PubMed] [Google Scholar]
Pyle 2015
- Pyle M, Stewart SL, French P, Byrne R, Patterson P, Gumley A, et al. Internalised stigma, emotional dysfunction and unusual experiences in young people at risk of psychosis. Early Intervention in Psychiatry 2015;9:133–40. [DOI: 10.1111/eip.12098] [DOI] [PubMed] [Google Scholar]
Reitan 1985
- Reitan RM, Wolfson D. The Halstead‐Reitan Neuropsychological Test Battery: Theory and Clinical Interpretation. Tuscon: Neuropsychology Press, 1985. [Google Scholar]
Review Manager 2014 [Computer program]
- Nordic Cochrane Centre, The Cochrane Collaboration. Review Manager 5 (RevMan 5). Version 5.3. Copenhagen: Nordic Cochrane Centre, The Cochrane Collaboration, 2014.
Rey 1964
- Rey RA. L'examen clinique en psychologique, Vol. Paris: Presses Universitaires de France, 1964. [Google Scholar]
Ruggeri 2015
- Ruggeri M, Bonetto C, Lasalvia A, Fioritti A, Girolamo G, Santonastaso P, et al. Feasibility and effectiveness of a multi‐element psychosocial intervention for first‐ episode psychosis: results from the cluster‐randomised controlled GET UP PIANO trial in a catchment area of 10 million inhabitants. Schizophrenia Bulletin 2015;41(5):1192–203. [DOI] [PMC free article] [PubMed] [Google Scholar]
Schmidt 2015
- Schmidt SJ, Schultze‐Lutter F, Schimmelmann BG, Maric NP, Salokangas RK, Riecher‐Rössler A, et al. EPA guidance on the early intervention in clinical high risk states of psychoses. European Psychiatry 2015;30(3):388‐404. [DOI: 10.1016/j.eurpsy.2015.01.013] [DOI] [PubMed] [Google Scholar]
Schooler 1979
- Schooler N, Hogarty G, Weissman MM. Social Adjustment Scale II (SAS II). In: Hargreaves WA, Attkisson CC, Sorenson JE editor(s). Resource Materials for Community Mental Health Program Evaluators, publication No. (ADM) 79‐328. US Department of Health, Education, and Welfare, 1979:290‐330. [Google Scholar]
Schultze‐Lutter 2009
- Schultze‐Lutter F. Subjective symptoms of schizophrenia in research and the clinic: the basic symptom concept. Schizophrenia Bulletin 2009;35(1):5‐8. [DOI] [PMC free article] [PubMed] [Google Scholar]
Schünemann 2017
- Schünemann HJ, Oxman AD, Vist GE, Higgins JP, Deeks JJ, Glasziou P, et al. on behalf of the Cochrane Applicability and Recommendations Methods Group. Chapter 12: Interpreting results and drawing conclusions. In: Higgins JPT, Churchill R, Chandler J, Cumpston MS (editors), Cochrane Handbook for Systematic Reviews of Interventions version 5.2.0 (updated June 2017). Cochrane, 2017. Available from www.training.cochrane.org/handbook.
Simpson 1970
- Simpson GM, Angus JW. A rating scale for extrapyramidal side effects. Acta Psychiatrica Scandinavica 1970;212:11‐19. [DOI] [PubMed] [Google Scholar]
Sommer 2014
- Sommer IE, Westrhenen R, Begemann MJ, Witte LD, Leucht S, Kahn RS. Efficacy of anti‐inflammatory agents to improve symptoms in patients with schizophrenia: an update. Schizophrenia Bulletin 2014;40(1):181‐91. [DOI: 10.1093/schbul/sbt139] [DOI] [PMC free article] [PubMed] [Google Scholar]
Spreen 1969
- Spreen O, Benton AL. Neurosensory Center Comprehensive Examination for Aphasia (NCCEA). Victoria: University of Victoria Neuropsychology Laboratory, 1969. [Google Scholar]
Spreen 1998
- Spreen O, Strauss E. A Compendium of Neuropsychological Tests: Administration, Norms, and Commentary. 2nd Edition. New York: Oxford, 1998. [Google Scholar]
Sterne 2017
- Sterne JA, Egger M, Moher D, Boutron I (editors). Chapter 10: Addressing reporting biases. In: Higgins JPT, Churchill R, Chandler J, Cumpston MS (editors), Cochrane Handbook for Systematic Reviews of Interventions version 5.2.0 (updated June 2017), Cochrane, 2017. Available from www.training.cochrane.org/handbook.
Stone 2010
- Stone JM, Howes OD, Egerton A, Kambeitz J, Allen P, Lythgoe DJ, et al. Altered relationship between hippocampal glutamate levels and striatal dopamine function in subjects at ultra high risk of psychosis. Biological Psychiatry 2010;68(7):599–602. [DOI: 10.1016/j.biopsych.2010.05.034] [DOI] [PubMed] [Google Scholar]
Streiner 1990
- Streiner DL. Sample size and power in pscyhiatric research. Canadian Journal of Psychiatry 1990;35:616–20. [DOI] [PubMed] [Google Scholar]
Ukoumunne 1999
- Ukoumunne OC, Gulliford MC, Chinn S, Sterne JA, Burney PG. Methods for evaluating area‐wide and organisation‐based intervention in health and health care: a systematic review. Health Technology Assessment 1999;3(5):iii‐92. [PubMed] [Google Scholar]
Van der Does 2002
- Does JW. The Dutch version of the Beck Depression Inventory‐ (BDI‐IINL). 2nd Edition. Lisse: Swets Test Publishers, 2002. [Google Scholar]
Velligan 2008
- Velligan DI, Diamond PM, Maples NJ, Mintz J, Li X, Glahn DC, et al. Comparing the efficacy of interventions that use environmental supports to improve outcomes in patients with schizophrenia. Schizophrenia Research 2008;102(1‐3):312–9. [DOI] [PMC free article] [PubMed] [Google Scholar]
Wechsler 1999
- Wechsler D. Wechsler abbreviated scale of intelligence (WASI‐III) manual. San Antonio: Psychological Corporation, 1999. [Google Scholar]
Weissman 1976
- Weissman MM, Bothwell S. Assessment of social adjustment by patient self report. Archives of General Psychiatry 1976;33:1111–15. [DOI] [PubMed] [Google Scholar]
WHO 2010
- WHO. International Statistical Classification of Diseases and Related Health Problems, 10th revision. Geneva: World Health Organization, 2010. [Google Scholar]
Wiersma 1998
- Wiersma D, Nienhuis FJ, Slooff CJ, Giel R. Natural course of schizophrenic disorders: a 15‐year followup of a Dutch incidence cohort. Schizophrenia Bulletin 1998;24(1):75–85. [DOI] [PubMed] [Google Scholar]
Winter 1999
- Winter LB, Steer R, Jones‐Hicks L, Beck AT. Screening for major depressive disorder in adolescent medical outpatients with the Beck Depression Inventory for Primary Care. Journal of Adolescent Health 1999;24:389–94. [DOI] [PubMed] [Google Scholar]
Wittchen 2011
- Wittchen HU, Jacobi F, Rehm J, Gustavsson A, Svensson M, Jönsson B, et al. The size and burden of mental disorders and other disorders of the brain in Europe 2010. European Neuropsychopharmacology 2011;21(9):655–79. [DOI] [PubMed] [Google Scholar]
Wunderink 2013
- Wunderink L, Nieboer RM, Wiersma D, Sytema S, Nienhuis FJ. Recovery in remitted first‐episode psychosis at 7 years of follow‐up of an early dose reduction/discontinuation or maintenance treatment strategy long‐term follow‐up of a 2‐year randomised clinical trial. JAMA Psychiatry 2013;70(9):913‐20. [DOI: 10.1001/jamapsychiatry.2013.19] [DOI] [PubMed] [Google Scholar]
Xia 2009
- Xia J, Adams CE, Bhagat N, Bhagat V, Bhoopathi P, El‐Sayeh H, et al. Loss to outcomes stakeholder survey: the LOSS study. Psychiatric Bulletin 2009;33(7):254‐7. [Google Scholar]
Xu 2015
- Xu XJ, Jiang GS. Niacin‐respondent subset of schizophrenia – a therapeutic review. European Review for Medical and Pharmacological Sciences 2015;19(6):988‐97. [PubMed] [Google Scholar]
Young 1978
- Young RC, Biggs JT, Ziegler VE, Meyer DA. A rating scale for mania: reliability, validity and sensitivity. British Journal of Psychiatry 1978;133:429‐35. [DOI] [PubMed] [Google Scholar]
Yung 1998
- Yung AR, Phillips LJ, McGorry PD, McFarlane CA, Francey S, Harrigan S, et al. Prediction of psychosis: a step towards indicated prevention of schizophrenia. British Journal of Psychiatry 1998;172 (Suppl. 33):14–20. [PubMed] [Google Scholar]
Yung 2004
- Yung AR, Phillips LJ, Yuen HP, McGorry PD. Risk factors for psychosis in an ultra high‐risk group: psychopathology and clinical features. Schizophrenia Research 2004;67(2‐3):131‐42. [DOI] [PubMed] [Google Scholar]
Yung 2005
- Yung AR, Yuen HP, McGorry PD, Phillips LJ, Kelly D, Dell’Olio M, et al. Mapping the onset of psychosis: the Comprehensive Assessment of At‐Risk Mental States. Australian & New Zealand Journal of Psychiatry 2005;39(11‐12):964‐71. [DOI] [PubMed] [Google Scholar]
References to other published versions of this review
Bošnjak 2016
- Bošnjak D, Kekin I, Hew J, Kuzman MR. Early interventions for prodromal stage of psychosis. Cochrane Database of Systematic Reviews. John Wiley & Sons, Ltd, 2016, issue 6. [DOI: 10.1002/14651858.CD012236] [DOI] [PMC free article] [PubMed]