Abstract
Autophagy has been shown to be a key cellular event controlling tumor growth in different neoplasms including hepatocellular carcinoma (HCC). Although this biological role of autophagy has been clearly established, the mechanism underlying its regulation remains elusive. Here, we demonstrate a role of sulfatase 2 (SULF2), a 6‐O‐endosulfatase modulating various growth factors and cytokine‐related signaling pathways controlling tumor cell proliferation and survival, in the regulation of autophagy in HCC cells. SULF2 increased autophagosome formation, shown by increased LC3B‐II protein and green fluorescent protein–LC3 puncta. Increased fusion between autophagosomes and lysosomes/lysosomal enzymes, higher expression of lysosomal membrane protein, and an increase in autolysosomes were also shown by western blot, immunofluorescence, and electron microscopy of SULF2‐expressing cells, indicating enhanced autophagic flux. In contrast, RNA‐interference silencing of SULF2 in Huh7 cells induced lysosomal membrane permeabilization with diffuse cytosolic staining of cathepsin D and punctate staining of galectin‐3. Analysis of the mechanism showed that inhibition of lysosome‐associated protein transmembrane 4 beta (LAPTM4B), a gene induced by SULF2, resulted in decreased autophagosome formation, decreased fusion between autophagosomes and lysosomes, and increased lysosomal membrane permeabilization. Interestingly, down‐regulation of LAPTM4B also phenocopies the knockdown of SULF2, significantly reducing cell viability and colony formation. Conclusion: Our results demonstrate a role for SULF2 in the regulation of autophagic flux that is mediated through LAPTM4B induction in HCC cells, and provide a foundation for future translational efforts targeting autophagy in liver malignancies.
Abbreviations
- DMSO
dimethyl sulfoxide
- GFP
green fluorescent protein
- HCC
hepatocellular carcinoma
- HEK
human embryonic kidney
- LAMP1
lysosome‐associated membrane protein 1
- LAPTM
lysosome‐associated protein transmembrane
- LMP
lysosomal membrane permeabilization
- MTT
3‐(4,5‐dimethylthiazol‐2‐yl)‐2,5‐diphenyltetrazolium bromide
- PARP
poly(adenosine diphosphate ribose) polymerase
- PBS
phosphate‐buffered saline
- PCR
polymerase chain reaction
- shRNA
short hairpin RNA
- siRNA
small interfering RNA
- SULF2
sulfatase 2
Autophagy plays a key role in maintaining cellular homeostasis in all living cells by removing and recycling damaged intracellular components.1, 2 The perturbation of autophagic activity is known to be involved in the pathogenesis of multiple diseases, including neoplastic disease.1, 3, 4, 5, 6
When normal cells are not able to clear cellular debris, dysfunctional organelles, and misfolded proteins, chronic tissue damage that can lead to malignant transformation occurs. At the early stages of carcinogenesis, transformed cells can be sensed and eliminated by autophagy. At later disease stages when intracellular components such as nutrition and oxygen are relatively deficient, activation of autophagy helps cancer cells adapt and survive.1, 2, 7 Thus, increasing our understanding of the mechanism regulating the activation of autophagy will be key for the development of new therapeutic approaches targeting this cellular event in different tumors.
Here, we provide evidence of a mechanism involving sulfatase 2 (SULF2) expression in the regulation of autophagy in hepatocellular carcinoma (HCC) cells. SULF2 is an enzyme that modulates signaling pathways by selectively removing 6‐O‐sulfate groups from the heparan sulfate chains of heparan sulfate proteoglycans (HSPGs), which serve as co‐receptors or sequestration sites for numerous growth factor and cytokine signaling ligands.8 Our data unveiled a pathway driven by SULF2 that controls autophagy in HCC cells by inducing the expression of lysosome‐associated protein transmembrane 4 beta (LAPTM4B). We report in this study that LAPTM4B is an essential effector for this role of SULF2 in the regulation of autophagy in HCC cells.
Results
SULF2 Induces Autophagy in HCC Cells
Overexpression of SULF2 promotes autophagy in HCC cells (Fig. 1). Both Huh7 scrambled short hairpin RNA (shRNA) transfected cells and Hep3B SULF2 plasmid transfected cells, which express high levels of SULF2 protein, showed higher LC3B‐II and lower p62 on western blot (Fig. 1A), demonstrating an increased autophagy in cells overexpressing SULF2. When treated with bafilomycin‐A1, LC3B‐II was further increased. Bafilomycin‐A1 blocks fusion between autophagosomes and lysosomes in the late phase of autophagy by inhibiting lysosomal vacuolar‐type H+‐adenosine triphosphatase. This result suggests that increased LC3B‐II in SULF2‐expressing cells is not due to the blocking of autophagic flux, but occurs due to increased autophagosome formation.
Figure 1.
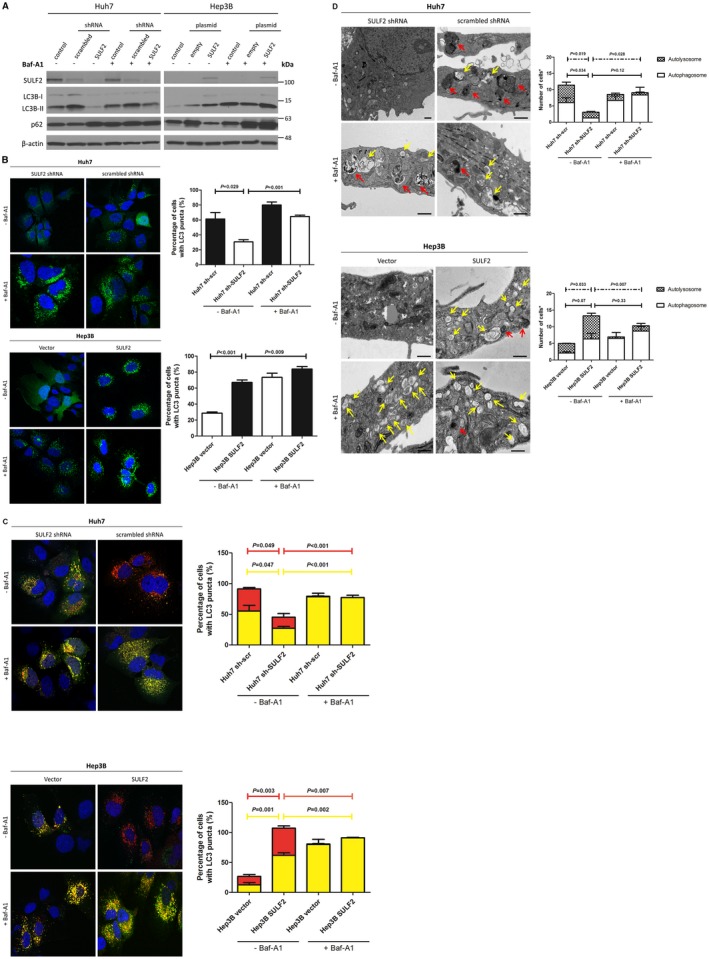
SULF2 induces autophagic flux. (A) Western blot analysis shows protein‐expression changes of LC3B conversion and p62 levels according to SULF2 status in Huh7 and Hep3B cells in the absence or presence of bafilomycin‐A1. (B) Confocal microscopic images shows GFP‐LC3 puncta according to SULF2 status in Huh7 and Hep3B cells in the absence or presence of bafilomycin‐A1. (C) Tandem RFP‐GFP‐LC3B assay shows autophagosomes (RFP+/GFP+, yellow puncta) and autolysosomes (RFP+/GFP‐, red puncta) according to SULF2 status in Huh7 and Hep3B cells in the absence or presence of bafilomycin‐A1. Yellow bar indicates autophagosomes and red bar indicates autolysosomes. (D) Ultrastructural evidence of autophagy according to SULF2 status in Huh7 and Hep3B cells in the absence or presence of bafilomycin‐A1. Yellow arrows indicate autophagosomes and red arrows indicate autolysosomes (scale bars: 500 nm). Bafilomycin‐A1 (100 nM) was treated to inhibit the fusion between autophagosomes and lysosomes. Quantification was performed by counting a total of 50 cells in 10 random fields (5 cells/field) and presented as bar graphs (mean ± SEM). Abbreviations: GFP, green fluorescent protein; RFP, red fluorescent protein; SEM; standard error of the mean; SULF2, sulfatase 2.
Confocal microscopy of HCC cells stably expressing green fluorescent protein (GFP)‐LC3 also confirmed increased autophagosome formation in SULF2‐expressing cells (Fig. 1B). The proportion of cells showing LC3 puncta (> 30 puncta/cell) was significantly higher in SULF2‐expressing cells, and the proportion further increased after bafilomycin‐A1 treatment.
To demonstrate further whether the increased autophagosomes in SULF2‐expressing cells complete the process of autophagic flux through fusion with lysosomes, the red fluorescent protein (RFP)‐GFP‐LC3B assay was performed. Both autophagosome (yellow puncta) and autolysosomes (red puncta) were increased in SULF2‐expressing cells (Fig. 1C). Finally, electron microscopic studies revealed that autophagosomes and autolysosomes are both increased in SULF2‐overexpressing cells (Fig. 1D). These results indicate that the increase in autophagosomes in cells overexpressing SULF2 undergo complete autophagic flux.
SULF2 Depletion Is Associated With Disrupted Lysosomal Function
Because the increase in autolysosomes was significantly higher in SULF2‐expressing cells, we investigated the functional underpinnings of this observation by assessing the levels of proteins associated with lysosomes. The expression of lysosome‐associated membrane protein 1 (LAMP1), was decreased in whole cell lysates of cells with silenced or low SULF2 expression. No differences were observed in the levels of the uncleaved apoptotic initiator caspases, caspase‐8 and caspase‐9, or poly(adenosine diphosphate ribose) polymerase (PARP). Further, the cleaved forms of the caspases and PARP were not seen in the HCC cell lines by western blot (Fig. 2). Expression of Bak and Bax proteins also did not significantly differ between SULF2‐negative and SULF2‐positive HCC cells. Bcl‐2 proteins were not expressed in either the Huh7 or Hep3B cells. Significant differences were seen in the levels of the lysosomal enzymes cathepsin D and cathepsin B, which were increased in silenced or low SULF2‐expressing cells (Fig. 2).
Figure 2.
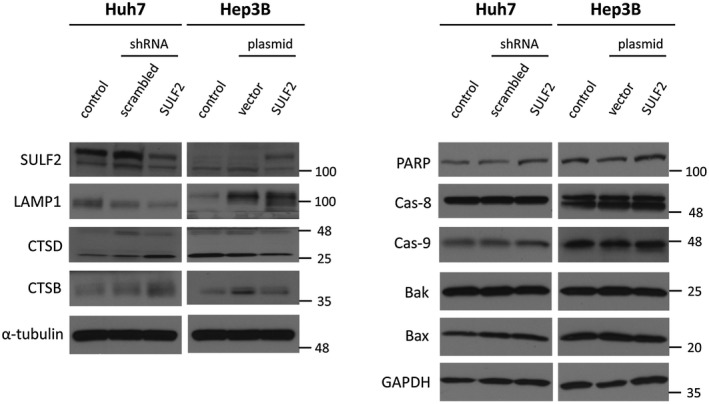
SULF2 is associated with expression of lysosome‐related proteins. Western blot analyses show protein expressions of LAMP1, cathepsin D, and cathepsin B (left column) according to SULF2 status in Huh7 and Hep3B cells. Common markers for apoptosis (right column) are also assessed. Abbreviations: Cas‐8, caspase‐8; Cas‐9, caspase‐9; CTSB, cathepsin B; CTSD, cathepsin D; GAPDH, glyceraldehyde 3‐phosphate dehydrogenase; LAMP1, lysosome‐associated membrane protein 1; SULF2, sulfatase 2.
A potential explanation for the lower levels of LAMP1 and increase in cathepsin D and cathepsin B in cells with silenced or low SULF2 expression is that suppression of SULF2 is associated with disruption of lysosomal integrity and increased release of lysosomal enzymes (i.e., lysosomal membrane permeabilization [LMP]). To confirm this hypothesis, we performed immunofluorescence analysis.
In SULF2‐expressing cells, the colocalization between autophagosomes (anti‐LC3B, red) and lysosomes (anti‐LAMP1, green) was significantly higher than in SULF2‐silenced or negative cells (Fig. 3A). Similarly, when cells were stained for autophagosomes (anti‐LC3B, red) and lysosomal enzymes (anti‐cathepsin D, green), significantly higher colocalization between the two proteins was again observed in SULF2‐expressing cells (Fig. 3B).
Figure 3.
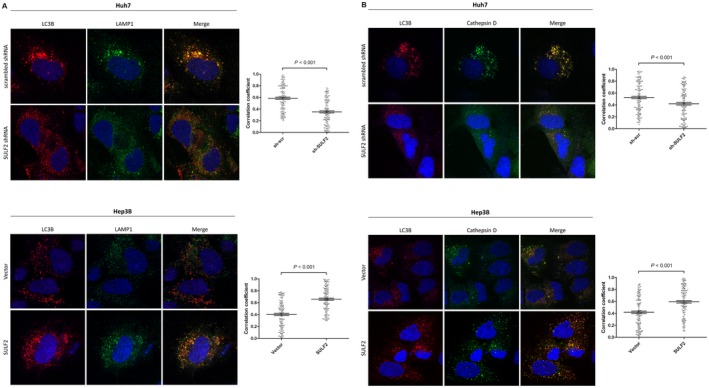
SULF2 is associated with increased fusion between autophagosomes and lysosomes/lysosomal enzymes. (A) Merged immunofluorescence images show autophagosomes (anti‐LC3B, red) and lysosomes (anti‐LAMP1, green) according to SULF2 status in Huh7 and Hep3B cells. (B) Merged immunofluorescence images show autophagosomes (anti‐LC3B, red) and lysosomal enzyme (anti‐cathepsin D, green) according to SULF2 status in Huh7 and Hep3B cells. The correlation coefficients of colocalization between autophagosomes and lysosomes/lysosomal enzymes of 150 cells (50 cells × 3 independent experiment) are presented as dot plots (mean ± SEM). Abbreviations: LAMP1, lysosome‐associated membrane protein 1; SEM, standard error of the mean; SULF2, sulfatase 2.
Next, the cells were labeled with anti‐cathepsin D and anti‐LAMP1 antibody to demonstrate the presence of LMP. In SULF2‐expressing cells, more colocalization between cathepsin D and LAMP1 was observed (Fig. 4A). On the other hand, SULF2‐silenced Huh7 cells showed diffuse cytosolic staining of cathepsin D and irregular LAMP1 staining, a characteristic finding of LMP (Fig. 4A, lower panel in Huh7). To verify this finding, we additionally performed a galectin‐3 puncta formation assay. When the lysosomes are damaged, galectin‐3 translocates from the cytosol to the disrupted lysosomes, which induces a change in its staining pattern from diffuse to punctate form. SULF2‐positive Huh7 cells showed diffuse cytosolic galectin‐3 staining (Fig. 4B, upper panel in Huh7). In contrast, increased colocalization between punctate galectin‐3 and LAMP1 was identified in the SULF2‐silenced Huh7 cells, again suggesting LMP (Fig. 4B, lower panel in Huh7).
Figure 4.
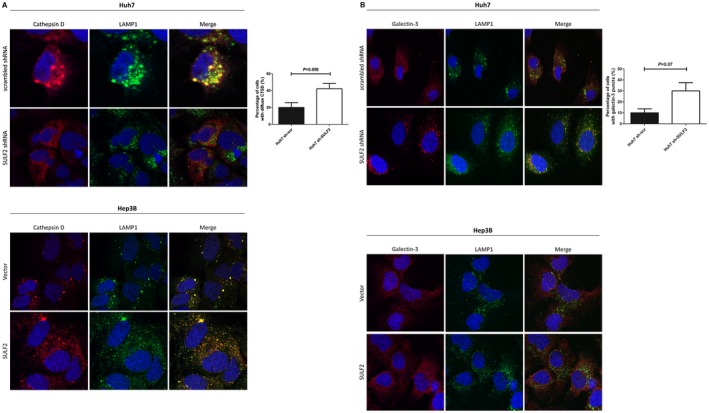
SULF2 inhibition is associated with LMP. (A) Merged immunofluorescence images show lysosomal enzyme (anti‐cathepsin D, red) and lysosomes (anti‐LAMP1, green) according to SULF2 status in the HCC cells. Huh7 cells transfected with scrambled shRNA show more colocalization (upper panel). Huh7 cells transfected with SULF2 shRNA show diffuse cytosolic staining of cathepsin D (lower panel). Control Hep3B cells show less colocalization (upper panel). Hep3B cells transfected with SULF2 plasmid show more colocalization (lower panel). (B) Merged immunofluorescence images show galectin‐3 (anti‐galectin‐3, red) and lysosomes (anti‐LAMP1, green) according to SULF2 status in the HCC cells. Huh7 cells transfected with scrambled shRNA show diffuse cytosolic staining for galectin‐3 (upper panel). Huh7 cells transfected with SULF2 shRNA show punctate staining for galectin‐3 colocalized with LAMP1 (lower panel). Control Hep3B cells and Hep3B cells transfected with SULF2 plasmid show diffuse cytosolic staining for galectin‐3. The Huh7 cells showing diffuse cytosolic staining of cathepsin D or punctate staining of galectin‐3 were counted by examining a total of 50 cells in 10 random fields (5 cells/field) and presented as a bar graph (mean ± SEM). Abbreviation: CTSD, cathepsin D.
In Hep3B cells transfected with SULF2 plasmid, a significantly higher rate of colocalization was also observed between cathepsin D and LAMP1 (Fig. 4A, lower panel in Hep3B). However, in control vector–transfected Hep3B cells, LMP was not evident (Fig. 4A, upper panel in Hep3B). When Hep3B cells were stained for galectin‐3 and LAMP1, similar findings were observed. Although SULF2‐overexpressed Hep3B cells showed more staining for lysosomes (Fig. 4B, lower panel in Hep3B), both SULF2‐negative and SULF2‐positive Hep3B cells only showed diffuse cytosolic staining for galectin‐3, indicating no significant lysosomal damage in these cells (Fig. 4B).
Consistent with these western blot and immunofluorescence findings, cathepsin D and cathepsin B activity were significantly higher in the whole cell lysates of HCC cells with low SULF2 levels (Fig. 5). Therefore, depletion of SULF2 substantially disrupts lysosomal function.
Figure 5.
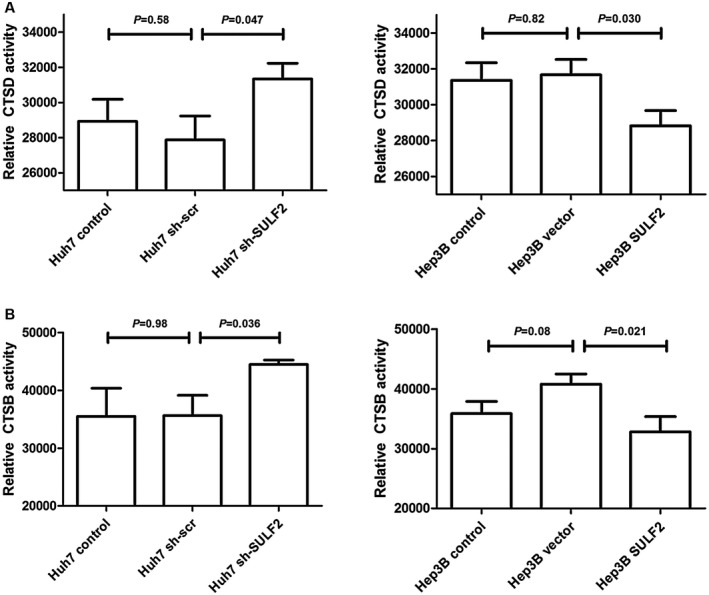
SULF2 is associated with cathepsin D (A) and cathepsin B (B) activity. Abbreviations: CTSB, cathepsin B; CTSD, cathepsin D; SULF2, sulfatase 2.
LAPTM4B Mediates SULF2‐Associated Autophagy
Next, we sought to identify interacting molecules mediating SULF2‐induced autophagy. Previously, we reported HCC‐associated genes that are also correlated with SULF2 expression.9 Lysosome‐associated protein transmembrane 5 (LAPTM5) was positively correlated with SULF2 expression in our previous study (r = 0.42). Although its function is not fully known, LAPTM4B also belongs to the LAPTM family and shares several characteristics with LAPTM5.10 In addition, LAPTM4B is known to be associated with poor prognosis in HCC, whereas LAPTM5 is primarily expressed and functional in bone marrow and blood cells. Therefore, we assessed the expression of both LAPTM5 and LAPTM4B in HCC cells.
Quantitative real‐time polymerase chain reaction (PCR) analysis showed that both LAPTM5 and LAPTM4B are positively associated with SULF2 expression in HCC cells (Fig. 6A). We focused our subsequent experiments on LAPTM4B and identified that LAPTM4B protein levels are also increased in SULF2‐expressing HCC cells (Fig. 6B).
Figure 6.
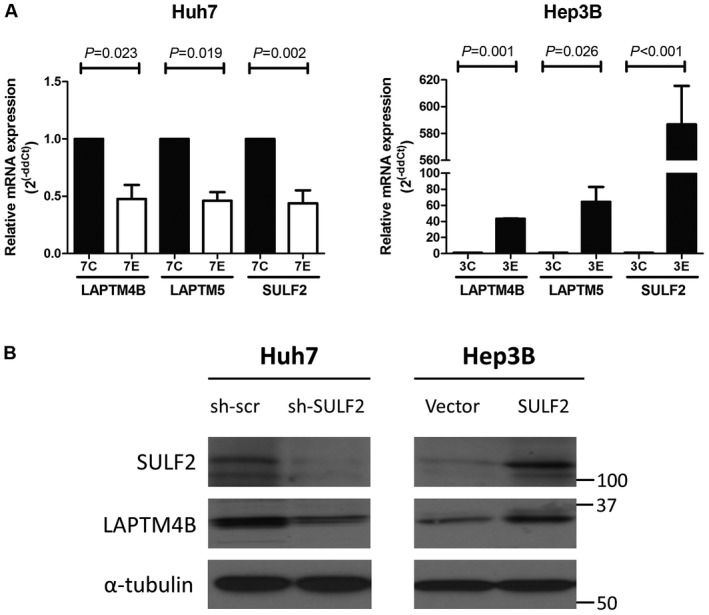
SULF2 is positively correlated with LAPTM4B expression. (A) Quantitative real‐time PCR analysis shows mRNA expression of LAPTM4B and LAPTM5 according to SULF2 status in Huh7 and Hep3B cells. 7C represents Huh7 cells transfected with scrambled shRNA and 7E represents Huh7 cells transfected with SULF2 shRNA. 3C represents Hep3B cells transfected with control plasmid and 3E represents Hep3B cells transfected with SULF2 plasmid. (B) Western blot analysis shows protein expression of LAPTM4B according to SULF2 status in Huh7 and Hep3B cells. Abbreviations: LAPTM4B, lysosome‐associated protein transmembrane 4 beta; LAPTM5, lysosome‐associated protein transmembrane 5; PCR, polymerase chain reaction; SULF2, sulfatase 2.
To determine the impact of LAPTM4B on autophagy, SULF2‐expressing cells were treated with small interfering RNA (siRNA) targeting LAPTB4B. Forced depletion of LAPTM4B resulted in decreased autophagy, as evidenced by low LC3B‐II expression on western blot (Fig. 7A). In contrast, similar to the result seen with SULF2 silencing, cathepsin D was increased and LAMP1 was decreased following LAPTM4B siRNA treatment, suggesting that both SULF2 silencing and LAPTM4B depletion induce LMP. SULF2 protein levels did not change after forced depletion of LAPTM4B; thus, SULF2 appears to be upstream of LAPTM4B in this signaling axis.
Figure 7.
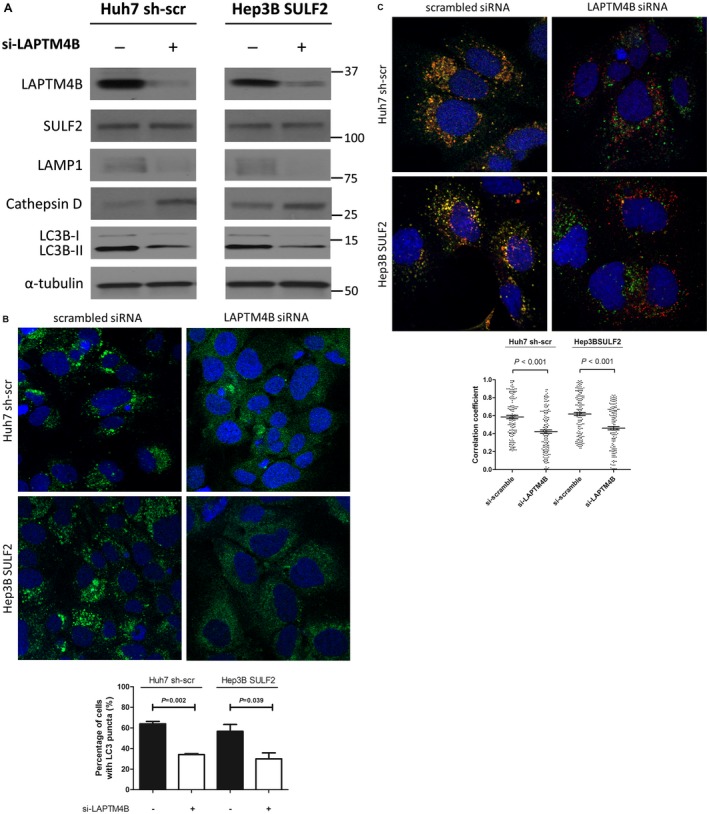
LAPTM4B inhibition reverses the effect of SULF2‐induced changes in autophagy. (A) Western blot analysis shows decreased LAMP1 and increased cathepsin D in SULF2‐positive Huh7 cells and SULF2‐transfected Hep3B cells that are depleted of LAPTM4B. (B) Confocal microscopic images show GFP‐LC3 puncta according to LAPTM4B status in SULF2‐positive Huh7 cells and SULF2‐transfected Hep3B cells. (C) Merged immunofluorescence images show autophagosomes (anti‐LC3B, red) and lysosomes (anti‐LAMP1, green) according to LAPTM4B status in SULF2‐positive Huh7 cells and SULF2‐transfected Hep3B cells. The LC3 puncta‐positive cells are counted by examining a total of 50 cells in 10 random fields (5 cells/field) and presented as bar graphs (mean ± SEM). The correlation coefficients of colocalization between autophagosomes and lysosomes of 150 cells (50 cells × 3 independent experiment) are presented as dot plots (mean ± SEM). Abbreviations: GFP, green fluorescent protein; LAMP1, lysosome‐associated membrane protein 1; LAPTM4B, lysosome‐associated protein transmembrane 4 beta; SEM, standard error of the mean; SULF2, sulfatase 2.
Next, to demonstrate the effect of LAPTM4B on autophagosome formation, SULF2‐expressing cells that were also stably transfected with GFP‐LC3 were treated with LAPTM4B siRNA. Compared with control, LAPTM4B siRNA treatment significantly reduced autophagosome formation, resulting in fewer cells with positive GFP‐LC3 puncta (Fig. 7B).
To investigate whether LAPTM4B mediates SULF2‐dependent autophagic flux, including fusion between autophagosomes and lysosomes, SULF2‐expressing cells were treated with scrambled versus LAPTM4B siRNA and stained for autophagosomes (anti‐LC3B, red) and lysosomes (anti‐LAMP1, green). SULF2‐expressing cells treated with scrambled siRNA showed robust colocalization between autophagosomes (anti‐LC3B, red) and lysosomes (anti‐LAMP1, green), and this high degree of colocalization decreased significantly after LAPTM4B siRNA treatment (Fig. 7C).
Finally, cells were labeled with markers for LMP. SULF2‐expressing control cells showed more colocalization between the lysosomal enzyme cathepsin D (anti‐cathepsin D, red) and lysosomes (anti‐LAMP1, green) (Fig. 8A, left column). By contrast, LAPTM4B knockdown decreased colocalization between the two markers; instead, cells showing diffuse cytosolic cathepsin D and irregular LAMP1 staining were significantly increased (Fig. 8A, right column). The galectin‐3 puncta formation assay showed consistent results; SULF2‐expressing cells treated with LAPTM4B siRNA showed significantly more galectin‐3 puncta, suggesting LMP (Fig. 8B).
Figure 8.
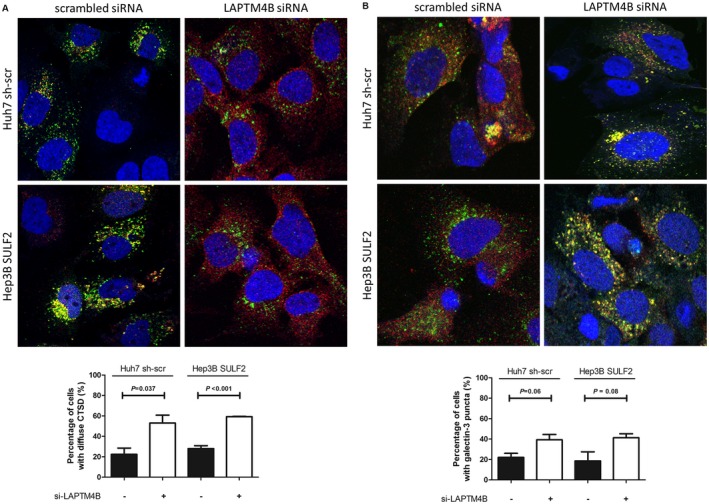
LAPTM4B depletion induces LMP. (A) Merged immunofluorescence images show lysosomal enzyme (anti‐cathepsin D, red) and lysosomes (anti‐LAMP1, green) according to LAPTM4B status in SULF2‐positive Huh7 cells and SULF2‐transfected Hep3B cells. (B) Merged immunofluorescence images show galectin‐3 (anti‐galectin‐3, red) and lysosomes (anti‐LAMP1, green) according to LAPTM4B status in SULF2‐positive Huh7 cells and SULF2‐transfected Hep3B cells. The cells showing diffuse cytosolic staining of cathepsin D or punctate staining of galectin‐3 were counted by examining a total of 50 cells in 10 random fields (5 cells/field) and presented as a bar graph (mean ± SEM). Abbreviations: CTSD, cathepsin D; LAMP1, lysosome‐associated membrane protein 1; LAPTM4B, lysosome‐associated protein transmembrane 4 beta; LMP, lysosomal membrane permeabilization; SEM, standard error of the mean; SULF2, sulfatase 2.
We also attempted to characterize the distribution and colocalization of LAPTM4B protein by immunofluorescence. The anti‐LAPTM4B antibody that we used for identifying protein expression was only usable for western blot. Another antibody that we tried was reportedly designed for both western blot and immunofluorescence. However, unfortunately, in initial western blot experiments, the LAPTM4B protein was not identified in the region corresponding to the predicted molecular weight of LAPTM4B protein in either HCC cells or human embryonic kidney (HEK) 293 cells, which were used as a positive control. Consequently, we were unable to reliably assess the localization of LAPTM4B by immunofluorescence.
Inhibition of the SULF2‐LAPTM4B Axis Suppresses Growth of SULF2‐Expressing HCC Cells
Next, to assess the effects of the SULF2‐LAPTM4B axis on HCC cell growth, SULF2‐expressing Hep3B cells were subjected to MTT (3‐[4,5‐dimethylthiazol‐2‐yl]‐2,5‐diphenyltetrazolium bromide) analysis after treatment with the scrambled siRNA, LAPTM4B siRNA, SULF2 siRNA, or both LAPTM4B and SULF2 siRNAs for 48 hours. Compared with the control, the percentage of viable cells was significantly lower in LAPTM4B siRNA‐treated cells (81.9% ± 7.1%; P < 0.001) and SULF2 siRNA‐treated cells (71.5% ± 6.1%; P < 0.001). When cells were treated simultaneously with both LAPTM4B and SULF2 siRNA, the cell viability was decreased further (61.2% ± 10.7%; Fig. 9A).
Figure 9.
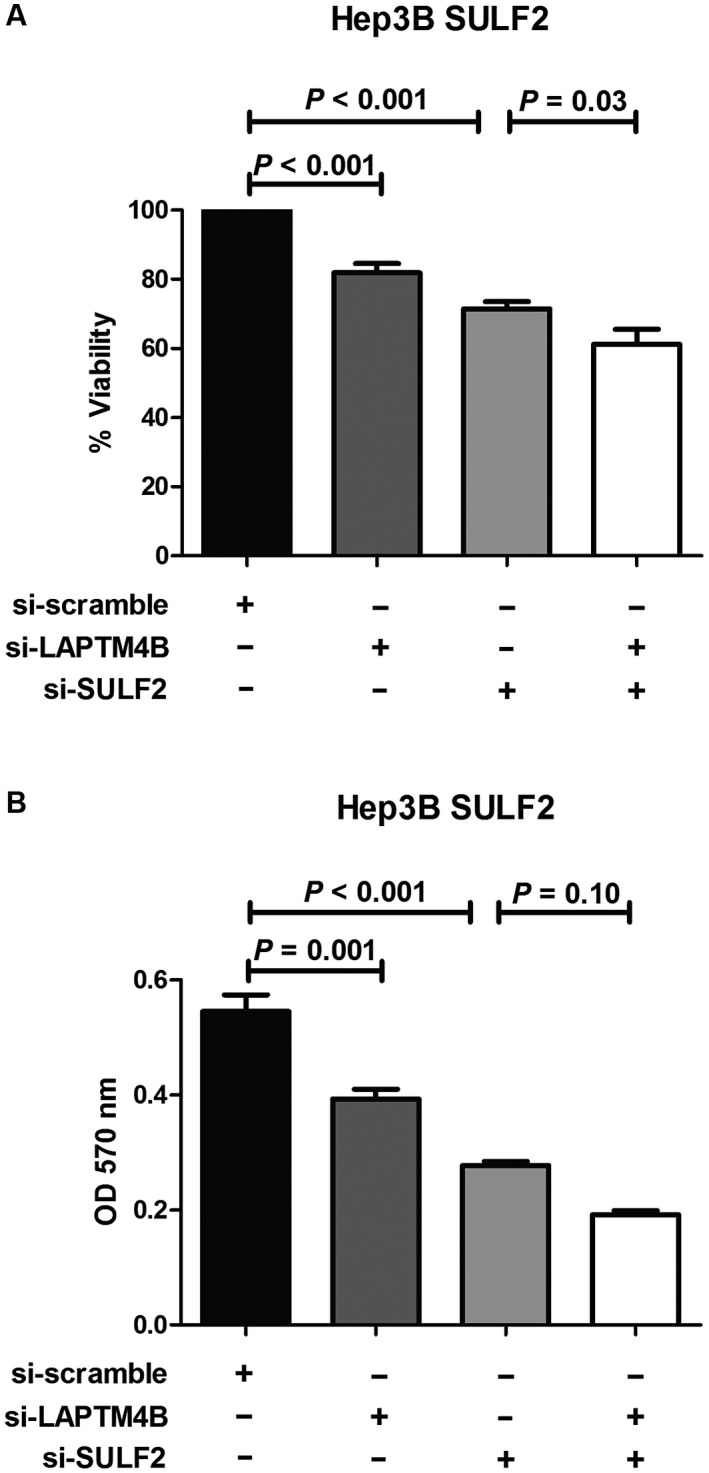
LAPTM4B and SULF2 depletion inhibits proliferation and colony formation in HCC cells. MTT assay shows decreased viability after 48 hours (A) and cell transformation assay shows decreased colony formation after 7 days (B) in SULF2‐transfected Hep3B cells treated with scrambled siRNA, LAPTM4B siRNA, SULF2 siRNA, and combined LAPTM4B and SULF2 siRNA. Values for cell viability (percentage of control) and colony formation (absorbance at 570 nm) are presented as a bar graph (mean ± SEM). Abbreviations: LAPTM4B, lysosome‐associated protein transmembrane 4 beta; MTT, 3‐(4,5‐demerthylthiazol‐2‐yl)‐2,5‐diphenyltetrazolium bromide; SEM, standard error of the mean; siRNA; small interfering RNA; SULF2, sulfatase 2.
In addition, we tested the effect of suppression of LAPTM4B, SULF2, or both LAPTM4B and SULF2 on the ability of the SULF2‐overexpressing Hep3B cell line to grow in soft agar. Temporary knockdown of these genes with siRNA markedly inhibited anchorage‐independent growth as compared with negative control (Fig. 9B). In particular, combined LAPTM4B and SULF2 siRNA treatment led to the largest decrease in colony formation compared with the LAPTM4B siRNA–only or SULF2 siRNA–only treated group.
Taken together, our results suggest that activation of the SULF2‐LAPTM4B axis enhances the complete autophagic process in HCC cells, which leads to the progression of HCC. Perturbing autophagic flux by inhibition of the SULF‐LAPTM4B axis resulted in LMP as well as in decreased cell viability and colony formation (Fig. 10).
Figure 10.
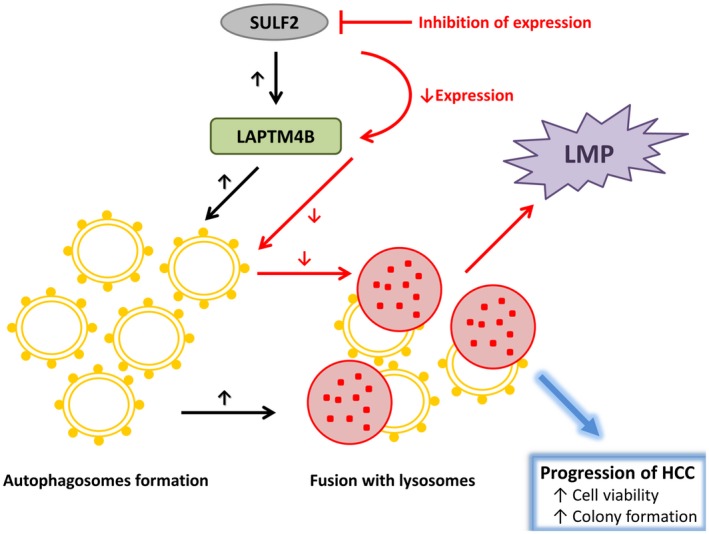
Working model for the SULF2‐LAPTM4B‐dependent autophagic pathway in HCC cells. Abbreviations: HCC, hepatocellular carcinoma; LAPTM4B, lysosome‐associated protein transmembrane 4 beta; SULF2, sulfatase 2.
Discussion
Autophagy is a fundamental process that is needed for all living cells, including cancer cells, to survive.1, 2, 3 Autophagy helps to maintain an optimal cellular environment by degrading and removing unnecessary or dysfunctional intracellular components. If this machinery does not function in a synchronized manner, abnormal cells appear, accumulate, and finally dominate the environment, leading to development of diseases such as cancer.1, 2 Various molecular pathways are involved in autophagy, including mammalian target of rapamycin and beclin 1‐interacting complex.1, 2 These pathways elaborately regulate autophagy in response to external stimuli.
SULF2, an enzyme that specifically removes the 6‐O‐sulfate groups of HSPGs, also modulates the function of various intracellular pathways by altering the binding sites of many heparin‐binding growth factors and cytokines.8 Our previous study identified that SULF2 increases resistance to chemotherapeutics by activating the phosphatidylinositol 3‐kinase‐Akt pathway.8, 11 The acquisition of resistance to drug treatment is also a typical consequence of autophagy.12 Therefore, we investigated whether the expression levels of SULF2 have an influence on the autophagic flux in HCC cells.
SULF2‐expressing cells showed a significantly higher number of autophagosomes and autolysosomes compared with controls, suggesting that SULF2 expression results in “complete” autophagic flux, comprising the entire sequence from autophagosome formation to lysosomal degradation. Because the increment of autolysosome numbers was higher than that of autophagosomes, we specifically focused on lysosomes. We found that SULF2‐expressing cells clearly showed more colocalization between (1) autophagosomes and lysosomes (autolysosome formation) and (2) lysosomes and lysosomal enzymes (enzymatic degradation), which again suggests that the entire autophagic process is enhanced without interruption. However, no direct relationship between SULF2 expression and lysosomal fusion has been reported thus far. Consequently, we sought to identify a potential mediator that is associated with both SULF2 and lysosomal fusion.
In our previous study, one of the genes that was positively correlated with SULF2 was LAPTM5.9 However, LAPTM5 mostly distributes in the hematologic system and is involved in adult hematopoiesis or embryogenesis,10 and thus has been studied in hematologic malignancies.13, 14 However, LAPTM4B, another gene that belongs to the LAPTM family and shares several characteristics with LAPTM5,10 has been investigated widely for its clinical significance in various solid cancers including HCC.15, 16 In fact, LAPTM4B is structurally similar to LAPTM5 and is one of the top interactants of LAPTM5.17
LAPTM4B belongs to the LAPTM4B/LAPTM5 transporter family and is located in the late endosomes and lysosomes.18 The role of LAPTM4B is not fully understood; however, it is thought to be involved in maintaining optimal lysosomal function.19 Previous studies identified LAPTM4B as a potential oncogene, as overexpression was associated with increased colony formation, cell proliferation, migration, and invasion.16, 20 Furthermore, in human specimens, higher levels of LAPTM4B were observed in HCC compared with the adjacent normal tissue and were associated with poor clinical outcomes.16, 21 Because we have shown that SULF2 expression positively correlated with expression of LAPTM4B, these results are consistent with our previous report of poor clinical outcomes in patients with HCCs expressing SULF2.11, 22, 23
In this manuscript, we have explored the functional interaction between SULF2 and the effects of LAPTM4B on autophagy. We found that LAPTM4B acts as a crucial mediator of enhanced autophagy in SULF2‐expressing cells. In contrast, inhibition of LAPTM4B decreased autophagy but instead induced LMP. This result is comparable to the previous study by Li et al. that identified that LAPTM4B depletion was associated with increased LAMP and decreased autophagic flux in breast cancer cell lines.24 In addition, when LAPTM4B and SULF2 are simultaneously suppressed, cell viability and colony formation were significantly decreased in SULF2‐expressing HCC cells, compared with suppressing LAPTM4B or SULF2 alone. Because LAPTM4B and SULF2 have separately been shown to increase HCC cell proliferation and colony formation,8, 9, 11, 15, 16, 20, 21, 22, 24 our results suggest that inhibition of SULF2‐LAPTM4B axis could exert a greater effect on HCC progression by additionally modulating autophagy.
One of the limitations of our study is that the anti‐LAPTM4B antibody that we used for identifying protein expression was only usable for western blot; thus, we were not able to demonstrate the distribution of LAPTM4B protein by immunofluorescence.
In conclusion, activation of a SULF2‐LAPTM4B axis contributes to enhanced autophagic flux in HCC cells. LMP occurs when the SULF2‐LAPTM4B axis is suppressed. Inhibition of the SULF2‐LAPTM4B‐dependent autophagic pathway could be a therapeutic target in HCC patients.
Materials and Methods
Cell Lines
Human hepatocellular carcinoma cell lines, Huh7 and Hep3B, were used in this experiment. Huh7 was purchased from the Japanese Collection of Research Bioresources Cell Bank and cultured in Dulbecco's modified Eagle's medium (DMEM; Gibco) supplemented with 10% fetal bovine serum. Hep3B was purchased from American Type Culture Collection (Manassas, VA) and cultured in minimum essential medium (MEM; Gibco) supplemented with 10% fetal bovine serum. Both cell lines were grown at 37°C in a 5% CO2 incubator.
The cells were seeded in the 10‐cm plates at 60%‐70% confluence without any chemical compounds, including selecting antibiotics, and maintained for 24 hours for further assay. Bafilomycin‐A1 (100 nM; B1793; Sigma‐Aldrich, St. Louis, MO) was added for the last 2 hours of assay. For control groups without bafilomycin‐A1 treatment, the same volume of dimethyl sulfoxide (DMSO) was added.
The expression of SULF2 was examined in both of the cell lines before transfecting shRNA or overexpression plasmid.
The presence of mycoplasma contamination was examined by the MycoAlert Mycoplasma Detection Kit (LT07‐418; Lonza, Basel, Switzerland) before performing next‐step assays/experiments or regularly at once a month.
Plasmid, Virus Production, and Transfection
For Huh7 cells that essentially express high SULF2, shRNA targeting SULF2 mRNA was stably transfected. The target sequence, CATCAATGAGACTCACAATTT, was cloned into the pLKO.1 vector that harbors the puromycin‐resistance gene. Subsequently, lentiviral particles were produced by transfecting the plasmids to the HEK 293T cells. The Huh7 cells were infected with lentiviral particles and puromycin was treated for selecting and maintaining the cells. Lentivirus containing scrambled shRNA sequence was used as control.
The SULF2‐negative Hep3B cells were transfected with the pcDNA3.1 plasmid (Invitrogen, Carlsbad, CA) harboring full‐length SULF2 complementary DNA (cDNA). These cells were treated with 400 μg/mL of geneticin (Invitrogen) for 14‐21 days for selecting geneticin‐resistance clones. The isolated clones were tested for the SULF2 expression levels and maintained with 200 μg/mL of geneticin. The Hep3B cells transfected with empty pcDNA3.1 were used as control.
Fugene 6 Transfection Reagent (11814443001; Roche Diagnostics, Mannheim, Germany) and Lipofectamin LTX with Plus Reagent (15338100; Invitrogen) were used for transfecting HEK 293T and Hep3B cells, respectively.
Western Blots and Antibodies
The Cell Extraction Buffer (FNN0011; Invitrogen) was used to extract the cellular proteins. Whole cell lysates were incubated on ice for 30 minutes and centrifuged at 14,000 G, 4°C, for 10 minutes. The protein concentration of the collected supernatant was measured using Pierce BCA Protein Assay Kit (23227; Thermo Fisher Scientific, Waltham, MA). Equal amounts of proteins were electrophoretically separated on 4%‐15% gradient or 15% sodium dodecyl sulfate‐polyacrylamide gels, depending on the molecular weights. Subsequently, the proteins were transferred to polyvinlidene fluoride membrane, blocked with 5% nonfat dry milk, washed with 0.1% Tris‐buffered saline and Tween 20 (TBS/T), and incubated at 4°C overnight with the primary antibodies. After washing out the primary antibody solution with 0.1% TBS/T, the blots were incubated with horseradish peroxidase (HRP)‐conjugated secondary antibodies at room temperature for 1 hour. The chemiluminescent HRP antibody detection reagent HyGlo Quick Spray Kit (E2400; Denville Scientific, Metuchen, NJ) was used for developing the blots.
The list of primary antibodies used in the western blot and/or immunofluorescence is as follows: anti‐SULF2 (1:1,000; MBS219851; MyBioSource, San Diego, CA), anti‐LC3B (1:1,000 to 1:2,000; ab192890; Abcam, Cambridge, United Kingdom), anti‐p62 (1:2,000; ab56416; Abcam), anti‐LAMP1 (1:10,000; ab25630; Abcam), anti‐cathepsin D (1:2,000; ab75852; Abcam and 1:100; sc‐13148; Santa Cruz Biotechnology, Dallas, TX), anti‐cathepsin B (1:1,000; ab125067; Abcam), anti‐PARP (1:1,000; 9542, Cell Signaling Technology, Danvers, MA), anti‐cleaved PARP (1:1,000; 5625, Cell Signaling Technology), anti‐caspase 8 (1:200; sc‐73526; Santa Cruz Biotechnology), anti‐caspase‐9 (1:1,000; 9508; Cell Signaling Technology), anti‐Bak (1:10,000; ab32371; Abcam), anti‐Bax (1:1,000; ab32503; Abcam), anti‐Bcl‐2 (1:500; 13‐8800; Invitrogen), anti‐galectin‐3 (1:1,000; ab76245; Abcam), anti‐LAPTM4B (1:250; AP20870a; Abgent), anti‐α‐tubulin (1:5,000; ab7291; Abcam), and anti‐GAPDH (1:1,000; 2118; Cell Signaling Technology). Goat anti‐mouse immunoglobulin G (IgG) (5220‐0341; SeraCare, Milford, MA) or goat anti‐rabbit IgG (7074; Cell Signaling Technology) secondary antibodies were used at 1:5,000 dilution.
GFP‐LC3 Fluorescence Microscopy and Quantification
The plasmid vector (pCDH‐CMV‐MCS‐EF1a‐Puro; CD510B‐1; System Biosciences, Palo Alto, CA) expressing fusion GFP‐LC3 protein construct was kindly provided by Dr. Frank Sinicrope. The lentiviral particles were prepared using the plasmid, and the cells were stably transfected.
Cells were seeded in the 6‐well plate at 60%‐70% confluence and maintained for 24 hours without any chemical compound including selecting antibiotics. For the last 2 hours of the experiment, cells were treated with bafilomycin‐A1 (100 nM) or control DMSO in a final concentration of 0.1%. Subsequently, the cells were fixed with 4% paraformaldehyde (PFA), and the nuclei were counterstained with 4′,6‐diamidino‐2‐phenylindole (blue).
A total of 50 GFP‐LC3 positive cells were examined from 10 random fields (5 cells/field) under the confocal microscope using the × 40 oil immersion objective. If the cytoplasm of the cell showed 30 GFP‐LC3 or more puncta and the nucleus was negative for puncta, it was counted as an autophagic cell. Confocal microscopic images were obtained using the ZEN software on a Zeiss 780 using an Ex/Em 488/510‐nm filter. All experiments were performed in at least triplicate per condition.
Tandem mRFP‐GFP Fluorescence Microscopy and Quantification
The Premo Autophagy Tandem Sensor RFP‐GFP‐LC3B kit (P36239; Life Technologies, Carlsbad, CA) was used as the assay for cellular autophagic flux. The LC3B is tagged with both GFP and RFP, thereby enabling differentiation of autophagosomes from autolysosomes, as acid‐sensitive GFP is degraded by lysosomal enzymes once fusion between autophagosomes and lysosomes occurs and the autolysosomal environment becomes acidic. Therefore, autophagosomes are shown as yellow puncta‐positive cells, whereas autolysosomes show only red puncta. The cell preparation for confocal microscopic exams was performed. The number of cells positive for yellow or red puncta was counted after examining 50 cells in 10 random fields (5 cells/field) under a × 40 confocal microscope objective. Confocal microscopic images were obtained using the ZEN software on a Zeiss 780 with the following filters: Ex/Em 488/510 nm for GFP and Ex/Em 568/603 nm for RFP. All experiments were performed in at least triplicate per condition.
Electron Microscopy
The cellular ultrastructure was examined using transmission electron microscopy (JEOL 1400, Peabody, MA). A total of 50 intact cells were observed from 10 random fields (5 cells/field), and the number of autophagosomes and autolysosomes were counted separately.
Measurement of Cathepsin Activity
Cathepsin D (Abcam; 65302) and cathepsin B (Abcam; ab65300) activity kits were used to compare cathepsin activity in SULF2‐expressing versus nonexpressing cells. Briefly, whole cell lysates were collected and an equal amount of protein was placed in each well of a clear‐bottomed, black 96‐well plate after the volume was adjusted to 50 µL with cell lysis buffer. Then 50 µL reaction buffer, together with 2 µL cathepsin D or cathepsin B substrate, was added to each well. The reactions were incubated at 37°C in the dark for 90 minutes. The fluorescence of the converted substrates was read at Ex/Em of 328/460 nm for cathepsin D and Ex/Em of 400/505 nm for cathepsin B. All experiments were performed in at least triplicate, and each experiment was done with the samples in triplicate. The values are presented as relative fluorescence unit after subtracting the background values.
Immunofluorescence
Cells were seeded in the 6‐well plates at 60%‐70% confluence and maintained for 24 hours without any chemical compound, including selecting antibiotics. Bafilomycin‐A1 or DMSO was added for the last 2 hours when needed. For confocal microscopy, the cells were fixed with 4% PFA and then permeabilized in 0.1% Triton‐X‐100 in phosphate‐buffered saline (PBS) for 5 minutes. After washing, the cells were blocked with 5% normal goat serum in PBS at room temperature for 1 hour. The blocking buffer was washed out and the cells were incubated in the primary antibody solution diluted in 5% normal goat serum in PBS at 4°C overnight.
The cells were then washed and incubated with appropriate secondary antibodies diluted 1:500 in 5% normal goat serum in PBS (Alexa Fluor 488 goat antimouse [A11001] and Alexa Fluor 568 goat antirabbit [A11011]) (Invitrogen) at room temperature for 1 hour, protected from light.
The prepared slides were examined by confocal microscopy. For the evaluation of fusion between autophagosomes and lysosomes, a total of 100 autophagic cells (≥ 30 LC3B puncta in the cytoplasm) were identified for each condition. The ImageJ (National Institutes of Health, Bethesda, MD) plugin JACoP was used to measure the degree of colocalization and calculate the Pearson's correlation coefficients. LMP was evaluated in two different immunofluorescence experiments. First, a co‐immunofluorescence experiment using markers for lysosomal enzyme (cathepsin D) and the LAMP1 were performed. Second, the galectin‐3 puncta formation assay was performed by staining the cells with galectin‐3 and LAMP1. Diffuse cytosolic staining of cathepsin D or punctate staining of galectin‐3 was detected as a result of LMP. In both experiments, a total of 50 cells from 10 random fields (5 cells/field) were observed, and the percentage of the cells showing diffuse cytosolic staining of cathepsin D or punctate staining of galectin‐3 was calculated, respectively. If the cytoplasm of the cell showed at least 10 galectin‐3 puncta, it was considered as positive for LMP.
Quantitative Real Time‐PCR
Total RNA was extracted from the cells using the Direct‐zol RNA Miniprep Kit (R2050; Zymo Research, Irvine, CA) according to the manufacturer's instructions. cDNA was synthesized from 1 µg of RNA reversed‐transcribed with random primers (High‐Capacity cDNA Reverse Transcription Kit; 4368814; Applied Biosystems, Foster City, CA). The SYBR Green Master Mix (Roche Diagnostics) was used for quantitative real‐time PCR, and the amplified fluorescence signal was detected by Roche LightCycler 480 (Roche Diagnostics). All experiments were performed with three replicates per experiment. The relative mRNA expression was presented as 2(‐ddCt) calculated from the threshold cycle values.
The primers used for quantitative real‐time PCR are 5′‐CAACCTCGTGCCCAAGTACT‐3′ (SULF2‐F), 5′‐CACTGAAGTCCCCACCATCC‐3′ (SULF2‐R), 5′‐TCAATGCTGTGGTACTGTTGATT‐3′ (LAPTM4B‐F), 5′‐GTACGCTCCGTAAGTAGCCATA‐3′ (LAPTM4B‐R), 5′‐GCGTCTTGTTGTTCATCGAGC‐3′ (LAPTM5‐F), 5′‐CGATCCTGAGGTAGCCCAT‐3′ (LAPTM5‐R), 5′‐CATGTACGTTGCTATCCAGGC‐3′ (β‐actin‐F), and 5′‐CTCCTTAATGTCACGCACGAT‐3′ (β‐actin‐R).
RNA Interference
The cells were seeded in 6‐well plates at 50%‐60% confluence and maintained for 24 hours without any chemical compound, including selecting antibiotics. Then, siRNA targeting LAPTM4B (5′‐CCUACCUGUUUGGUCCUUATT‐3′ [sense], 5′‐UAAGGACCAAACAGGUAGGAT‐3′ [antisense]; 4392420; Invitrogen) was transfected to the cells and maintained for 48 hours before further analysis. As a control, a scrambled siRNA (4390843; Invitrogen) was used. Lipofectamine RNAiMax (13778075; Invitrogen) together with Opti‐MEM Reduced Serum Medium (31985070; Gibco) were used for transfecting siRNA according to the manufacturer's instructions.
Cell Proliferation Assay
The in vitro cell viability test was performed with a MTT assay. Cells were seeded at a density of 0.5 × 10⁴ cells/well in 96‐well culture plates. After 24 hours, the cells were transfected with the siRNA for 48 hours. The cells were incubated with 20 µL of 5 mg/mL MTT solution, protected from light. After 3 hours, culture medium was carefully discarded and formazan was resuspended with 200 µL of DMSO. Finally, the cell viability in each well was measured in terms of optical density at 560 nm, with 670 nm for reference.
Soft Agar Colony Formation Assay
As for anchorage‐independent growth, CytoSelect 96‐well Cell Transformation Assay Kit (Cell Recovery Compatible, Colorimetric; CBA‐135; Cell Biolabs, Inc., San Diego, CA) was used in accordance with the manufacturer's instructions. Briefly, the mixture of 1.2% agar solution, 2 × DMEM medium, and 500 SULF2‐positive Hep3B cells that were transfected with various siRNAs was plated into a 96‐well microplate. The plates were incubated at 37°C in 5% CO2, and the colonies that had formed after 7 days were quantified by colorimetric assay using MTT in detergent solution. Absorbance was detected at 570 nm. Assays were performed in duplicate, and each experiment was done with the samples in triplicate.
Statistical Analysis
All statistical analyses were performed using SPSS version 22.0 (SPSS Inc., Chicago, IL). The relationships between the experimental condition and continuous variables were assessed by Student t test. GraphPad Prism 5.0 was used for graphical presentations of the data (GraphPad Software Inc., San Diego, CA). All bar graphs represent the mean ± SEM derived from each independent experiment.
Acknowledgments
We thank Drs. Frank Sinicrope and Shengbing Huang for providing the plasmid‐expressing fusion GFP‐LC3 proteins construct. We thank the Mayo Microscopy and Cell Analysis Core and Trace A. Christensen, Scott I. Gamb, and Bing Q. Huang for the technical assistance in the electron microscopy experiments.
Supported by the National Institutes of Health (CA128633 to L.R.R. and CA165076 to L.R.R. and M.F.), Mayo Clinic Center for Cell Signaling in Gastroenterology (NIDDK P30 DK084567 to L.R.R.), Mayo Clinic Cancer Center (P30 CA015083 to L.R.R.), Mayo Clinic Pancreatic Cancer SPORE (P50 CA102701 to L.R.R.), and Mayo Clinic Hepatobiliary SPORE (P50 CA210964 to L.R.R.).
Potential conflict of interest: Dr. Roberts received grants from and advises Gilead Sciences, Bayer, and Exact Sciences. He received grants from and consults for Wako Diagnostics. He advises Bayer, Grail, NACCME, QED, and Tavec. He received grants from Ariad, BTG International, and Redhill.
References
Author names in bold designate shared co‐first authorship.
- 1. Choi AM, Ryter SW, Levine B. Autophagy in human health and disease. N Engl J Med 2013;368:651‐662. [DOI] [PubMed] [Google Scholar]
- 2. Mizushima N, Komatsu M. Autophagy: renovation of cells and tissues. Cell 2011;147:728‐741. [DOI] [PubMed] [Google Scholar]
- 3. Klionsky DJ, Abdelmohsen K, Abe A, Abedin MJ, Abeliovich H, Acevedo Arozena A, et al. Guidelines for the use and interpretation of assays for monitoring autophagy. Autophagy 2016;12:1‐222. [DOI] [PMC free article] [PubMed] [Google Scholar]
- 4. Galluzzi L, Pietrocola F, Bravo‐San Pedro JM, Amaravadi RK, Baehrecke EH, Cecconi F, et al. Autophagy in malignant transformation and cancer progression. EMBO J 2015;34:856‐880. [DOI] [PMC free article] [PubMed] [Google Scholar]
- 5. White E. Deconvoluting the context‐dependent role for autophagy in cancer. Nat Rev Cancer 2012;12:401. [DOI] [PMC free article] [PubMed] [Google Scholar]
- 6. White E, DiPaola RS. The double‐edged sword of autophagy modulation in cancer. Clin Cancer Res 2009;15:5308‐5316. [DOI] [PMC free article] [PubMed] [Google Scholar]
- 7. Wang Y, Han C, Lu L, Magliato S, Wu T. Hedgehog signaling pathway regulates autophagy in human hepatocellular carcinoma cells. Hepatology 2013;58:995‐1010. [DOI] [PMC free article] [PubMed] [Google Scholar]
- 8. Lai JP, Sandhu DS, Yu C, Han T, Moser CD, Jackson KK, et al. Sulfatase 2 up‐regulates glypican 3, promotes fibroblast growth factor signaling, and decreases survival in hepatocellular carcinoma. Hepatology 2008;47:1211‐1222. [DOI] [PMC free article] [PubMed] [Google Scholar]
- 9. Yang JD, Sun Z, Hu C, Lai J, Dove R, Nakamura I, et al. Sulfatase 1 and sulfatase 2 in hepatocellular carcinoma: associated signaling pathways, tumor phenotypes, and survival. Genes Chromosomes Cancer 2011;50:122‐135. [DOI] [PMC free article] [PubMed] [Google Scholar]
- 10. Adra CN, Zhu S, Ko JL, Guillemot JC, Cuervo AM, Kobayashi H, et al. LAPTM5: a novel lysosomal‐associated multispanning membrane protein preferentially expressed in hematopoietic cells. Genomics 1996;35:328‐337. [DOI] [PubMed] [Google Scholar]
- 11. Lai JP, Oseini AM, Moser CD, Yu C, Elsawa SF, Hu C, et al. The oncogenic effect of sulfatase 2 in human hepatocellular carcinoma is mediated in part by glypican 3–dependent Wnt activation. Hepatology 2010;52:1680‐1689. [DOI] [PMC free article] [PubMed] [Google Scholar]
- 12. Sui X, Chen R, Wang Z, Huang Z, Kong N, Zhang M, et al. Autophagy and chemotherapy resistance: a promising therapeutic target for cancer treatment. Cell Death Dis 2013;4:e838. [DOI] [PMC free article] [PubMed] [Google Scholar]
- 13. Hayami Y, Iida S, Nakazawa N, Hanamura I, Kato M, Komatsu H, et al. Inactivation of the E3/LAPTm5 gene by chromosomal rearrangement and DNA methylation in human multiple myeloma. Leukemia 2003;17:1650. [DOI] [PubMed] [Google Scholar]
- 14. Seimiya M, Bahar R, Kawamura K, Wang Y, Saisho H, Tagawa M. Stage‐specific expression of Clast6/E3/LAPTM5 during B cell differentiation: elevated expression in human B lymphomas. Int J Oncol 2003;22:301‐304. [PubMed] [Google Scholar]
- 15. Kasper G, Vogel A, Klaman I, Gröne J, Petersen I, Weber B, et al. The human LAPTM4b transcript is upregulated in various types of solid tumours and seems to play a dual functional role during tumour progression. Cancer Lett 2005;224:93‐103. [DOI] [PubMed] [Google Scholar]
- 16. Yang H, Xiong F, Wei X, Yang Y, McNutt MA, Zhou R. Overexpression of LAPTM4B‐35 promotes growth and metastasis of hepatocellular carcinoma in vitro and in vivo. Cancer Lett 2010;294:236‐244. [DOI] [PubMed] [Google Scholar]
- 17. Szklarczyk D, Gable AL, Lyon D, Junge A, Wyder S, Huerta‐Cepas J, et al. STRING v11: protein‐protein association networks with increased coverage, supporting functional discovery in genome‐wide experimental datasets. Nucleic Acids Res 2019;47:D607‐D613. [DOI] [PMC free article] [PubMed] [Google Scholar]
- 18. UniProtConsortium . UniProt: a worldwide hub of protein knowledge. Nucleic Acids Res 2019;47:D506‐D515. [DOI] [PMC free article] [PubMed] [Google Scholar]
- 19. Vergarajauregui S, Martina JA, Puertollano R. LAPTMs regulate lysosomal function and interact with mucolipin 1: new clues for understanding mucolipidosis type IV. J Cell Sci 2011;124:459‐468. [DOI] [PMC free article] [PubMed] [Google Scholar]
- 20. Shao GZ, Zhou RL, Zhang QY, Zhang Y, Liu JJ, Rui JA, et al. Molecular cloning and characterization of LAPTM4B, a novel gene upregulated in hepatocellular carcinoma. Oncogene 2003;22:5060‐5069. [DOI] [PubMed] [Google Scholar]
- 21. Yang H, Xiong F, Qi R, Liu Z, Lin M, Rui J, et al. LAPTM4B‐35 is a novel prognostic factor of hepatocellular carcinoma. J Surg Oncol 2010;101:363‐369. [DOI] [PubMed] [Google Scholar]
- 22. Lai JP, Sandhu DS, Yu C, Moser CD, Hu C, Shire AM, et al. Sulfatase 2 protects hepatocellular carcinoma cells against apoptosis induced by the PI3K inhibitor LY294002 and ERK and JNK kinase inhibitors. Liver Int 2010;30:1522‐1528. [DOI] [PMC free article] [PubMed] [Google Scholar]
- 23. Chen G, Nakamura I, Dhanasekaran R, Iguchi E, Tolosa EJ, Romecin PA, et al. Transcriptional induction of periostin by a sulfatase 2‐TGFbeta1‐SMAD signaling axis mediates tumor angiogenesis in hepatocellular carcinoma. Cancer Res 2017;77:632‐645. [DOI] [PMC free article] [PubMed] [Google Scholar]
- 24. Li Y, Zhang Q, Tian R, Wang Q, Zhao JJ, Iglehart JD, et al. Lysosomal transmembrane protein LAPTM4B promotes autophagy and tolerance to metabolic stress in cancer cells. Cancer Res 2011;71:7481‐7489. [DOI] [PMC free article] [PubMed] [Google Scholar]


