Abstract
The extracellular matrix provides macroscale structural support to tissues as well as microscale mechanical cues, like stiffness, to the resident cells. As those cues modulate gene expression, proliferation, differentiation, and motility, quantifying the stiffness that cells sense is crucial to understanding cell behavior. Whereas the macroscopic modulus of a collagen network can be measured in uniform extension or shear, quantifying the local stiffness sensed by a cell remains a challenge due to the inhomogeneous and nonlinear nature of the fiber network at the scale of the cell. To address this challenge, we designed an experimental method to measure the modulus of a network of collagen fibers at this scale. We used spherical particles of an active hydrogel (poly N-isopropylacrylamide) that contract when heated, thereby applying local forces to the collagen matrix and mimicking the contractile forces of a cell. After measuring the particles’ bulk modulus and contraction in networks of collagen fibers, we applied a nonlinear model for fibrous materials to compute the modulus of the local region surrounding each particle. We found the modulus at this length scale to be highly heterogeneous, with modulus varying by a factor of 3. In addition, at different values of applied strain, we observed both strain stiffening and strain softening, indicating nonlinearity of the collagen network. Thus, this experimental method quantifies local mechanical properties in a fibrous network at the scale of a cell, while also accounting for inherent nonlinearity.
Introduction
Cells sense mechanical signals, the most familiar being the stiffness of the surrounding extracellular matrix [1]. The ability of cells to sense the matrix stiffness regulates various cellular activities, such as migration [2–6], differentiation [7], proliferation [5, 8] and gene expression [9]. Quantifying stiffness sensed by a cell is therefore crucial for studies in mechanobiology. For a homogeneous material, measuring stiffness is a straightforward procedure, but the extracellular environment of real tissues is not a homogeneous continuum but rather a highly heterogeneous network of fibers. As cells apply forces to the matrix at length scales of tens of microns, they sense the stiffness not of the bulk material, but rather of local groups of fibers. Therefore, understanding how cells sense stiffness of real biological tissue requires experimental methods that quantify the modulus of a fibrous matrix at the scale of the cell.
On the scale of a cell, fibrous materials behave mechanically as a network of beams that stretch, bend, and buckle. The resulting relationship between stress and strain is nonlinear, showing stiffening in shear or extension and softening in compression [10–16]. To accurately quantify stiffness sensed by a cell, an experiment would have to account for this nonlinearity. Several nonlinear constitutive models exist for fibrous materials [17–20], but they have not yet been validated for general loading conditions. Loadings applied to fibrous materials have generally been uniform extension/compression, simple shear, or combinations of extension/compression and shear [10, 11, 14, 15, 21–27]. These experiments have provided critical insights into how the deformations of the fibers bring about macroscopic phenomena like strain stiffening. Yet there remains a need to probe the matrix mechanics at length scales matching the cell size of tens of microns. Nanoindentation with a spherical probe could measure the modulus at this scale, but nanoindentation quantifies modulus only on the surface of a material—it cannot determine material properties inside the fiber network, as would be sensed by a cell. Moreover, nanoindentation typically assumes the material to be linear. Some studies are beginning to consider nonlinear hyperelastic models in analyzing nanoindentation data [28], but none has yet used a nonlinear model specifically designed for fiber networks, which are strongly nonlinear and weakening under compression [15, 16, 26]. An alternative to nanoindentation is active microrheology, such as by optical tweezers [29–32], which offers the advantage of quantifying stiffness at local points within the fibrous network. A disadvantage is that displacements achieved by optical tweezers are less than 0.5 μm, which is an order of magnitude smaller than cell-induced displacements observed by some experiments [13, 33–36]. The relatively small displacements produced by optical tweezers impede efforts to quantify the nonlinear mechanics that may be produced by a contracting cell.
Further complicating all of these efforts is that fibrous materials exhibit a coupling between volume changing and shape changing deformations [22]. As the coupling depends on fiber length, alignment, and stiffness, it remains difficult to predict whether or how the coupling will affect the response to general loading conditions [37]. Thus, it remains difficult to predict whether the nonlinear mechanical response to one type of loading—such as uniform shear due to a rheometer or a point-like force due to optical tweezers—matches the response to a different type of loading—such as the distributed forces due to cell contraction. We therefore argue that the most reliable way to quantify nonlinear mechanics sensed by a cell would be with loading conditions that closely mimic the self-equilibrating forces of cell contraction.
Here we propose a new experimental method that quantifies the modulus of a fibrous matrix using contractile forces at the scale of the cell. We mimic cell contraction by using spherical particles made of an active hydrogel, poly(N-isopropylacrylamide) (PNIPAAm), that, when heated, undergo a phase transition causing them to contract. After quantifying the modulus of the PNIPAAm particles, we embed them in collagen networks and measure their contraction. We compute the modulus of the fibrous network surrounding each particle by using a nonlinear model designed for fibrous materials, which weaken in compression [19]. The results show a large amount of heterogeneity in modulus at the length scale of a cell, with modulus varying by a factor of up to 3. We also observed strain stiffening occurring in short and medium fiber networks at contractile strains of 0.1–0.2 and strain softening in networks having longer fibers at contractile strains of 0.2–0.3, indicating that our experimental method can reveal nonlinearity at this length scale.
Theoretical Analysis
Here we give equations that relate contraction of the PNIPAAm particle to the modulus of the surrounding matrix. We use the superscripts P and M to represent the particle and matrix, respectively. We begin with linear analysis, and we then extend the analysis to the case of a nonlinear matrix.
Linear Analysis
As the PNIPAAm particles are spherical inclusions undergoing a uniform volumetric strain, the strain can be related to modulus using Eshelby’s solution for a linear elastic medium [38]. The key results from Eshelby are that the strains inside the particle are uniform, and the displacements in the linear elastic matrix outside the particle decay as r−2. As the problem is spherically symmetric, the only nonzero component of the displacement is the radial one, which we refer to as u. Radial position is denoted by r, and the particle’s radius is a.
To relate contraction of the particle to modulus of the surrounding matrix, we use the boundary conditions of matching radial displacement and traction at the interface between particle and matrix,
| (1) |
where σ is the radial component of the stress tensor. We begin by analyzing the particle. As shown by Eshelby, strains and stresses in the particle are constant. As the particle is linearly elastic and under a state of isotropic tensile stress, the radial stress in the particle is σP = 3KP εm, where εm is the mechanical strain and KP is the bulk modulus of the particle. In addition to mechanical strain, there is a thermal strain εT. By superposition, the total strain ε is equal to εm+εT. Hence, the radial stresses are
| (2) |
For stresses and strains to be uniform inside the particle, the radial displacement uP must be of the form uP = Cr, where C is a constant. The displacement at r = a is therefore given by the product of particle’s radial strain ε and its initial radius a. Thus, C = ε and
| (3) |
In the matrix outside the inclusion, displacements scale as u ~ r−2 and are therefore given by
| (4) |
Radial and angular normal strains are thus and . Applying Hooke’s law gives the normal radial stresses,
| (5) |
where μM is the shear modulus of the matrix. Applying the boundary conditions (Eq. 1) and solving for μM gives
| (6) |
It will be useful to write this in terms of Young’s modulus of the matrix EM and the function f1(ν) = 2/(1 + ν), where ν is Poisson’s ratio of the matrix. The shear and Young’s moduli are related by μM = EMf1(ν)/4, which gives:
| (7) |
Nonlinear Analysis
As fibrous materials such as collagen networks are nonlinear, the simple linear analysis is insufficient to quantify the modulus. The most dramatic nonlinearity for these materials is that the modulus is smaller in compression than in tension. This phenomenon, referred to as compression weakening, has been observed directly in uniaxial tension/compression experiments on networks of fibrin and collagen [15]. Other experiments have shown that displacements propagate over a longer range than predicted by linear elasticity, which can be explained by compression weakening [13, 16, 37]. We therefore consider the nonlinear compression-weakening model of Rosakis et al. [19], which gives the solution for a contracting spherical particle within a compression weakening 3D matrix. The model shows that displacements in the matrix scale as u ~ r−n, with n less than the linear elastic value of 2, in agreement with previous experiments [13, 16, 39] and models [13, 37], which also observed n < 2.
The model presented by Rosakis et al. [19] begins with linear elasticity and makes one modification to account for compression weakening by including a factor ρ, which represents the ratio of stiffness in compression to tension. For a linear material, ρ = 1, and for a material with no stiffness in compression ρ = 0. Thus, the model has three constants, two elastic moduli and the compression weakening factor ρ. We find it most useful to use Young’s modulus EM and Poisson’s ratio ν for the elastic constants of the matrix; equations are presented here after converting the elastic constants used by Rosakis et al. to EM and ν. Eq. 4.7 of Rosakis et al. gives the radial normal stresses due to a contracting particle in a compression weakening material. For an infinite matrix, the normal stress at the interface between the particle and matrix can be written as
| (8) |
where ε is the radial strain of the particle, EM is Young’s modulus of the matrix, and the dimensionless function f(ν, ρ) is given by
| (9) |
The particle is linear and elastic with radial stresses given by Eq. 2. Combining this with Eq. 8 gives
| (10) |
which has the same form as the linear solution, Eq. 7.
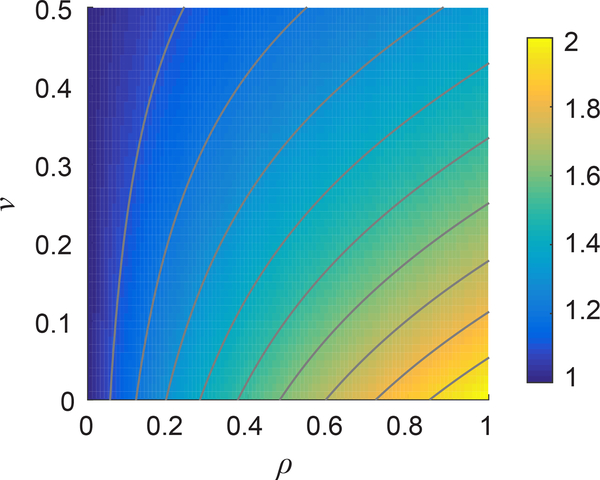
Assuming limits on ν and ρ are 0 ≤ ν ≤ 0.5 and 0 ≤ ρ ≤ 1, function f ranges from 1 to 2, as shown in Fig. 1. Note that when ρ = 1, the nonlinear f(ν, ρ) matches the linear f1(ν), i.e., f(ν, 1) = f1(ν). Thus, the nonlinear solution of Rosakis et al. converges to the linear Eshelby solution in the linear limit of ρ = 1.
Figure 1:
Dimensionless function f(ν, ρ) defined in Eq. 9, where ν is Poisson’s ratio and ρ is the dimensionless compression weakening factor. Contour lines show values of f = 1.1, 1.2, …, 1.9.
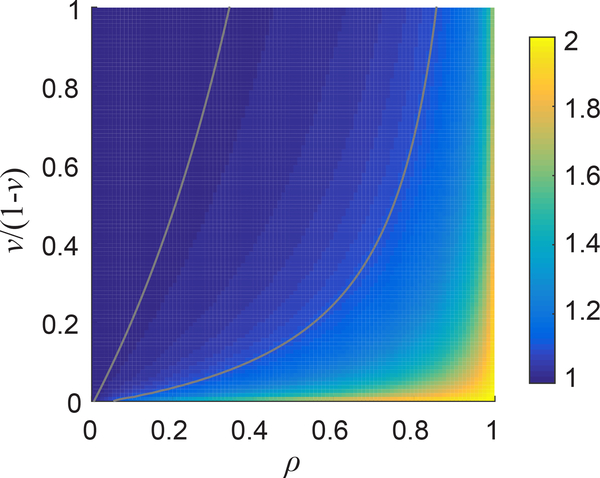
As f(ν, ρ) ranges from 1 to 2, Eq. 10 allows the Young’s modulus to be computed to within a factor of 2 with no knowledge of ν or ρ. We can gain some information about ν and ρ from further analysis of the displacement field. We have previously shown that in fibrous materials, radial displacements fit to u = Ar−n with n less than the linear elastic solution of 2 [13, 16, 39]. The model of Rosakis et al. also predicts n < 2; see Eq. 4.4 of Rosakis et al. (Note that n in our notation is equal to −ξ− in the notation of Rosakis et al.) According to Rosakis et al., the power n ranges from 1 to 2 and depends only on ν and ρ; a plot is shown in Fig. 2.
Figure 2:
Plot of power n as a function of matrix Poisson’s ratio ν and compression weakening factor ρ. Contour lines show n = 1.01 and 1.1.
In experiments with PNIPAAm particles in collagen, we have typically observed n ≈ 1 [16, 39]. This should give us information about possible values of ν and ρ. From Fig. 2, we see that n < 2 implies ρ < 1, but n is relatively insensitive to ρ. For example, n ranges from 1 to 1.1 for ρ ranging from 0 to 0.8. Though no experiment has directly measured ρ, one experiment measured the modulus of a collagen network in both compression and tension observing the modulus in compression to be 0.004 times the modulus in tension, implying ρ = 0:004, and f(ν, 1) ≈ 1, which applies for all values of ν (Fig. 1). Other experiments will need to be performed to verify this measurement. More information could be gained from independent measurement of the Poisson’s ratio of collagen. Unfortunately, experiments currently disagree as to the Poisson’s ratio—experimental studies have reported Poisson’s ratio ranging from 0.1 to 0.3 for small deformation in nominally isotropic networks [40, 41]. As the Poisson’s ratio is unknown and further experiments are needed to confirm the value of the compression weakening factor ρ for collagen, we will report our results as the product EMf(ν, ρ). As f(ν, ρ) ranges from 1 to 2, this may cause errors of up to a factor of 2, but if we assume that ν and ρ are each constants, then relative comparisons of EMf(ν, ρ) measured by different contracting particles will be exact.
Relationship between Particle Strain and Matrix Strain
Eqs. 6 and 10 use the total radial strain ε and thermal strain εT of each PNIPAAm particle. We represent these using the engineering strain, i.e., by dividing the radial displacement by the initial radius. As all particles contract, we will report the magnitude of strain, referring to it as “contractile radial strain.”
The radial displacement and radius of the particle can be used to determine the strains within the matrix surrounding the particle. As there is spherical symmetry, the normal radial and angular strains in the matrix is given by and , where u is the radial displacement. Thus, the maximum angular strains occur at r = a, are equal to the strain of the PNIPAAm particle ε, and are contractile. The radial strain can be computed from the fact that radial displacements scale as u ~ r−n [13, 16, 39]. Letting the particle radius be a and the displacement at r = a be −ua (with the negative sign indicating inwards), the radial displacements in the matrix are u = −ua(r/a)−n. The radial strain is then . Its maximum is at r = a, giving a value of . For collagen, we have previously observed n = 1 [16, 39], indicating that the maximum radial strain in the matrix is ua/a, which is the same magnitude as the maximum angular strains, but is expanding (tensile) rather than contractile. The maximum magnitudes of strain within the surrounding matrix are therefore equal to the contractile radial strain of each PNIPAAm particle.
Materials and Methods
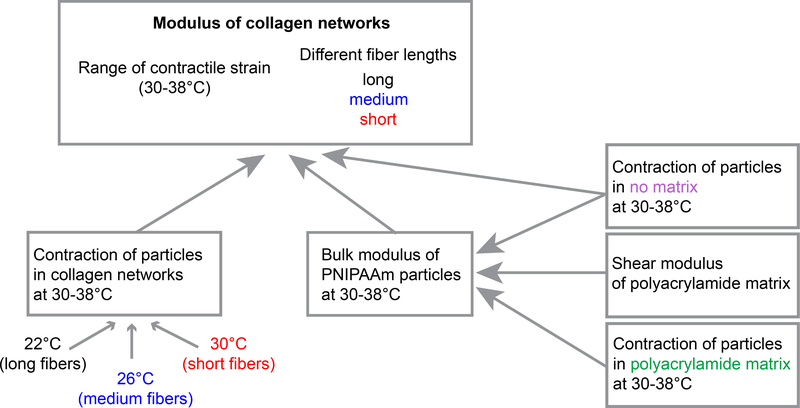
To compute the local modulus of the collagen matrix, we applied Eq. 10, which required that we first quantify εT, the particles’ thermal contraction in no matrix, and KP, the particles’ bulk modulus, Fig. 3. Determining KP required separate calibration experiments, which we performed in linear elastic polyacrylamide, allowing us to apply Eq. 6 using a known value of the shear modulus of the polyacrylamide. Full details of our methods are described below.
Figure 3:
Diagram of the experimental procedure.
Generating PNIPAAm Particles
Particles of PNIPAAm were created by adapting a previously described oil/water emulsion protocol [16]. Kerosene with 3.5% Span 80 (Tokyo Chemical Industries) was de-gassed for 1 hour under vacuum and used as the solvent for the reaction. The solvent was maintained under nitrogen for 10 minutes before stirring at 450 rpm on stir plate at 22°C for an additional 5 minutes. An aqueous solution was then prepared by combining 0.25 g N-isopropylacrylamide (Sigma 415324), 1.6 ml of 2% bis-acrylamide (Bio-Rad), 0.05 g ammonium persulfate (Bio-Rad), 1.5 ml of 1×tris-buffered saline, and enough deionized water to bring the final volume to 10 ml. These concentrations of N-isopropylacrylamide and bis-acrylamide were far lower than previous studies [16], and they yielded soft PNIPAAm particles having modulus similar to that of the collagen networks to be studied. Stiffer or softer particles can be generated by increasing or decreasing the amounts of N-isopropylacrylamide or bis-acrylamide. TEMED (Bio-Rad, 0.36% final concentration) was added and mixed with the aqueous solution immediately before adding the aqueous solution to the solvent. The emulsion was then stirred at 450 rpm at 22°C, under a nitrogen environment for 1 hour or until polymerized particles formed. The resulting particles were allowed to settle overnight and washed twice with hexane. The particles were subsequently washed with isopropyl alcohol, ethanol, deionized water, and finally 1× PBS. Between each wash the particles were allowed to settle for at least 1 hour. The solution of particles was then filtered using a cell strainer to remove particles with diameter less than 40 μm. The final solution was comprised of particles (average diameter ≈ 100 μm) and 1× PBS.
Collagen Matrix
The PNIPAAm particles were embedded into matrices of rat tail collagen I (Corning) as previously described [16, 42]. The collagen comes in solution in acetic acid; collagen fibers polymerize upon neutralizing the pH which we do using HEPES buffer. The solution of acetic acid and HEPES buffer affects the contraction of the PNIPAAm particles, which we address in the next section. Polymerization occurred at 22°C for 85 minutes (which produced networks having long fibers), or 26°C or 30°C for 50 minutes (which produced networks having medium and short fibers, respectively). We measured the average fiber length for each type of collagen network from network pore area by segmenting high resolution images of each networks as previously described in [39]. Networks having long fibers had fiber lengths of 27.8 ± 5.7 μm (mean ± standard deviation), while medium and short fibers were 16.9 ± 2.8 and 10.4 ± 1.2 μm, respectively.
Representative images of particles embedded in fiber networks are shown in Fig. 5. We found that precise temperature control was necessary to give us control of the fiber length, so the temperature was controlled using a thermoelectric hot plate (CP-061HT, TE Technology) with TC-720 temperature controller (TE Technology) having temperature resolution of approximately 0.1°C. Each collagen gel had a final collagen concentration of 3 mg/ml and a thickness of ≈ 150 μm. After polymerization, 1 ml of PBS was added to each dish to prevent dehydration of the collagen networks.
Figure 5:
Collagen networks (3 mg/ml) polymerized at 22°C, 26°C and 30°C having long, medium, and short fibers, respectively.
Thermal Contraction of PNIPAAm Particles
To quantify thermal contraction of PNIPAAm particles in no matrix, they were imaged at different temperatures while in a salt solution. Specifically, 1 ml of particles solution was added to a mixture of 1 ml 0.02 M acetic acid and 1 ml of 1× HEPES buffer. This salt solution was made based on our observation that it affected the contraction of the PNIPAAm particles. As this solution matches that of collagen matrices, it was used for all experiments to ensure that the particles’ thermal strain εT would match that in collagen.
Polyacrylamide Matrix
PNIPAAm particles were polymerized within a polyacrylamide matrix to calibrate their moduli. The polyacrylamide gel consisted of two layers. The bottom layer had a thickness of 170 μm while the upper one was 300 μm. These layers were created following the same recipe, except that PNIPAAm particles were included in only the upper layer. The two-layer polyacrylamide gels were created after we noticed that the particles located close to the glass bottom of the dish contracted less than the particles located at a greater distance from the glass bottom. In all of our experiments, we observed multiple layers of polyacrylamide to adhere well to one another. The bottom polyacrylamide layer was comprised of 29 mg/ml acrylamide, 0.29 mg/ml bis-acrylamide, 0.57 mg/ml APS (Bio-Rad), 0.5 μm red fluorescent particles (0.76 mg/ml final concentration, Life Technologies F8812) and 1.9 μl/ml TEMED (Bio-Rad) all in deionized water. The bottom layer was added to a glass-bottom dish (Cellvis) and allowed to polymerize for 45 minutes with a glass coverslip on top. Once polymerized, the glass coverslip was removed and the upper layer was added onto the bottom. The upper polyacrylamide layer was made with the same volumes and concentrations except that 0.68 ml/ml of particle solution was also added. The upper layer was allowed to polymerize for 45 mins with a glass coverslip on top. After polymerization, the glass coverslip was removed. We then added a salt solution to each dish to match that of collagen matrices, keeping the ratio (1:1:1) of particles solution (already existing in the 2-layer polyacrylamide gel), 0.02 M acetic acid and HEPES buffer constant.
Temperature Control
To control the temperature during imaging, all experiments used an H301 incubator (Okolab) mounted on the microscope stage and controlled with a UNO controller (Okolab). The temperature was measured separately with a digital thermometer (Fisherbrand Traceable) having a probe that was placed inside a dish of water within the incubator. The thermometer had accuracy of 0.1°C, which was greater than that of the incubator. As the thermometers probe was in the same conditions as the PNIPAAm particles, it gave a more accurate measurement of temperature of the PNIPAAm particles, which was necessary for these experiments. In all experiments, an initial image was collected at a reference temperature of 26°C; subsequent images were captured at 30, 32, 34, 35, 36, and 38°C. After each temperature change, particles contracted within a few minutes, though the thermal incubator required 30–45 minutes to equilibrate. We showed previously that the particles recover to their initial size upon decreasing the temperature back to the reference temperature [16].
Microscopy and Image Analysis
Images of PNIPAAm particles in no matrix were collected using a Nikon Ti-E microscope and a 20× 0.75 numerical aperture (NA) air objective in phase contrast mode. Images of PNIPAAm particles in polyacrylamide and collagen matrices were collected using an Andor Spinning Disk confocal microscope (Yokogawa CSU-X1) with a Nikon Ti-E base and a 20× 0.75 NA air objective. For each location, a z-stack was obtained with increments of 0.5 μm. Images were analyzed by using ImageJ to measure the radius of each particle at each temperature.
Shear Modulus of Polyacrylamide
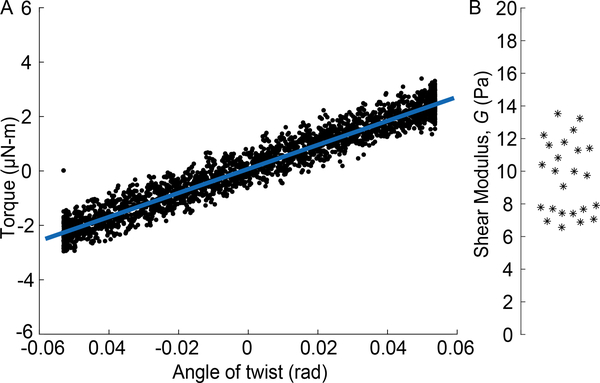
Calibration of the moduli of the PNIPAAm particles occured by observing their contraction in homogeneous polyacrylamide gels and applying Eq. 6. This required measuring the modulus of the polyacrylamide, which we did using a rheometer (Kinexus ultra+, Malvern Panalytical). To allow the rheometer to grip the gels, we polymerized polyacrylamide (using the recipe described previously) between two glass coverslips treated with 0.2% acetic acid and 0.3% 3-(Trimethoxysilyl)propyl methacrylate. Cyanoacrylate glue was used to adhere the coverslips to the rheometer. All gels were disks with a diameter of 18 mm, and a height between 2.25 mm and 2.55 mm. The rheometer’s 20-mm diameter flat plate geometry was used. Shear strains were induced by twisting each sample about its axis. The maximum shear strain applied to each gel was less than or equal to 40%, which stayed within the linear range. The angular velocity was kept below 0.0114 rad/s (corresponding to a maximum strain rate of 4% per second) to ensure the loading was quasi-static. The angular acceleration was kept below 0.0038 rad/s2 to ensure that inertial loads would be negligible. Shear modulus was calculated by fitting a line to the data of torque versus angle (Fig. 4) and applying the standard equation for torsion of a uniform cylinder. The mean value of shear modulus was found to be 9.6 Pa, in agreement with a previous report [43].
Figure 4:
Shear modulus of polyacrylamide. (A) Torque plotted versus angle of twist for one polyacrylamide specimen. From the linear fit and the specimen’s dimensions, the shear modulus was computed. (B) Shear modulus measured for 24 different polyacrylamide gels.
Statistical Analysis
Applying Eq. 10 to measure the local modulus of collagen required that we measure (i) the particles’ contraction in no matrix and (ii) the particles’ bulk modulus. To measure the bulk modulus, we performed separate calibration experiments with the particles in linear elastic polyacrylamide. The calibration experiments used Eq. 6 and required that we measure (iii) the modulus of the polyacrylamide and (iv) the particles’ contraction in the polyacrylamide. Experimental uncertainties resulted from variability in the data acquired from each of these four measurements. We quantified the uncertainties by computing 95% confidence intervals using bootstrap analysis. To compute confidence intervals on the bulk modulus of the PNIPAAm particles, we used data sets i, iii, and iv with Eq. 6; for confidence intervals on the modulus of collagen, we use data sets i and ii with Eq. 10.
To perform the bootstrap, we began by sampling the data randomly with replacement N times. For a typical bootstrap analysis, N is the number of measured data points, but here each of our measurements (i–iv) have a different number of data points. Therefore, we set N to be the average of the smallest and largest number of data points. We applied Eq. 6 (for the particles’ bulk modulus) or Eq. 10 (for the modulus of collagen), which gave N different values of modulus. We then computed the mean over N, giving one bootstrap estimate for the mean of the modulus. This procedure was repeated 104 times, giving 104 estimates of the modulus. The 95% confidence interval was computed by taking the 2.5 and 97.5 percentiles of those 104 data points. Additionally, a mean over those 104 data points was computed to estimate the mean modulus.
Results
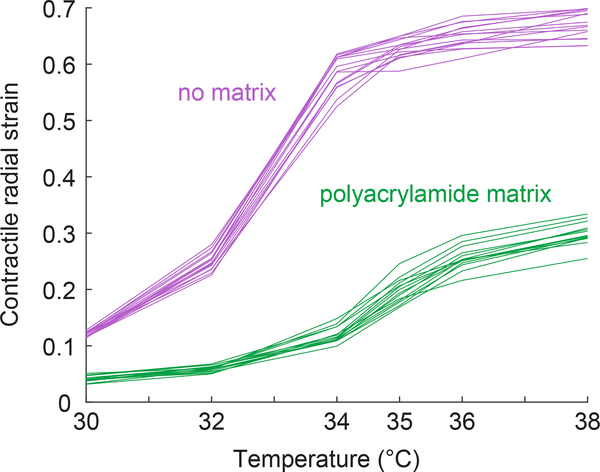
To determine the matrix modulus using Eq. 10, we first measured the particles’ thermal contraction εT and bulk modulus KP. Thermal contraction was measured in no matrix as described in the methods. To determine the bulk modulus KP we measured the contraction of particles embedded in a linear elastic polyacrylamide matrix and applied Eq. 6. Accurate measurement of the bulk modulus KP using this equation requires the shear modulus of the surrounding polyacrylamide matrix μM to be of the same order of magnitude as KP, both of which must have modulus on the same order of magnitude as the collagen networks to be tested later. This requires the quantity 3(εT /ε − 1)/4 to be of order 1. We therefore calibrated the polyacrylamide to have a modulus similar to the collagen, and then calibrated the particles to have a modulus of a similar order of magnitude. After several iterations, we produced a recipe for PNIPAAm that generated particles which contracted approximately half as much in polyacrylamide as compared to their thermal contraction (Fig. 6). Thus, the ratio εT /ε is approximately 2, which implies that the PNIPAAm particles and polyacrylamide matrix have elastic moduli on the same order of magnitude. As shown in Fig. 6, heterogeneity in contraction from one particle to the next is modest, indicating that errors due particle heterogeneity are likely to be small.
Figure 6:
Contractile radial strain of PNIPAAm particles measured in no matrix (magenta) or polyacrylamide matrix (green). Contraction of PNIPAAm particles in no matrix gives the thermal contraction εT. Each line represents the contraction of a different PNIPAAm particle. The reference temperature used to calculate contractile radial strain is 26°C. The labels on the horizontal axis represent the temperatures tested in the experiments.
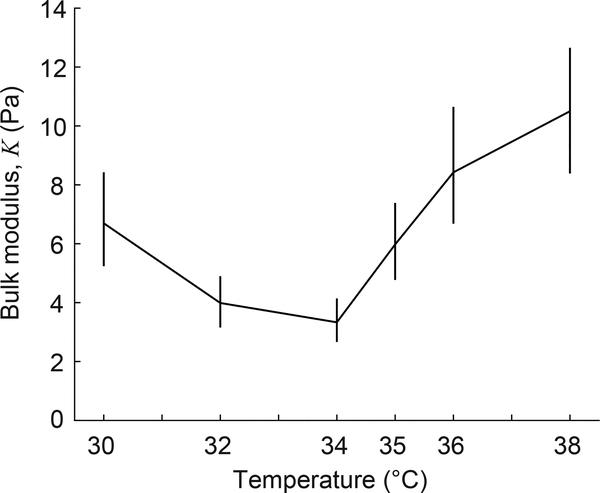
Applying Eq. 6 then gives the particles’ bulk modulus at different temperatures. Fig. 7 shows the mean bulk modulus and the 95% confidence interval computed by bootstrap analysis for each temperature. We designed our PNIPAAm particles to be extremely compliant, with a bulk modulus on the order of 10 Pa. The bulk modulus takes a minimum value at ≈ 34°C, which is near to the phase transition temperature for PNIPAAm. The reduction in bulk modulus near the phase transition temperature is consistent with other studies [44, 45], which observed the minimal value of bulk modulus to occur at temperatures of 31–32°C, and provided an explanation based on a theoretical model [45]. Additionally, the shape of the curve in Fig. 7 matches previous studies: the bulk modulus declines by a factor of ≈ 1.8 as temperature is increased to the phase transition temperature and then increases by a factor of ≈ 2.7 as temperature is further increased. These relative changes in bulk modulus closely match those reported previously [44, 45]. Therefore, the measurement of bulk modulus shown in Fig. 7 is robust.
Figure 7:
Mean bulk modulus of PNIPAAm particles plotted against temperature. Vertical lines show 95% confidence intervals of the means.
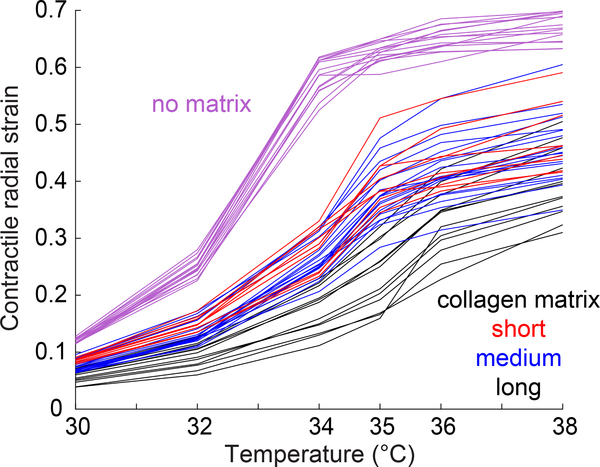
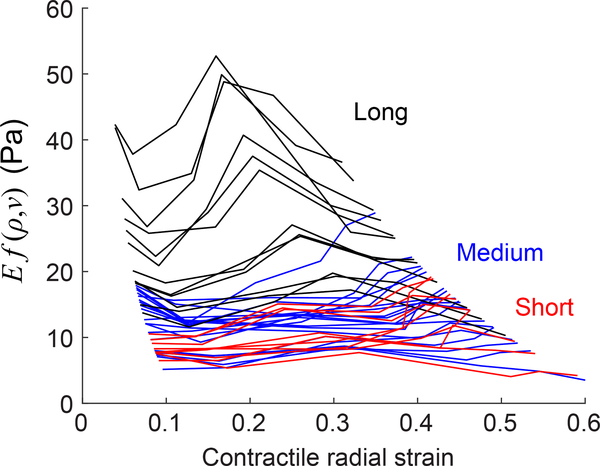
With data on the particles’ thermal contraction εT and bulk modulus KP, it is now possible to apply Eq. 10 to measure the modulus of the nonlinear networks of collagen. For this we measured the contraction of PNIPAAm particles in three different collagen networks, polymerized at 22°C, 26°C, or 30°C. These different polymerization temperatures produced collagen networks having long, medium, and short fibers (Fig. 5). Contractile strains for particles in the networks of different fiber length are shown in Fig. 8. From this data, we calculated the product of Young’s modulus E and function f(ν, ρ) at different contractile radial strains (different temperatures). The results showed heterogeneity in the values of Ef(ν, ρ) across the particles for each of the three types of collagen matrices (Fig. 9). In particular, networks made of long fibers had values of modulus Ef(ν, ρ) that varied by a factor of 3 from one location to the next. Additionally, networks having long fibers had a greater modulus Ef(ν, ρ) than those made of short fibers, even though the total concentration of collagen (3 mg/ml) was no different. While perhaps surprising, this trend has been observed previously in experiments [46, 47] that applied torsion to macroscopic specimens, indicating that this trend occurs on both the macroscale and the microscale. Results also showed a decrease in the values of modulus Ef(ν, ρ) at contractile strains of up to 0.1, followed by an increase for contractile strains in the range of 0.1 to 0.2 for the majority of the curves, indicating initial strain softening [12, 27] followed by strain stiffening [10, 14, 15, 21, 22, 24, 26]. At larger strains of 0.2–0.3, the modulus then decreased for most collagen networks, possibly due to plastic deformation.
Figure 8:
Contractile radial strain of PNIPAAm particles measured in no matrix (magenta) or collagen networks having short (red), medium (blue), or long (black) fibers. Contraction of PNIPAAm particles in no matrix gives the thermal contraction εT. Each line represents the contraction of a different PNIPAAm particle. The reference temperature used to calculate contractile radial strain is 26°C. The labels on the horizontal axis represent the temperatures tested in the experiments.
Figure 9:
Product of Young’s modulus E and function f(ν, ρ) measured by particles in collagen networks having short (red), medium (blue), or long (black) fibers. Each line represents a measurement by a different PNIPAAm particle. The horizontal axis gives contractile strain of each particle, which is equal to the magnitudes of normal strains within the collagen network at each particle–network interface.
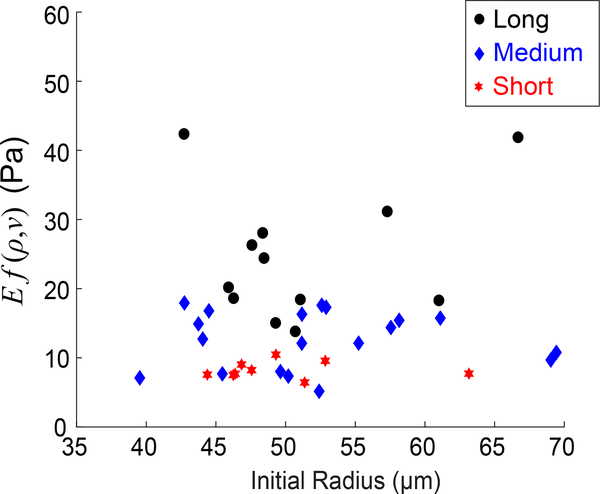
Our measurements could potentially be affected by the finite thickness of the collagen gels and the presence of glass boundaries at the top and bottom of each gel. The stiff boundaries would produce an environment stiffer than the collagen network, thereby reducing the particles’ contraction. To check whether the finite sample thickness affected our measurements, we plotted the product Ef(ν, ρ) measured by particles in collagen networks against each particle’s initial radius. As the largest particles would be most affected by the boundaries, a positive correlation between Ef(ν, ρ) and particle radius would indicate a boundary effect. Fig. 10 shows results for contractile radial strain of ≈ 0.1. The plot shows significant scatter in the data with no discernible trend. A statistical test for correlation between Ef(ν, ρ) and particle radius gives p = 0.61, and the coefficient of determination (R2) for a linear fit to the data is 0.0068, indicating no correlation between measured modulus Ef(ν, ρ) and initial particle radius. The values of p and R2 are similar for contractile strains up to 0.4. For strains greater than this, a small correlation (R2 ≈ 0:2, p ≈ 0:01) appears, indicating a potential effect of the boundaries. If contractile strains of this magnitude were required for future experiments, smaller particles or a thicker collagen network could be used to avoid this issue. Nevertheless, for contractile radial strains up to 0.4, our measurements are unaffected by the finite collagen gel thickness.
Figure 10:
Product of Young’s modulus E and function f(ν, ρ) measured by particles in collagen networks having short, medium, or long fibers (all shown in black) at the lowest level of contraction (30°C), corresponding to contractile radial strain of ≈ 0:1. The horizontal axis gives initial radius of each particle.
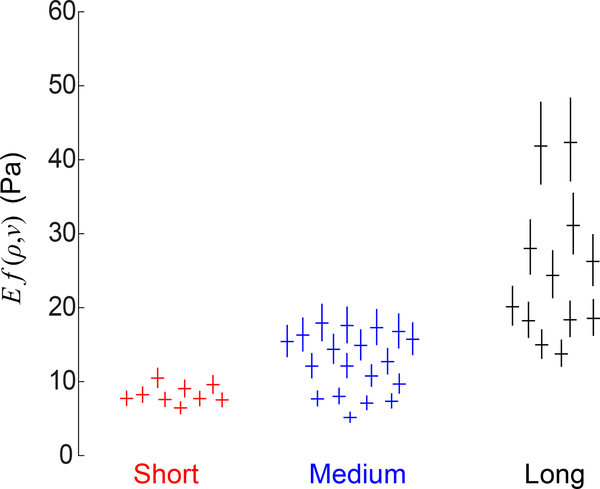
The experiments have numerous sources of uncertainty (e.g., see items i–iv in the section labeled “Statistical Analysis”), all of which combine together to produce variability in the experimental data. To quantify how these experimental uncertainties affect the measurement of modulus Ef(ν, ρ), we computed 95% confidence intervals of Ef(ν, ρ) for each particle using bootstrap analysis as described in the Statistical Analysis section. Fig. 11 shows the confidence intervals for each particle at the lowest tested temperature, which corresponds to a contractile strain of approximately 0.1. Confidence intervals for other levels of contractile strain (i.e., measured at different temperatures) appear similar to those in Fig. 11. For each type of collagen network (i.e., having short, medium, or long fibers) there exist confidence intervals that do not overlap, indicating the moduli measured at different locations are statistically different. Additionally, there are non-overlapping confidence intervals between the different types of collagen networks, indicating the moduli of the different collagen networks are also statistically different. These observations give statistical significance to the trends observed in Fig. 9.
Figure 11:
Product of Young’s modulus E and function f(ν, ρ) measured by particles in collagen networks having short (red), medium (blue), or long (black) fibers at the lowest level of contraction (30°C), corresponding to contractile radial strain of ≈ 0.1 Each cross represents a different PNIPAAm particle. Horizontal lines show means; vertical lines show 95% confidence intervals of the means.
Perhaps the clearest trend revealed by these experiments is the heterogeneity in modulus measured by the contracting particles. To quantify the heterogeneity, we calculated the 10th and 90th percentiles of measured modulus Ef(ρ, ν) and took their ratio. This ratio gives the factor by which the modulus varies within the same fiber network. At a contractile strain of approximately 0.1, the ratio was 1.47 with a 95% confidence interval (CI) of (1.45, 1.50) for the networks with short fibers, 2.43 with 95% CI (2.37, 2.50) for medium fibers, and 2.88 with 95% CI (2.84, 2.92) for long fibers. The local modulus therefore varies by a factor of up to 3 for different positions within the same fiber network.
Discussion
We have developed an experimental method to measure the modulus of a collagen network at the scale of a cell. Our method uses particles (~100 μm diameter) of PNIPAAm, an active gel that contracts when heated. We first measured the particles’ contraction in no matrix and polyarylamide matrix at different temperatures, which enabled us to compute their bulk modulus at these temperatures. We then measured the particles’ contraction in fibrous networks of collagen, and, using a nonlinear hyperelastic model [19], we computed the modulus of the collagen network in the local region surrounding each particle. This provided independent measurements of the modulus at different positions within each collagen network. Results showed that modulus at the scale of these particles is highly heterogeneous, varying by a factor of up to 3. This experimental method quantifies local mechanical properties at the scale of a cell, while also accounting for nonlinearity of the fibrous collagen network.
The hyperelastic model used here begins with linear elasticity and adds one constant factor, ρ, which accounts for compression weakening. In addition to weakening under compression, fibers also align under tension. As a result, fibrous networks stiffen with increasing tensile strain, a phenomenon not accounted for in the hyperelastic model used here. Other hyperelastic models have been designed to simulate fiber alignment in fibrous materials [18, 20, 48], and, in principle, they could be applied to our data. However, we recently showed using a theoretical model that fiber reorientation and alignment due to a contracting inclusion are modest [37]. Additionally, we showed in experiments that displacements due to a contracting sphere propagate over a longer range than predicted by linear elasticity, even in directions perpendicular to fiber alignment [16]. Together, these observations imply that compression weakening—rather than fiber alignment—is the dominant nonlinear mechanism for the loading applied here. Therefore, our choice of a hyperelastic model that simulates compression weakening is appropriate.
As we designed the experiment to control the contraction of the PNIPAAm particles, we were able to measure the local modulus at different levels of contractile radial strain (Fig. 9). Single contracting cells contract at strains of approximately 0.2–0.3 [49], a range which is tested in our experiments. It is important to note that in our method strain decays over distance from the contracting particle, so the contractile radial strain represents a maximum value. Many curves of modulus vs. strain initially decreased, indicating strain softening at contractile strains of up to 0.1. This initial strain softening has been reported in other studies as well [12, 27]. (Note that these studies and others applied uniform extension or simple shear, which produces a nominally constant strain throughout the fiber network.) For contractile strains in the range of 0.1 to 0.2, the curves then increased, indicating strain stiffening which is consistent with other studies applying shear or uniform extension, which also observed strain stiffening in this range [10, 14, 15, 21, 22, 24, 26].
Collagen networks having longer fibers, and some with short, exhibited a second regime of strain softening at a contractile radial strain of 0.2–0.3. Though the cause of strain softening is unclear, it is likely related to damage under these high strains. Consistent with this, other studies have observed permanent deformation [25, 39, 50], possibly associated with breaking of connections between fibers, which becomes more likely as the force supported by each fiber increases [51]. Data collected here show that the networks having the longest fibers have the greatest modulus, implying that they also support the greatest stress. Networks having longer fibers are also likely to have fewer connections between fibers. Therefore, networks having longer fibers likely have greater force supported by each fiber-to-fiber connection, which in turn may cause those connections to break more frequently at high strains, thereby producing the strain softening observed.
For all collagen networks, the measured modulus was heterogeneous over space. For collagen networks of 3 mg/ml, the local modulus varied by a factor of up to 3. Other studies using microrheology have reported an even larger range with values of stiffness varying by a factor of 10 [32, 52, 53]. The difference in heterogeneity between our results and those obtained by microrheology probably arises from the different length scales of the experimental methods. In our method we use particles having size of tens of microns, whereas microrheology uses much smaller particles, having size of ~ 1 μm. Such small particles would connect to only a few fibers. Slight variations in the number of fibers near to each particle would therefore produce large differences in the local stiffness detected by that particle. By contrast, the larger PNIPAAm particles used in this study attach to many fibers and therefore smooth out some heterogeneity due to randomness of the network. How a cell senses this heterogeneity may depend on the mechanism by which a cell senses the surrounding matrix. A single adhesion complex at the tip of a cell protrusion may interact with the matrix at scales < 1 μm, but mechanotransduction mechanisms are not restricted to the length scale of a focal adhesion. Studies on cytoskeletal signaling proteins have shown that integrin clustering and talin unfolding, which are dependent on the local stiffness at the site of the focal adhesion [54], also result in actin stress fibers that can propagate forces along the length of a cell’s protrusion and even to the nucleus [55]. Multiple mechanotransduction mechanisms result. Tension of actin stress fibers in the cytosekeleton allows for binding of numerous mechanosensitive proteins [54],and tensile forces applied by the cytoskeleton to the nucleus are a known mechanism for mechanotransduction [56, 57]. Therefore, it is reasonable to conclude that an important length scale for mechanotransduction is the distance connecting the adhesion complexes at the end of a cell’s protrusions to the nucleus, typically tens of μm. As our experimental method matches this length scale, it gives a relevant measure of modulus for mechanotransduction by the cytoskeleton and nucleus. At this scale, our data show that heterogeneity in the modulus is lower than measured by microrheology, but it is nevertheless significant.
The large heterogeneity in the modulus of fibrous materials implies that cell response to matrix mechanics is likely to be highly heterogeneous. This complicates our understanding of cell sensing of matrix properties, but the experimental method presented here could be a starting point for sorting out these complications. Experiments could be designed to test cell response to a distribution of moduli that matches the data collected here, for example by varying modulus by a factor of 3. By characterizing cell response to different distributions of moduli, it may be possible to relate specific cell behaviors to a range of moduli rather than to a single value. In addition, our experimental method could provide data needed to calibrate theoretical models for matrix mechanics. Those models, after validation by our experimental method, could then quantify mechanical properties (and their heterogeneity) in systems that are difficult to test experimentally, such as the microenvironment of a tumor.
Acknowledgments
We thank the Materials Science Center at the University of Wisconsin–Madison, which provided access to the spinning disk confocal microscope. This work was supported in part by NIH NCI P30CA014520–UW Comprehensive Cancer Center Support Grant and National Science Foundation grant number CMMI-1749400.
References
- [1].Discher D, Janmey P, and Wang Y-L Tissue cells feel and respond to the stiffness of their substrate. Science, 310:1139–1143, 2005. [DOI] [PubMed] [Google Scholar]
- [2].Lo CM, Wang HB, Dembo M, and Wang YL Cell movement is guided by the rigidity of the substrate. Biophys J, 79(1):144–152, 2000. [DOI] [PMC free article] [PubMed] [Google Scholar]
- [3].Paszek MJ, Zahir N, Johnson KR, Lakins JN, Rozenberg GI, Gefen A, Reinhart-King CA, Margulies SS, Dembo M, Boettiger D, Hammer DA, and Weaver VM Tensional homeostasis and the malignant phenotype. Cancer cell, 8(3):241–254, 2005. [DOI] [PubMed] [Google Scholar]
- [4].Provenzano PP, Inman DR, Eliceiri KW, Trier SM, and Keely PJ Contact guidance mediated three-dimensional cell migration is regulated by rho/rock-dependent matrix reorganization. Biophys J, 95(11):5374–5384, 2008. [DOI] [PMC free article] [PubMed] [Google Scholar]
- [5].Ulrich TA, de Juan Pardo EM, and Kumar S The mechanical rigidity of the extracellular matrix regulates the structure, motility, and proliferation of glioma cells. Cancer research, 69(10):4167–4174. [DOI] [PMC free article] [PubMed] [Google Scholar]
- [6].Riching KM, Cox BL, Salick MR, Pehlke C, Riching AS, Ponik SM, Bass BR, Crone WC, Jiang Y, Weaver AM, Eliceiri KW, and Keely PJ 3D collagen alignment limits protrusions to enhance breast cancer cell persistence. Biophys J, 107(11):2546–2558, 2014. [DOI] [PMC free article] [PubMed] [Google Scholar]
- [7].Engler AJ, Sen S, Sweeney HL, and Discher DE Matrix elasticity directs stem cell lineage specification. Cell, 126(4):677–689, 2006. [DOI] [PubMed] [Google Scholar]
- [8].Provenzano PP, Eliceiri KW, Campbell JM, Inman DR, White JG, and Keely PJ Collagen reorganization at the tumor-stromal interface facilitates local invasion. BMC Med, 4(1):1, 2006. [DOI] [PMC free article] [PubMed] [Google Scholar]
- [9].Provenzano PP, Inman DR, Eliceiri KW, and Keely PJ Matrix density-induced mechanoregulation of breast cell phenotype, signaling and gene expression through a fakerk linkage. Oncogene, 28(49):4326–4343, 2009. [DOI] [PMC free article] [PubMed] [Google Scholar]
- [10].Storm C, Pastore JJ, MacKintosh FC, Lubensky TC, and Janmey PA Nonlinear elasticity in biological gels. Nature, 435(7039):191–194, 2005. [DOI] [PubMed] [Google Scholar]
- [11].Stein AM, Vader DA, Weitz DA, and Sander LM The micromechanics of three-dimensional collagen-I gels. Complexity, 16(4):22–28, 2011. [Google Scholar]
- [12].Motte S and Kaufman LJ Strain stiffening in collagen I networks. Biopolymers, 99(1):35–46, 2013. [DOI] [PubMed] [Google Scholar]
- [13].Notbohm J, Lesman A, Rosakis P, Tirrell DA, and Ravichandran G Microbuckling of fibrin provides a mechanism for cell mechanosensing. J R Soc Interface, 12(108):20150320, 2015. [DOI] [PMC free article] [PubMed] [Google Scholar]
- [14].Vahabi M, Sharma A, Licup AJ, van Oosten AS, Galie PA, Janmey PA, and MacKintosh FC Elasticity of fibrous networks under uniaxial prestress. Soft Matter, 12(22):5050–5060, 2016. [DOI] [PubMed] [Google Scholar]
- [15].van Oosten AS, Vahabi M, Licup AJ, Sharma A, Galie PA, MacKintosh FC, and Janmey PA Uncoupling shear and uniaxial elastic moduli of semiflexible biopolymer networks: compression-softening and stretch-stiffening. Sci Rep, 6, 2016. [DOI] [PMC free article] [PubMed] [Google Scholar]
- [16].Burkel B and Notbohm J Mechanical response of collagen networks to nonuniform microscale loads. Soft Matter, 13(34):5749–5758, 2017. [DOI] [PubMed] [Google Scholar]
- [17].Shokef Y and Safran SA Scaling laws for the response of nonlinear elastic media with implications for cell mechanics. Phys Rev Lett, 108(17):178103, 2012. [DOI] [PubMed] [Google Scholar]
- [18].Wang H, Abhilash A, Chen CS, Wells RG, and Shenoy VB Long-range force transmission in fibrous matrices enabled by tension-driven alignment of fibers. Biophys J, 107(11):2592–2603, 2014. [DOI] [PMC free article] [PubMed] [Google Scholar]
- [19].Rosakis P, Notbohm J, and Ravichandran G A model for compression-weakening materials and the elastic fields due to contractile cells. J Mech Phys Solids, 85:18–32, 2015. [Google Scholar]
- [20].Xu X and Safran SA Nonlinearities of biopolymer gels increase the range of force transmission. Phys Rev E, 92(3):032728, 2015. [DOI] [PubMed] [Google Scholar]
- [21].Roeder BA, Kokini K, Sturgis JE, Robinson JP, and Voytik-Harbin SL Tensile mechanical properties of three-dimensional type i collagen extracellular matrices with varied microstructure. J Biomech Eng–T ASME, 124(2):214–222, 2002. [DOI] [PubMed] [Google Scholar]
- [22].Janmey PA, McCormick ME, Rammensee S, Leight JL, Georges PC, and MacKintosh FC Negative normal stress in semiflexible biopolymer gels. Nat Mater, 6(1):48–51, 2007. [DOI] [PubMed] [Google Scholar]
- [23].Brown AE, Litvinov RI, Discher DE, Purohit PK, and Weisel JW Multiscale mechanics of fibrin polymer: gel stretching with protein unfolding and loss of water. Science, 325(5941):741–474, 2009. [DOI] [PMC free article] [PubMed] [Google Scholar]
- [24].Vader D, Kabla A, Weitz D, and Mahadevan L Strain-induced alignment in collagen gels. Plos One, 4(6):e5902, 2009. [DOI] [PMC free article] [PubMed] [Google Scholar]
- [25].Münster S, Jawerth LM, Leslie BA, Weitz JI, Fabry B, and Weitz DA Strain history dependence of the nonlinear stress response of fibrin and collagen networks. P Natl Acad Sci USA, 110(30):12197–12202, 2013. [DOI] [PMC free article] [PubMed] [Google Scholar]
- [26].Kim OV, Litvinov RI, Weisel JW, and Alber MS Structural basis for the nonlinear mechanics of fibrin networks under compression. Biomaterials, 35(25):6739–6749, 2014. [DOI] [PMC free article] [PubMed] [Google Scholar]
- [27].Kurniawan NA, Wong LH, and Rajagopalan R Early stiffening and softening of collagen: interplay of deformation mechanisms in biopolymer networks. Biomacromolecules, 13(3):691–698, 2012. [DOI] [PubMed] [Google Scholar]
- [28].Lin DC, Shreiber DI, Dimitriadis EK, and Horkay F Spherical indentation of soft matter beyond the hertzian regime: numerical and experimental validation of hyperelastic models. Biomech Model Mechan, 8(5):345–358, 2009. [DOI] [PMC free article] [PubMed] [Google Scholar]
- [29].Velegol D and Lanni F Cell traction forces on soft biomaterials. I. microrheology of type I collagen gels. Biophys J, 81(3):1786–1792, 2001. [DOI] [PMC free article] [PubMed] [Google Scholar]
- [30].Kotlarchyk MA, Shreim SG, Alvarez-Elizondo MB, Estrada LC, Singh R, Valdevit L, Kniazeva E, Gratton E, Putnam AJ, and Botvinick EL Concentration independent modulation of local micromechanics in a fibrin gel. Plos One, 6(5), 2011. [DOI] [PMC free article] [PubMed] [Google Scholar]
- [31].Shayegan M and Forde NR Microrheological characterization of collagen systems: from molecular solutions to fibrillar gels. Plos One, 8(8):e70590, 2013. [DOI] [PMC free article] [PubMed] [Google Scholar]
- [32].Jones CA, Cibula M, Feng J, Krnacik EA, McIntyre DH, Levine H, and Sun B Micromechanics of cellularized biopolymer networks. P Natl Acad Sci USA, 112(37):E5117–E5122, 2015. [DOI] [PMC free article] [PubMed] [Google Scholar]
- [33].Koch TM, Munster S, Bonakdar N, Butler JP, and Fabry B 3D traction forces in cancer cell invasion. Plos One, 7(3), 2012. [DOI] [PMC free article] [PubMed] [Google Scholar]
- [34].Lesman A, Notbohm J, Tirrell D, and Ravichandran G Contractile forces regulate cell division in three-dimensional environments. J Cell Biol, 205(2):155–162, 2014. [DOI] [PMC free article] [PubMed] [Google Scholar]
- [35].Notbohm J, Lesman A, Tirrell DA, and Ravichandran G Quantifying cell-induced matrix deformation in three dimensions based on imaging matrix fibers. Integr Biol, 7(10):1186–1195, 2015. [DOI] [PubMed] [Google Scholar]
- [36].Owen LM, Adhikari AS, Patel M, Grimmer P, Leijnse N, Kim MC, Notbohm J, Franck C, and Dunn AR A cytoskeletal clutch mediates cellular force transmission in a soft, three-dimensional extracellular matrix. Mol Biol Cell, 28(14):1959–1974, 2017. [DOI] [PMC free article] [PubMed] [Google Scholar]
- [37].Grimmer P and Notbohm J Displacement propagation in fibrous networks due to local contraction. J Biomech Eng, 140(4):041011, 2018. [DOI] [PubMed] [Google Scholar]
- [38].Eshelby JD The elastic field outside an ellipsoidal inclusion. P Roy Soc Lond A Mat, 252(1271):561–569, 1959. [Google Scholar]
- [39].Burkel B, Proestaki M, Tyznik S, and Notbohm J Heterogeneity and nonaffinity of cell-induced matrix displacements. Under review. [DOI] [PMC free article] [PubMed] [Google Scholar]
- [40].Raub C, Putnam A, Tromberg B, and George S Predicting bulk mechanical properties of cellularized collagen gels using multiphoton microscopy. Acta Biomater, 6(12):4657–4665, 2010. [DOI] [PMC free article] [PubMed] [Google Scholar]
- [41].Lopez-Garcia M d. C., Beebe, D., and Crone, W. Mechanical interactions of mouse mammary gland cells with collagen in a three-dimensional construct. Ann Biomed Eng, 38(8):2485–2498, 2010. [DOI] [PubMed] [Google Scholar]
- [42].Burkel B, Morris BA, Ponik SM, Riching KM, Eliceiri KW, and Keely PJ Preparation of 3D collagen gels and microchannels for the study of 3D interactions in vivo. J Vis Exp, (111), 2016. [DOI] [PMC free article] [PubMed] [Google Scholar]
- [43].Yeung T, Georges PC, Flanagan LA, Marg B, Ortiz M, Funaki M, Zahir N, Ming W, Weaver V, and Janmey PA Effects of substrate stiffness on cell morphology, cytoskeletal structure, and adhesion. Cell Motil Cytoskel, 60(1):24–34, 2005. [DOI] [PubMed] [Google Scholar]
- [44].Sierra-Martin B, Frederick JA, Laporte Y, Markou G, Lietor-Santos JJ, and Fernandez-Nieves A Determination of the bulk modulus of microgel particles. Colloid Polym Sci, 289(5):721–728, 2011. [Google Scholar]
- [45].Voudouris P, Florea D, van der Schoot P, and Wyss HM Micromechanics of temperature sensitive microgels: dip in the poisson ratio near the lcst. Soft Matter, 9(29):7158–7166, 2013. [Google Scholar]
- [46].Licup AJ, Mu¨nster S, Sharma A, Sheinman M, Jawerth LM, Fabry B, Weitz DA, and MacKintosh FC Stress controls the mechanics of collagen networks. P Natl Acad Sci USA, 112(31):9573–9578, 2015. [DOI] [PMC free article] [PubMed] [Google Scholar]
- [47].Yang Y. l., Leone LM, and Kaufman LJ Elastic moduli of collagen gels can be predicted from two-dimensional confocal microscopy. Biophys J, 97(7):2051–2060, 2009. [DOI] [PMC free article] [PubMed] [Google Scholar]
- [48].Feng J, Levine H, Mao X, and Sander LM Alignment and nonlinear elasticity in biopolymer gels. Phys Rev E, 91(4):042710, 2015. [DOI] [PubMed] [Google Scholar]
- [49].Stout DA, Bar-Kochba E, Estrada JB, Toyjanova J, Kesari H, Reichner JS, and Franck C Mean deformation metrics for quantifying 3d cell–matrix interactions without requiring information about matrix material properties. P Natl Acad Sci USA, 113(11):2898–2903, 2016. [DOI] [PMC free article] [PubMed] [Google Scholar]
- [50].Nam S, Lee J, Brownfield DG, and Chaudhuri O Viscoplasticity enables mechanical remodeling of matrix by cells. Biophys J, 111(10):2296–2308, 2016. [DOI] [PMC free article] [PubMed] [Google Scholar]
- [51].Nam S, Hu KH, Butte MJ, and Chaudhuri O Strain-enhanced stress relaxation impacts nonlinear elasticity in collagen gels. P Natl Acad Sci USA, page 201523906, 2016. [DOI] [PMC free article] [PubMed] [Google Scholar]
- [52].Velegol D and Lanni F Cell traction forces on soft biomaterials. I. Microrheology of type I collagen gels. Biophys J, 81(3):1786–1792, 2001. [DOI] [PMC free article] [PubMed] [Google Scholar]
- [53].Kotlarchyk MA, Shreim SG, Alvarez-Elizondo MB, Estrada LC, Singh R, Valdevit L, Kniazeva E, Gratton E, Putnam AJ, and Botvinick EL Concentration independent modulation of local micromechanics in a fibrin gel. Plos One, 6(5):1–12, 2011. [DOI] [PMC free article] [PubMed] [Google Scholar]
- [54].Hu X, Margadant FM, Yao M, and Sheetz MP Molecular stretching modulates mechanosensing pathways. Protein Science, 26(7):1337–1351, 2017. [DOI] [PMC free article] [PubMed] [Google Scholar]
- [55].Maniotis AJ, Chen CS, and Ingber DE Demonstration of mechanical connections between integrins, cytoskeletal filaments, and nucleoplasm that stabilize nuclear structure. P Natl Acad Sci USA, 94(3):849–854, 1997. [DOI] [PMC free article] [PubMed] [Google Scholar]
- [56].Cho S, Irianto J, and Discher DE Mechanosensing by the nucleus: From pathways to scaling relationships. J Cell Biol, pages jcb–201610042, 2017. [DOI] [PMC free article] [PubMed] [Google Scholar]
- [57].Kirby TJ and Lammerding J Emerging views of the nucleus as a cellular mechanosensor. Nat Cell Biol, page 1, 2018. [DOI] [PMC free article] [PubMed] [Google Scholar]


