

Abstract
Hyperuricemia has received increasing attention as a major public health problem. This study aims to investigate the risk factors for hyperuricemia and to explore the relationship between changes in biochemical variables and incident hyperuricemia.
A cross-sectional and subsequently prospective study was performed among adults who took their health checkups at Zhejiang University Hospital. The participants who were free of hyperuricemia at baseline received annual follow-up examinations during a 6-year period. Cox proportional hazards regression analyses were conducted to calculate the risks for incident hyperuricemia.
Of the 9238 participants enrolled, 1704 (18.4%) were diagnosed as hyperuricemia. During 21,757 person-years of follow-up, 1492 incident hyperuricemia cases were identified. The incidence of hyperuricemia was 68.58 cases per 1000 person-year of follow-up in the overall participants. The prevalence and the incidence of hyperuricemia increased greatly in female older than 50 years. High levels of BMI, SBP, FPG, TG, LDL-C, ALT, BUN, and creatinine increased the risk of hyperuricemia. Suffering fatty liver also increased the risk of hyperuricemia. Subjects with increasing DBP, TG, BUN, creatinine, or decreasing HDL-C were more likely to incident hyperuricemia.
This study revealed that the change of diastolic blood pressure (DBP), serum triglycerides (TG), blood urea nitrogen (BUN), creatinine, and high-density lipoprotein cholesterol (HDL-C) level were independently associated with incident hyperuricemia.
Keywords: cross-sectional study, dyslipidemia, hyperuricemia, longitudinal study, risk factor, triglycerides, uric acid
1. Introduction
Uric acid is the final enzymatic product of purine metabolism and it has the ability to scavenge oxygen radicals and protect the erythrocyte membrane from lipid oxidation.[1] However, elevated serum uric acid (hyperuricemia) is associated with significantly increased risk for gout, cardiovascular disease, chronic kidney disease (CKD), and type 2 diabetes mellitus. Hyperuricemia has received increasing attention as a major public health problem in China because of its high prevalence and the associated increases in the risk of gout, hypertension, cardiovascular disease and CKD.[2–5] What is more, hyperuricemia also plays an important role in metabolic related diseases, such as metabolic syndrome, diabetes and non-alcoholic fatty liver disease (NAFLD).[6,7]
The prevalence of hyperuricemia varies across different populations and different areas. In the first decades of 21st century, an epidemiological survey estimates approximately 43.3 million US adults (21.4%) met criteria for hyperuricemia.[8] A cross-sectional reported that the prevalence of hyperuricemia among Chinese adults was 8.4%,[9] and a meta-analysis indicated the pooled prevalence of hyperuricemia was 13.3% in China.[10]
To better understanding of which individuals are at risk of developing hyperuricemia is crucial. Nowadays, more and more research focuses on the risk factors of hyperuricemia. Peng et al found that, low-density lipoprotein cholesterol (LDL-C), triglycerides (TGs), total cholesterol, apolipoprotein-B levels, ratio of TGs to high-density lipoprotein cholesterol (HDL-C) were strongly associated with serum uric acid levels, whereas serum HDL-C levels were significantly inversely associated.[11] A study from US reported that individuals with uncontrolled blood pressure and additional cardiovascular disease risk factors demonstrated a 4-fold or greater prevalence of hyperuricemia.[12] Another study also showed that higher blood hematocrit was independently associated with the incidence of hyperuricemia.[13] However, most of these studies were cross-sectional in nature and thus could not address the cause-effect relationship between the variables and hyperuricemia. Moreover, some prospective studies related to hyperuricemia did not assess the relationship between the changes in variables and incident hyperuricemia.
In this study, we conducted a cross-sectional and prospective study in a Chinese population to find the risk factors for hyperuricemia and to explore the relationship between changes in variables and incident hyperuricemia.
2. Methods
2.1. Study population
We conducted a cross-sectional and subsequently prospective study among adults who took their health checkups at Zhejiang University Hospital. At baseline, all the participants who took their annual health checkups in 2011 were screened for enrollment. Those with missing data on serum uric acid or other variables, or those with a history of malignancy were excluded. A total of 9238 participants (5258 men and 3980 women) were qualified for the cross-sectional study. The participants who were free of hyperuricemia at baseline were followed up annually.
2.2. Baseline evaluations
Baseline examinations were performed according to previously described procedures. We collected the standing height, body weight, and blood pressure for all participants. Height and weight were measured while participants were wearing light clothing without shoes. Body mass index (BMI) (kg/m2) is calculated as the body weight (kg) divided by the standing height (m) squared. Blood pressure was measured using a standard protocol.
Fasting serum samples were obtained for the analysis of biochemical values. The values were measured by an Hitachi 7180 auto-analyzer (Hitachi, Tokyo, Japan) using standard methods. Hyperuricemia was defined as serum uric acid levels >420 μmol/L in men and >360 μmol/L in women, and/or taking medication for hyperuricemia.
Fatty liver was diagnosed by abdominal ultrasound examination. Trained ultrasonographists performed abdominal ultrasound examinations with a Sonoline G60S ultrasound system with a 3.5-MHz probe (Siemens, Erlangen, Germany). The ultrasonographists were blinded to the study design and the clinical data. The criteria for ultrasonic diagnosis of fatty liver were based on those suggested by the Chinese Liver Disease Association.
2.3. Follow-up evaluations
To identify incident cases of hyperuricemia during the follow-up period, the subjects who were free of hyperuricemia at baseline received annual follow-up examinations during a 6-year period. The method used for the measurement of serum uric acid and the definition of hyperuricemia was the same as that used at baseline. Incident hyperuricemia was identified if serum uric acid levels higher than the threshold (>420 μmol/L in men and >360 μmol/L in women) were detected at any of the follow-up examinations. The follow-up time was calculated as the difference between baseline and the examination when incident hypertension was first identified. For participants who did not develop hyperuricemia, the follow-up time was censored at the last known follow-up examination.
2.4. Ethics
All participants were verbally informed about the study's aim and procedures, and voluntarily consented to participate. The subject information was anonymized at collection and prior to analysis. All methods were performed in accordance with the approved guidelines. The study gained approval of the Ethics Committee of Zhejiang University Hospital.
2.5. Statistical analysis
The statistical analyses were performed using SPSS 18.0 (SPSS, Chicago, IL). Continuous variables were presented as medians and interquartile range. They were compared by Student's t test or Mann–Whitney U test, one-way ANOVA with post hoc Tukey's test, or Kruskal–Wallis test with Bonferroni correction as appropriate. Categorical variables were compared using the χ2 test. Cochran–Armitage trend test was used to show the trend of the prevalence. A stepwise logistic regression analysis was performed to examine the relationship between hyperuricemia and anthropometric or biochemical variables (probability to enter = .05 and probability to remove = .10). Cox proportional hazards regression analyses were applied to calculate the risks for incident hyperuricemia. Backward stepwise regression was used in multivariate Cox proportional hazards regression analyses (probability to enter = .05 and probability to remove = .10). A P value <.05 (two-tailed) was considered to be statistically significant.
3. Results
3.1. Baseline characteristics
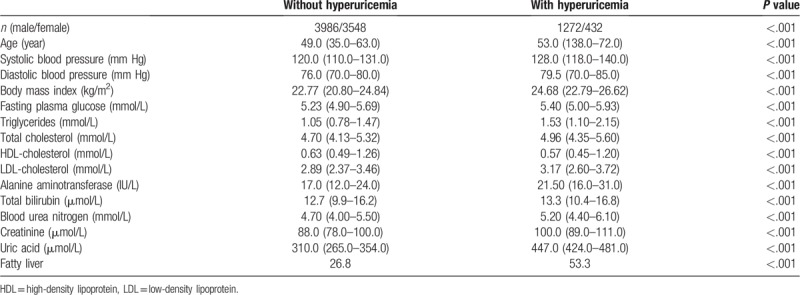
A total of 9238 participants with a median age of 49.0 were included in this study, 5258 were male and 3980 were female. Of the 9238 participants enrolled, 1704 (18.4%) were diagnosed as hyperuricemia. The characteristics of participants according to baseline hyperuricemia status are presented in Table 1. The participants with hyperuricemia had greater BMI, higher systolic and diastolic blood pressure, fasting plasma glucose (FPG), and worse lipid profiles compared with those without hyperuricemia. Moreover, there were significant differences in alanine aminotransferase (ALT), blood urea nitrogen (BUN), creatinine, total bilirubin between the two groups.
Table 1.
Characteristics of participants according to their baseline hyperuricemia status.
The prevalence of hyperuricemia was almost the same in different age groups in male, while the prevalence of hyperuricemia increased in female older than 50 year (Fig. 1). We analyzed the risk factors of hyperuricemia by stepwise logistic regression analysis. The multivariable model showed that BMI, SBP, FPG, TGs, LDL-C, ALT, BUN, and creatinine were associated with risk for hyperuricemia (Table 2). Whether suffering from fatty liver were also associated with risk for hyperuricemia.
Figure 1.
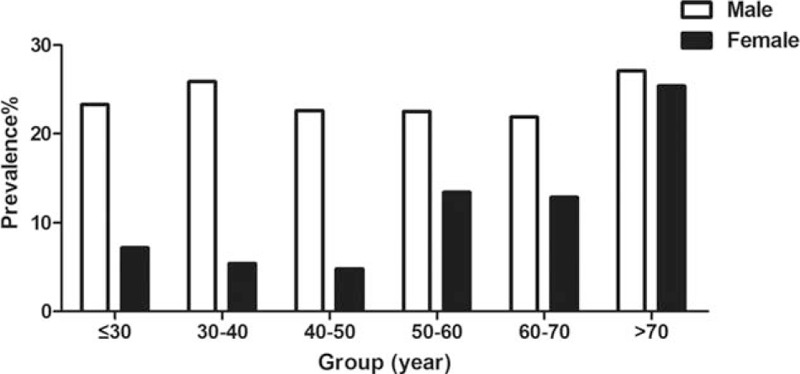
The prevlance of hyperuricemia according to the gender and age.
Table 2.
Stepwise logistic regression analysis of hyperuricemia with anthropometric and biochemical variables.
3.2. Follow-up outcomes
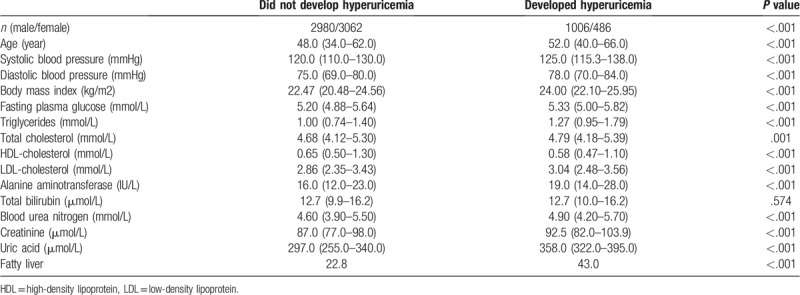
A total of 7534 participants (3986 male and 3548 female) without hyperuricemia were enrolled at baseline of the 6-year follow up. During 21,757 person-years of follow-up, 1492 incident hyperuricemia cases were identified. The incidence of hyperuricemia was 68.58 cases per 1000 person-year of follow-up in the overall participants. The participants who developed hyperuricemia had higher baseline than those who did not in terms of gender, blood pressure, BMI, FPG, TG, total cholesterol (TC), LDL-C, ALT, BUN, creatinine, and lower baseline levels of HDL-C (Table 3).
Table 3.
Comparison of baseline characteristics of participates according to follow-up outcomes.
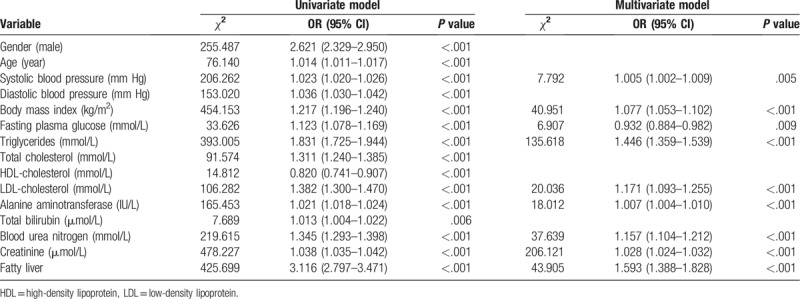
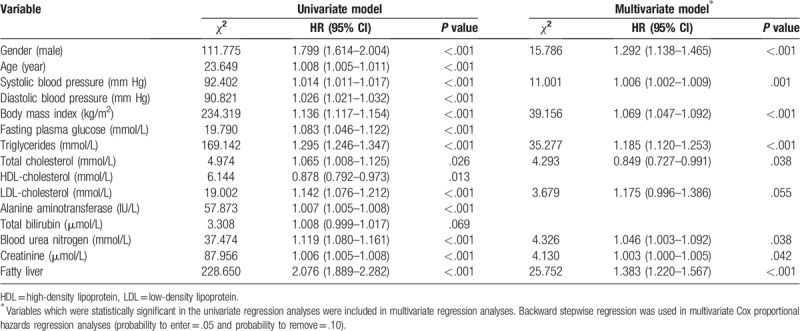
The incidence of hyperuricemia decreased in male older than 60 years, while the incidence of hyperuricemia in female increased with age (Fig. 2). Cox proportional hazards regression analyses were applied to explore the risk factors of incident hyperuricemia. The multivariable model showed that gender, BMI, systolic blood pressure (SBP), TG, TC, LDL-C, BUN, and creatinine were associated with risk factors of incident hyperuricemia. Besides, participates who had fatty liver at baseline were more likely to develop hyperuricemia (Table 4).
Figure 2.
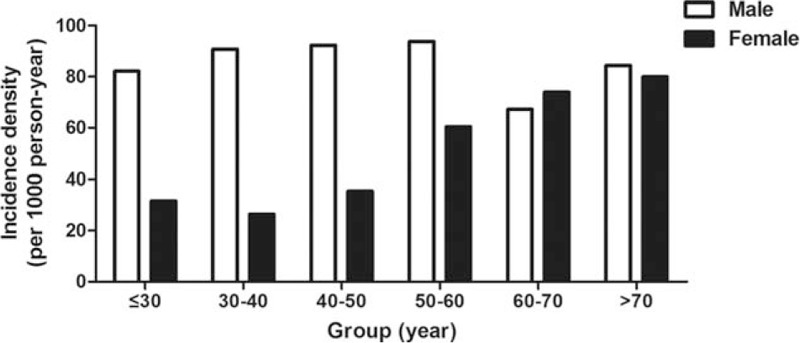
The incidence of hyperuricemia according the gender and age.
Table 4.
Univariate and multivariate Cox proportional hazards regression analyses for the population.
3.3. Changes of variables and risk for incident hyperuricemia
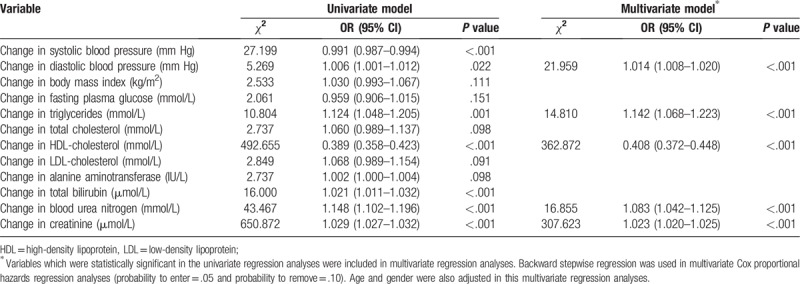
We next assessed the changes of the variables mentioned above and the risk for incident hyperuricemia. By univariate analysis, incident hyperuricemia was associated with increasing diastolic blood pressure (DBP), TG, ALT, BUN, creatinine, and decreasing SBP and HDL-C. By multivariate analysis, increasing DBP, TG, BUN, creatinine, and decreasing HDL-C remained as independent factors associated with incident hyperuricemia (Table 5).
Table 5.
Factors associated with incident hyperuricemia.
4. Discussion
In this study, we confirmed that gender, BMI, SBP, TG, TC, LDL-C, BUN, and creatinine were associated with risk factors of incident hyperuricemia. Moreover, we provided evidence that increasing DBP, TG, BUN, creatinine, and decreasing HDL-C level also independently associated with incident hyperuricemia.
Previous meta-analysis showed that the prevalence of hyperuricemia in China was about 13.3%.[10] Zhang et al also reported that the incidence of hyperuricemia was 22.4 per 1000 in a 3-year prospective study.[14] Besides, a long-term research found that the incidence of hyperuricemia was 43.6 per 1000 person-year.[13] In this cross-sectional study, we observed that the prevalence of hyperuricemia in this population was 18.4%, and in the prospective study, the incidence of hyperuricemia was 68.58 cases per 1000 person-year. Epidemiological surveys showed that hyperuricemia is quite prevalent in areas with high gross domestic product levels in China.[9] The differences in prevalence and incidence of hyperuricemia may be attributed to the rapidly developing economy in Hangzhou. It is worth noting that with the acceleration of China's economic development, the prevalence and incidence of hyperuricemia may increase further.
In this study, we observed that the prevalence and the incidence of hyperuricemia increased greatly in female more than 50 years old. This phenomenon was also found in other studies.[15,16] This is primarily attributable to sex hormone effects on renal urate transport. It has been reported that estrogen plays a role in renal clearance, secretion and reabsorption thus affect SUA levels.[17] Young adult women have lower serum urate levels than young adult men, but the onset of menopause is associated with increased serum urate levels.[18]
Several cross-sectional studies have showed that lipid profiles are closely related to hyperuricemia.[11,19,20] Some drugs used to treat dyslipidemia like fenofibrate were effective in reducing serum concentration of uric acid.[21] Our study suggested that the changes in lipid profiles were independent factors associated with incident hyperuricemia, this results further demonstrated that dyslipidemia could cause hyperuricemia, especially TG and HDL-C. Our study is consistent with previous studies that NAFLD was strongly associated with subsequent development of hyperuricemia.[7,22] Some prospective studies also indicated that serum uric acid levels independently predicted increased risk for incident NAFLD.[23,24] These evidences showed that NAFLD and hyperuricemia could cause and worsen each other and result in a more deteriorated metabolic status.
Treatment of asymptomatic hyperuricemia has been found to improve health outcomes in patients. It is reported that treating asymptomatic hyperuricemia is s most effective in preventing vascular events in a serum urate above 7.0 mg/dL in men and 5.0 mg/dL in women.[25] Our findings may help guide clinical decision-making to help identify which patients are at highest risk of developing hyperuricemia based on patient characteristics.
Several limitations were acknowledged in this study. First, dietary and lifestyle information was not collected, although dietary intake could be a cofactor associated with hyperuricemia. Some studies have showed that fructose-enriched food and drink could increase serum UA levels.[26] While high tea intake and consuming midnight snack rarely are significantly related to decreased risk of hyperuricemia.[27] Meanwhile, we did not assess the changes in variables and disease outcomes in individuals after treatment for hyperuricemia, future research should establish the clinical effectiveness of predicting and treating incident hyperuricemia to prevent the onset of adverse outcomes.
In conclusion, our study found that the change of DBP, serum TG, BUN, creatinine, and HDL-C level were independently associated with incident hyperuricemia. This finding may help identify which patients are at highest risk of developing hyperuricemia. Clinicians should pay attention to the changes of these indicators to reduce the incidence of hyperuricemia.
Author contributions
Conceptualization: Renbing Zhang.
Data curation: Qun Ni.
Formal analysis: Xiaomin Lu.
Methodology: Congcong Chen.
Project administration: Huaqing Du.
Software: Huaqing Du.
Validation: Congcong Chen.
Visualization: Xiaomin Lu.
Writing – original draft: Qun Ni.
Writing – review & editing: Renbing Zhang.
Footnotes
Abbreviations: ALT = alanine aminotransferase, BMI = body mass index, BUN = blood urea nitrogen, CKD = chronic kidney disease, DBP = diastolic blood pressure, FPG = fasting plasma glucose, HDL-C = high-density lipoprotein cholesterol, LDL-C = low-density lipoprotein cholesterol, NAFLD = non-alcoholic fatty liver disease, SBP = systolic blood pressure, TC = total cholesterol, TG = triglycerides.
How to cite this article: Ni Q, Lu X, Chen C, Du H, Zhang R. Risk factors for the development of hyperuricemia. Medicine. 2019;98:42(e17597).
The authors have no funding and conflicts of interest to disclose.
References
- [1].Maiuolo J, Oppedisano F, Gratteri S, et al. Regulation of uric acid metabolism and excretion. Int J Cardiol 2016;213:8–14.. [DOI] [PubMed] [Google Scholar]
- [2].Abeles AM. Hyperuricemia, gout, and cardiovascular disease: an update. Curr Rheumatol Rep 2015;17:13. [DOI] [PubMed] [Google Scholar]
- [3].Borghi C, Rosei EA, Bardin T, et al. Serum uric acid and the risk of cardiovascular and renal disease. J hypertens 2015;33:1729–41.. discussion 1741. [DOI] [PubMed] [Google Scholar]
- [4].Mallat SG, Al Kattar S, Tanios BY, et al. Hyperuricemia, hypertension, and chronic kidney disease: an Emerging Association. Curr Hypertens Rep 2016;18:74. [DOI] [PubMed] [Google Scholar]
- [5].Wang J, Qin T, Chen J, et al. Hyperuricemia and risk of incident hypertension: a systematic review and meta-analysis of observational studies. PLoS One 2014;9:e114259. [DOI] [PMC free article] [PubMed] [Google Scholar]
- [6].Li C, Hsieh MC, Chang SJ. Metabolic syndrome, diabetes, and hyperuricemia. Curr Opin Rheumatol 2013;25:210–6.. [DOI] [PubMed] [Google Scholar]
- [7].Xu C, Wan X, Xu L, et al. Xanthine oxidase in non-alcoholic fatty liver disease and hyperuricemia: one stone hits two birds. J Hepatol 2015;62:1412–9.. [DOI] [PubMed] [Google Scholar]
- [8].Zhu Y, Pandya BJ, Choi HK. Prevalence of gout and hyperuricemia in the US general population: the National Health and Nutrition Examination Survey 2007-2008. Arthritis Rheum 2011;63:3136–41.. [DOI] [PubMed] [Google Scholar]
- [9].Liu H, Zhang XM, Wang YL, et al. Prevalence of hyperuricemia among Chinese adults: a national cross-sectional survey using multistage, stratified sampling. J Nephrol 2014;27:653–8.. [DOI] [PubMed] [Google Scholar]
- [10].Liu R, Han C, Wu D, et al. Prevalence of hyperuricemia and gout in Mainland China from 2000 to 2014: a systematic review and meta-analysis. BioMed Res Int 2015;2015:762820. [DOI] [PMC free article] [PubMed] [Google Scholar]
- [11].Peng TC, Wang CC, Kao TW, et al. Relationship between hyperuricemia and lipid profiles in US adults. BioMed Res Int 2015;2015:127596. [DOI] [PMC free article] [PubMed] [Google Scholar]
- [12].Juraschek SP, Kovell LC, Miller ER, et al. Dose-response association of uncontrolled blood pressure and cardiovascular disease risk factors with hyperuricemia and gout. PLoS One 2013;8:e56546. [DOI] [PMC free article] [PubMed] [Google Scholar]
- [13].Zeng C, Wei J, Yang T, et al. Higher blood hematocrit predicts hyperuricemia: a prospective study of 62,897 person-years of follow-up. Sci Rep 2015;5:13765. [DOI] [PMC free article] [PubMed] [Google Scholar]
- [14].Zhang YN, Xu C, Xu L, et al. High serum ferritin levels increase the risk of hyperuricemia: a cross-sectional and longitudinal study. Ann Nutr Metab 2014;64:6–12.. [DOI] [PubMed] [Google Scholar]
- [15].Gaffo AL, Jacobs DR, Jr, Lewis CE, et al. Association between being African-American, serum urate levels and the risk of developing hyperuricemia: findings from the Coronary Artery Risk Development in Young Adults cohort. Arthritis Res Ther 2012;14:R4. [DOI] [PMC free article] [PubMed] [Google Scholar]
- [16].McAdams-DeMarco MA, Law A, Maynard JW, et al. Risk factors for incident hyperuricemia during mid-adulthood in African American and white men and women enrolled in the ARIC cohort study. BMC Musculoskelet Disord 2013;14:347. [DOI] [PMC free article] [PubMed] [Google Scholar]
- [17].Koga M, Saito H, Mukai M, et al. Factors contributing to increased serum urate in postmenopausal Japanese females. Climacteric 2009;12:146–52.. [DOI] [PubMed] [Google Scholar]
- [18].Hak AE, Choi HK. Menopause, postmenopausal hormone use and serum uric acid levels in US women – the Third National Health and Nutrition Examination Survey. Arthritis Res Ther 2008;10:R116. [DOI] [PMC free article] [PubMed] [Google Scholar]
- [19].Stelmach MJ, Wasilewska N, Wicklund-Liland LI, et al. Blood lipid profile and BMI-Z-score in adolescents with hyperuricemia. Ir J Med Sci 2015;184:463–8.. [DOI] [PubMed] [Google Scholar]
- [20].Xu J, Peng H, Ma Q, et al. Associations of non-high density lipoprotein cholesterol and traditional blood lipid profiles with hyperuricemia among middle-aged and elderly Chinese people: a community-based cross-sectional study. Lipids Health Dis 2014;13:117. [DOI] [PMC free article] [PubMed] [Google Scholar]
- [21].Derosa G, Maffioli P, Sahebkar A. Plasma uric acid concentrations are reduced by fenofibrate: a systematic review and meta-analysis of randomized placebo-controlled trials. Pharmacol Res 2015;102:63–70.. [DOI] [PubMed] [Google Scholar]
- [22].Ryu S, Chang Y, Zhang Y, et al. A cohort study of hyperuricemia in middle-aged South Korean men. Am J Epidemiol 2012;175:133–43.. [DOI] [PubMed] [Google Scholar]
- [23].Ryu S, Chang Y, Kim SG, et al. Serum uric acid levels predict incident nonalcoholic fatty liver disease in healthy Korean men. Metabolism 2011;60:860–6.. [DOI] [PubMed] [Google Scholar]
- [24].Xu C, Yu C, Xu L, et al. High serum uric acid increases the risk for nonalcoholic fatty liver disease: a prospective observational study. PLoS One 2010;5:e11578. [DOI] [PMC free article] [PubMed] [Google Scholar]
- [25].Akkineni R, Tapp S, Tosteson AN, et al. Treatment of asymptomatic hyperuricemia and prevention of vascular disease: a decision analytic approach. J Rheumatol 2014;41:739–48.. [DOI] [PubMed] [Google Scholar]
- [26].Caliceti C, Calabria D, Roda A. Cicero AFG fructose intake, serum uric acid, and cardiometabolic disorders: a critical review. Nutrients 2017;9: [DOI] [PMC free article] [PubMed] [Google Scholar]
- [27].Li X, Song P, Li J, et al. Relationship between hyperuricemia and dietary risk factors in Chinese adults: a cross-sectional study. Rheumatol Int 2015;35:2079–89.. [DOI] [PubMed] [Google Scholar]