Abstract
Symptoms of intervertebral foraminal stenosis are caused by compression of nerve root exiting the intervertebral foramen. Many attempts to measure the size of the neuromuscular exit have been made; however, only a few studies to compare the area differences between foramens by computed tomography (CT) were done. In this retrospective comparative study, we used the region of interest (ROI) in CT to measure and compare the area of intervertebral foramen between the healthy control group and the patient group.
Eighty-one patients who underwent CT of the lumbar spine between May 2014 and December 2017 were enrolled. Using the medical imaging program, the foraminal area between L5 and S1 vertebrae was measured on the sagittal, coronal, and axial planes using ROI. Four groups were established for comparison: those diagnosed with foraminal stenosis by a radiologist and those who were not, those diagnosed with foraminal stenosis by orthopedic surgeons and those who were not. These groups were further divided into subcategories depending on whether the area was operated on for foraminal stenosis. Interobserver and intraobserver agreements were assessed.
The mean age of patients was 56.5 years (range 17–84). The foraminal area of the surgical group on sagittal plane was significantly narrower than the control group (P = .005). However, the difference between the 2 groups on axial and coronal planes was not statistically significant (P > .1). Foraminal area <80 mm2 on sagittal images was a statistically significant risk factor for clinical symptom (P = .028) and that <65 mm2 was a statistically significant risk factor in predicting operability (P = .01). Interobserver and intraobserver agreements were fair to good on axial and coronal planes (about 0.7), whereas the agreements were excellent on sagittal plane (>0.9).
In this study, we proved that measuring the intervertebral foraminal area using the ROI in CT in the lumbar spine is useful for diagnosing L5-S1 foraminal stenosis, especially on sagittal plane. Furthermore, not only does it provide aid in diagnosis, but it also helps predicting the operability of foraminal stenosis.
Keywords: computed tomography, diagnosis, foraminal stenosis, region of interest
1. Introduction
It has been reported that foraminal stenosis is often the cause of lumbar radiculopathy. Moreover, the compression of nerve root is observed in 8% to 11% of all radiating pain.[1–3] Also, Burton et al reported that overlooked foraminal stenosis or untreated foraminal stenosis attribute to 60% of patients with failed back surgery syndrome.[4] Thus, there have been many radiologic studies to establish a method to measure and analyze the anatomical structures that comprise and may compress the intervertebral foramen.
The recent most widely accepted concept of anatomical structure of intervertebral foramen was published by Jenis and An, establishing an hour-glass-shaped intervertebral compartment with the superior and inferior pedicular boundaries.[5] In details, the anatomic boundaries include: the inferior border of upper level pedicle as superior boundary, the superior border of lower level pedicle as inferior boundary, the posteroinferior margin of upper level vertebral body, the posterior margin of intervertebral disc, and the posterosuperior margin of lower level vertebral body as anterior boundaries, and the ligamentum flavum and upper and lower facet joints as posterior boundaries. Therefore, space compression due to intervertebral disc degeneration or herniation, formation of bony spurs, or hypertrophy of facet joint or ligamentum flavum may result in foraminal stenosis.
The most vulnerable structure for foraminal stenosis is the 5th lumbar nerve root, which accounts for about 75% of nerve root compression associated with foraminal stenosis. The lower lumbar segments are more susceptible to intervertebral disc degeneration and spondylosis than upper segments due to higher ratio between foramen and nerve root/dorsal root ganglion cross-sectional areas.[6]
The role of computed tomography (CT) has been limited in detecting bone invasion since the intervertebral foramen is comprised of various soft tissues. Thus, magnetic resonance imaging (MRI) has been used as the diagnostic tool for foraminal stenosis in many studies.[7–9] However, most studies assessed the degree of nerve root compression on cross-sectional images, whereas studies to measure the extent of the narrowed vertebral foramen are rare. Recently, Khiami et al used software known as VitreaCore to measure the volume of intervertebral foramen of healthy population on CT.[10] Nakao et al measured the area of stenosis using 3-dimensional (3D) CT reconstructed images of extraforaminal stenosis patients.[11] However, no study has been done to measure the area of intervertebral foramen using conventional CT with ease of use.
The aim of the study was to compare the measured area of intervertebral foramen between L5-S1 foraminal stenosis patients and healthy population, using a region of interest (ROI) in CT with commonly used medical imaging program. Furthermore, we tried to assess the cutoff value of foraminal area for operability.
2. Materials and methods
This study was approved by the institutional review board of Catholic Kwandong University International St Mary's Hospital, which allowed us to waive the requirement of patient informed consent for restrospective investigation.
A total of 113 patients who underwent lumbar spine CT between May 2014 and December 2017 were enrolled in this study. All images were acquired at 3-mm slice thickness with a dual source CT (Somatom Definition Flash; Siemens Medical, Forcheim, Germany) including spine from L1 to sacrum. Of these 113 patients, patients who underwent surgery for compression fracture or rupture of the L5 or S1 vertebra, infectious spondylitis, spondylolisthesis of the L5 spine, or ankylosing spondylitis were excluded. Thus, 81 patients with disc herniation or spinal stenosis, compression fracture or rupture of verterbrae other than L5 and S1, lumbar sprain or contusion were enrolled. These included 33 men and 48 women with mean age of 56.5 years (range 17–84).
The patients were diagnosed with foraminal stenosis by 2 musculoskeletal radiologists based on imaging findings and an orthopedic surgeon based on clinical symptoms. Four main groups were established for comparison: those diagnosed and not diagnosed with foraminal stenosis by 2 musculoskeletal radiologists, and those diagnosed and not diagnosed with foraminal stenosis by an orthopedic surgeon. These groups were further divided into subcategories depending on whether the area was operated on for foraminal stenosis. Patients who underwent surgery were those who had no improvement of symptoms after 3 months of conservative treatment such as medication and injections. To assess the symptoms, the patients were asked to manually draw their symptoms on images by themselves for survey (Fig. 1). We compared the values between patients who underwent surgery despite conservative treatment due to persistent pain and those who did not.
Figure 1.
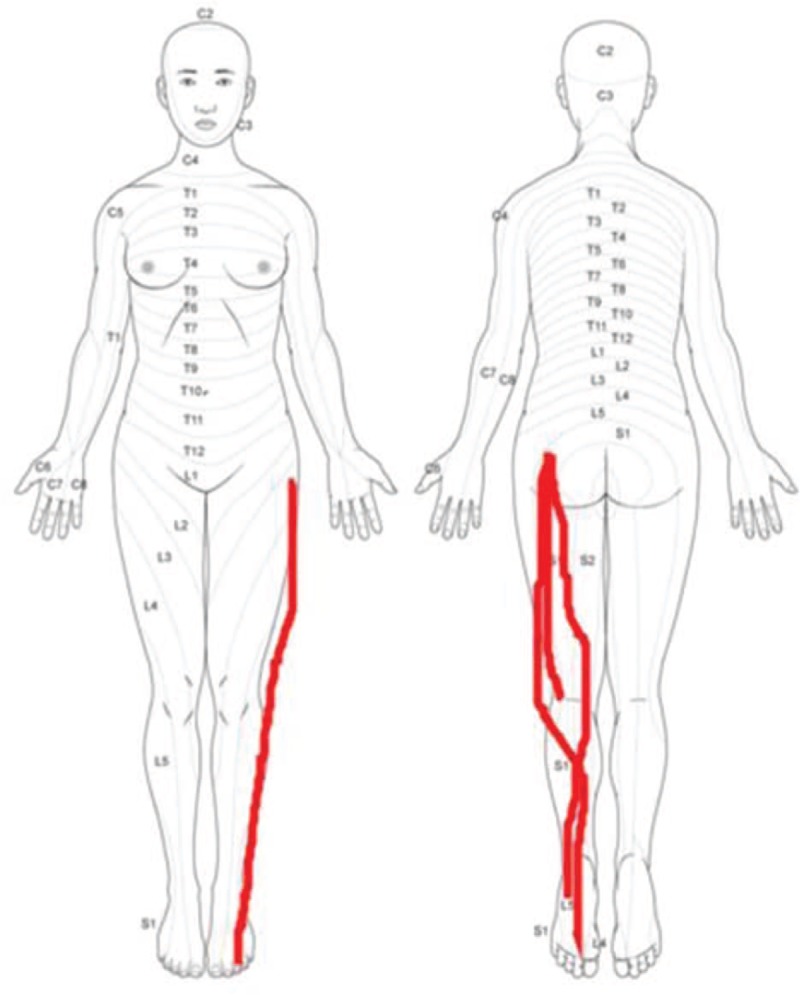
Manually drawn regions of pain on image by patient him- or herself.
Two orthopedic surgeons, who were blinded to clinical and operation history, independently measured the area of both right and left L5/S1 foramen by manually drawing the ROI on coronal, sagittal, and axial CT images with a medical imaging program known as Inifinite (Inifinite Healthcare, Seoul, Korea) (Figs. 2–4). These 2 orthopedic surgeons are different surgeons from the orthopedic surgeon who enrolled the patients in the study.
Figure 2.
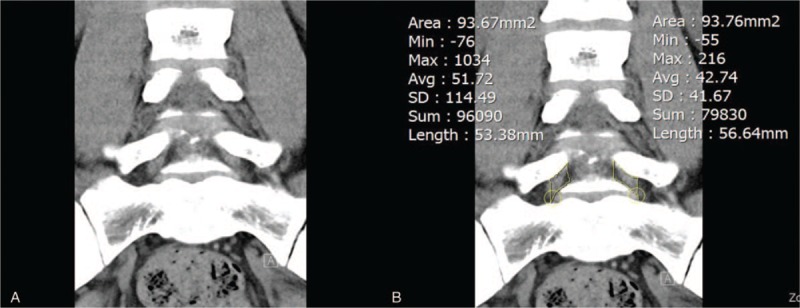
Coronal computed tomography image of (A) the narrowest foraminal area and (B) its area measurement using region of interest.
Figure 4.

Axial computed tomography image of the (A) narrowest foraminal area and (B) its area measurement using region of interest.
Figure 3.
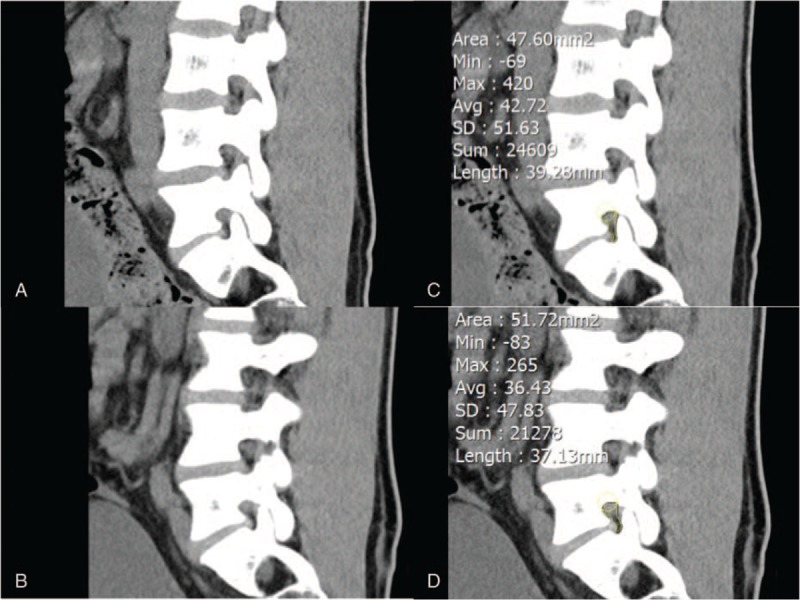
Sagittal computed tomography image of the (A) right and (B) left narrowest foraminal area and area measurement of the (C) right and (D) left narrowest foraminal area using region of interest.
The areas were automatically measured and calculated based on manually drawn ROI on the smallest foramen of each plane. On coronal images, the drawn ROI corresponded to the area between superior and inferior pedicles. On sagittal images, the drawn ROI corresponded to the area between intervertebral disc as anterior border and facet joints as posterior border. On axial images, the drawn ROI corresponded to the area of the diamond-shaped region bordered by posterior margin of superior vertebra and anterior margin of facet joints. The measurement of area was performed in the same manner as previously reported protocol.[12]
To assess the interobserver reliability of area measurements, the 2 orthopedic surgeons independently measured each foraminal area on each plane. A 1-week washout period was placed before the surgeons measured each area once more to assess the intraobserver reliability.
Statistical analysis was performed using commercial software known as SPSS (version 21.0; IBM Corp, Armonk, NY). A value of P < .05 was considered statistically significant. Mann–Whitney test was used for statistical analysis to compare the 2 groups, and Pearson correlation analysis was used to compare the measurements. A stepwise multiple regression analysis and logistic regression analysis were performed to assess the values related to operability. The intraclass correlation coefficient (ICC) was used to determine the intraobserver agreement and interobserver agreement. All ICC were interpreted as poor (<0.4), fair to good (0.4–0.75), and as excellent (>0.75).[13]
3. Results
The average height of 33 men was 171.5 cm and the average height of 48 women was 154.8 cm. These results were not significantly different from those measured by National Health Insurance Corporation subscriber statistics in 2015: the average height of Korean men was 170.5 cm and the average height of women was 156.9 cm.
Fifty-one patients were diagnosed with foraminal stenosis by 2 musculoskeletal radiologists and 30 were not diagnosed with foraminal stenosis. There were no significant radiologic differences between the 2 groups. However, spondylolysis was significantly more frequent in the foraminal stenosis group (Table 1).
Table 1.
Comparison between patients diagnosed with foraminal stenosis and without foraminal stenosis by 2 musculoskeletal radiologists.
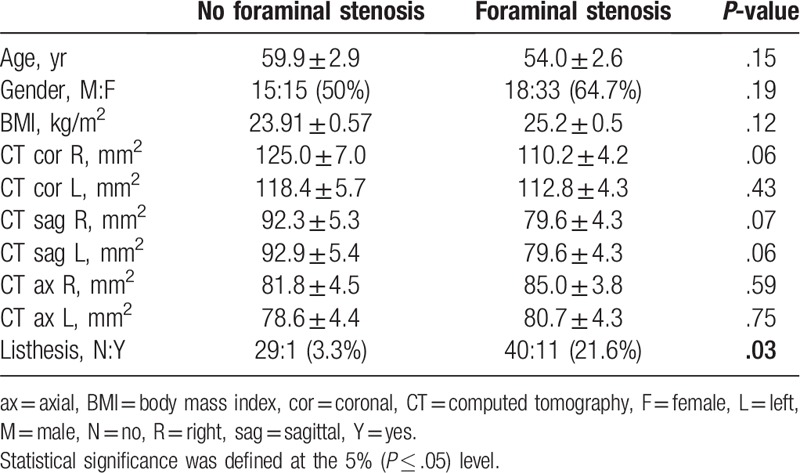
Thirty-three patients were diagnosed with foraminal stenosis based on patient symptoms by an orthopedic surgeon and 48 were not diagnosed with foraminal stenosis. The sagittal measurements on CT were significantly narrower in the foraminal stenosis group, and spondylolysis was also significantly more frequent in the foraminal stenosis group (Table 2). Of these 33 patients, 23 patients underwent surgery for L5/S1 foraminal stenosis, and their measurements were significantly narrower than the nonsurgical group except for the right coronal plane. However, there was no significant difference between the 2 groups in spondylolysis (Table 3).
Table 2.
Comparison between patients diagnosed with foraminal stenosis and without foraminal stenosis by an orthopedic surgeon.
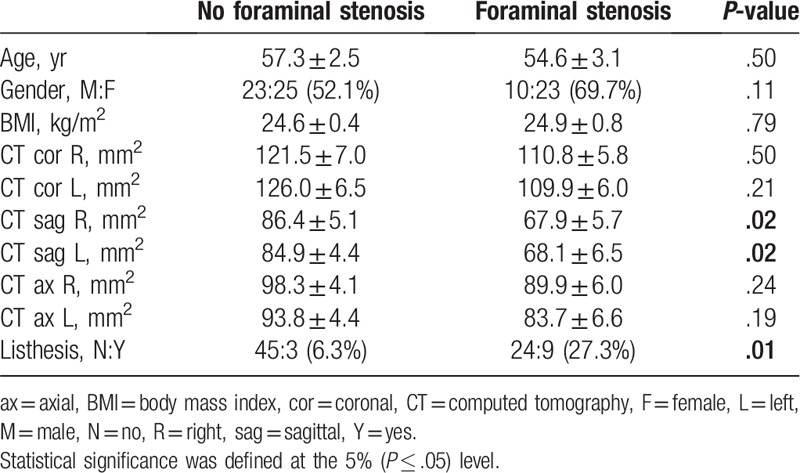
Table 3.
Comparison between patients who underwent surgery and those who had conservative treatment alone.
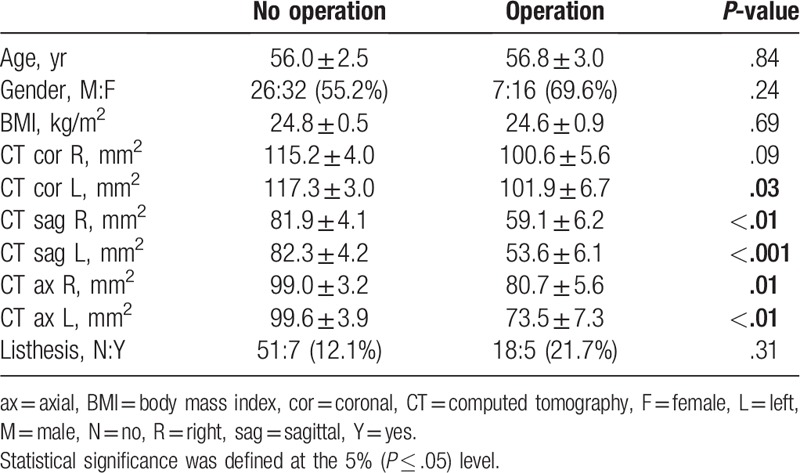
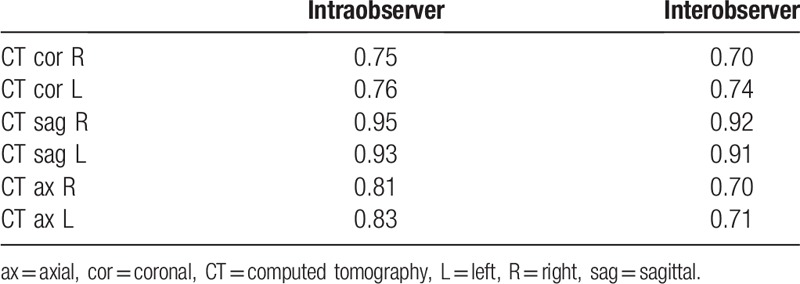
All measurements except for the right axial plane (P = .209) showed significant decrease with respect to age (P ≤ .03), whereas the body mass index (BMI) showed no statistically significant change (P > .31). The stepwise multiple regression analysis showed that the most related value to operability in the surgical group was the foraminal area on sagittal CT images (P = .001) (Table 4). Logistic regression analysis showed that the foraminal area <80 mm2 on sagittal images with odds ratio of 4.839 (P = .028) was a statistically significant risk factor for clinical symptom and that <65 mm2 on sagittal images with odds ratio of 7.223 (P = .01) was a statistically significant risk factor in predicting operability. Other values such as age, sex, BMI, and presence of spondylolysis were not statistically significant. All intraobserver and interobserver agreements on foraminal area measurements using ICC values were fair to good (ICC > 0.70), except on sagittal plane where they were excellent (ICC > 0.90) (Table 5).
Table 4.
Stepwise multiple regression analysis for prediction of operability.
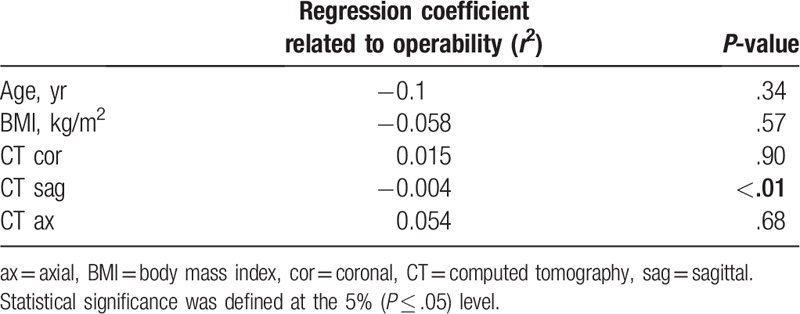
Table 5.
Intraclass and interclass correlation coefficients of the measurements.
4. Discussion
In this study, we measured the area of the intervertebral foramen using the ROI in CT with a medical imaging program, which can be achieved easily. Moreover, we were able to prove that this method is useful in diagnosing L5 foraminal stenosis. Furthermore, the foraminal area on sagittal plane showed excellent interobserver agreement and provided aid to predict and assess operability.
Most studies to date have used cadavers to measure the intervertebral foramen. Hasegawa et al used 18 cadavers to report that significant neuromuscular pressure occurs when the foraminal height is 15 mm or less, or the posterior disc height is 4 mm or less.[14] Stephens et al used 20 cadavers to compare the shape and area of intervertebral foramen at each lumbar spine level.[15] Recently, studies have been published to measure area of intervertebral foramen using CT or MRI in relation to the change of posture, insertion of the instrument, or presence of spondylolysis with the development of imaging techniques, instruments, and software.[16–19]
The method of manually drawn area on image data has often been used in in vivo studies, like in our study. Takasaki et al compared the areas of cervical intervertebral foramen using MRI in relation to application of cervical traction, compression, and Spurling test on 23 patients. The narrowest cross-sectional areas were obtained on MRI sagittal plane and the foramen cross-sectional areas were further narrowed when cervical compression and Spurling test was applied.[20] Sari et al used axial CT images to evaluate the changes of the foraminal area, spinal canal space, and thickness of the psoas muscle in 32 patients with intervertebral disc herniation during lumbar traction.[21] Khiami et al used software known as VitreaCore to reconstruct the volume of the lumbar spine from L3 to S1 on lumbar CT taken from 10 healthy adults.[10] The narrowest intervertebral foramen area on the sagittal, coronal, and axial sides of the CT was measured and the volume of each intervertebral foramen area was calculated using the software. On sagittal plane, the area was measured excluding the intervertebral disc and facet joints. However on coronal and axial planes, there may have been measurement errors because the areas on coronal and axial planes were obtained based on bone structure rather than the soft-tissue boundary. Ko et al looked into 438 cervical spine CT images to investigate the prevalence of most affected foraminal stenosis and concluded C 5/6 was the highest (19.06%).[22] Nakao et al studied 75 patients who underwent surgery for lumbar radiculopathy using 3D CT to diagnose extraforaminal stenosis.[11] They hypothesized that the shape of lumbosacral junction may cause the L5 radiculopathy. They reconstructed and measured the area of extraforaminal parasagittal plane. As a result, the measured area was significantly narrower in patients diagnosed with lumbosacral extraforaminal stenosis, and the cutoff value was 0.8 cm2. However, there were limitations such as the need for parasagittal image reconstruction or that the area may vary depending on how the parasagittal plane is reconstructed. In contrast, our study is meaningful in that the diagnosis of foraminal stenosis and prediction of operability is possible on conventional CT images without any manipulation.
The presence of anterior spondylolisthesis had no significance on the surgical outcome, which is consistent with prior findings. Farfan and Kirkaldy-Willis,[23] Haraldsson and Willner,[24] and Szypryt et al[25] reported that anterior spondylolisthesis is associated with disc degeneration despite that spondylolisthesis itself is not an indication for surgery. Wong and Transfeldt proposed to perform discography prior to surgical fusion because degeneration of disc superior to the dislocated disc can be the cause of pain.[26] In other words, successful treatment of the disease that may be accompanied by spondylolisthesis is important in deciding whether to perform surgery.
According to Yan et al, intervertebral foraminal height on the sagittal plane decreased with age.[27] They enrolled 25 asymptomatic volunteers who underwent lumbar CT, and reported that the width of the intervertebral foramen was irrelevant to age, whereas its height decreased with age. Hawasli et al reported that the interpedicular distance in 200 patients with degenerative scoliosis was significant for causing radiating pains. The results showed that the interpedicular distance (i.e., intervertebral foraminal height) decreased with age and was related to radiating pain.[28] In accordance with prior studies, our study also shows that the intervertebral foraminal height decreased with age. Also, there was no significant correlation between BMI and foraminal height.
There are some limitations to this study. First, although the measurement of intervertebral foramen area on CT is helpful in diagnosing foraminal stenosis and predicting operability, the patients were not randomly selected. This may result in possible selection bias. Furthermore, due to characteristics of lumbar stenosis, it is ambiguous whether the patient underwent surgery due to spinal stenosis or foraminal stenosis or both. However, all enrolled patients underwent lumbar CT from 2014 to 2017 to reduce selection bias. Second, the statistical power may be weak due to relatively small number of patients enrolled. Finally, since the postures of all patients are inconsistent, the sagittal, coronal, and axial areas may be distorted resulting in erroneous narrowest area measurement. In some cases, it was difficult to distinguish the priorly established anatomical boundaries due to change of the relationship between CT cross section and surrounding structures. However, 2 orthopedic surgeons independently measured the area and the area measurement in the sagittal plane showed the highest interobserver agreement. Area measurements from axial and coronal planes were considered not significant as diagnostic measures despite their statistical significance.
5. Conclusion
In conclusion, the area measurement using the ROI in CT of the lumbar spine is useful for diagnosing foraminal stenosis between L5-S1 vertebrae, especially on sagittal plane. Furthermore, not only does it provide aid in diagnosis, but it also helps predict and assess the operability of foraminal stenosis. This study is the 1st in literature to diagnose foraminal stenosis with conventional lumbar CT. Furthermore, it suggests that CT may be an alternative diagnostic tool for foraminal stenosis in patients with contraindications to MRI or in patients with issue of cost for MRI.
Author contributions
Conceptualization: Hak Sun Kim.
Data curation: Byung Ho Lee.
Formal analysis: Jiwoon Seo, Hyunjoo Hong.
Investigation: Byung Ho Lee, Sung Chul Shin.
Supervision: Byung Ho Lee, Hak Sun Kim.
Writing – original draft: Dong Woo Shim.
Writing – review & editing: Hak Sun Kim.
Dong Woo Shim orcid: 0000-0001-5763-7860.
Footnotes
Abbreviations: ax = axial, BMI = body mass index, cor = coronal, CT = computed tomography, 3D = 3-dimensional, F = female, ICC = intraclass correlation coefficient, L = left, M = male, MRI = magnetic resonance imaging, N = no, R = right, ROI = region of interest, sag = sagittal, Y = yes.
How to cite this article: Shim DW, Lee BH, Seo J, Hong H, Shin SC, Kim HS. Efficacy of computed tomography in prediction of operability of L5/S1 foraminal stenosis using region of interest. Medicine. 2019;98:42(e17422).
The authors have no funding and conflicts of interest to disclose.
References
- [1].Kunogi J, Hasue M. Diagnosis and operative treatment of intraforaminal and extraforaminal nerve root compression. Spine (Phila Pa 1976) 1991;16:1312–20.. [DOI] [PubMed] [Google Scholar]
- [2].Porter RW, Hibbert C, Evans C. The natural history of root entrapment syndrome. Spine (Phila Pa 1976) 1984;9:418–21.. [DOI] [PubMed] [Google Scholar]
- [3].Vanderlinden RG. Subarticular entrapment of the dorsal root ganglion as a cause of sciatic pain. Spine (Phila Pa 1976) 1984;9:19–22.. [DOI] [PubMed] [Google Scholar]
- [4].Burton CV, Kirkaldy-Willis WH, Yong-Hing K, et al. Causes of failure of surgery on the lumbar spine. Clin Orthop Relat Res 1981. 191–9.. [PubMed] [Google Scholar]
- [5].Jenis LG, An HS. Spine update. Lumbar foraminal stenosis. Spine (Phila Pa 1976) 2000;25:389–94.. [DOI] [PubMed] [Google Scholar]
- [6].Jenis LG, An HS, Gordin R. Foraminal stenosis of the lumbar spine: a review of 65 surgical cases. Am J Orthop (Belle Mead NJ) 2001;30:205–11.. [PubMed] [Google Scholar]
- [7].Aota Y, Niwa T, Yoshikawa K, et al. Magnetic resonance imaging and magnetic resonance myelography in the presurgical diagnosis of lumbar foraminal stenosis. Spine (Phila Pa 1976) 2007;32:896–903.. [DOI] [PubMed] [Google Scholar]
- [8].Lee S, Lee JW, Yeom JS, et al. A practical MRI grading system for lumbar foraminal stenosis. AJR Am J Roentgenol 2010;194:1095–8.. [DOI] [PubMed] [Google Scholar]
- [9].Lurie JD, Tosteson AN, Tosteson TD, et al. Reliability of readings of magnetic resonance imaging features of lumbar spinal stenosis. Spine (Phila Pa 1976) 2008;33:1605–10.. [DOI] [PMC free article] [PubMed] [Google Scholar]
- [10].Khiami F, Aziria SA, Ragot S, et al. Reliability and validity of a new measurement of lumbar foraminal volume using a computed tomography. Surg Radiol Anat 2015;37:93–9.. [DOI] [PubMed] [Google Scholar]
- [11].Nakao S, Yoshida M, Yamada H, et al. A new 3-dimensional computed tomography imaging method to diagnose extraforaminal stenosis at the lumbosacral junction. J Spinal Disord Tech 2010;23:e47–52.. [DOI] [PubMed] [Google Scholar]
- [12].Muhle C, Resnick D, Ahn JM, et al. In vivo changes in the neuroforaminal size at flexion-extension and axial rotation of the cervical spine in healthy persons examined using kinematic magnetic resonance imaging. Spine (Phila Pa 1976) 2001;26:E287–93.. [DOI] [PubMed] [Google Scholar]
- [13].Rosner B. Fundamentals of biostatistics: Nelson Education; 2015. [Google Scholar]
- [14].Hasegawa T, An HS, Haughton VM, et al. Lumbar foraminal stenosis: critical heights of the intervertebral discs and foramina. A cryomicrotome study in cadavera. J Bone Joint Surg Am 1995;77:32–8.. [PubMed] [Google Scholar]
- [15].Stephens MM, Evans JH, O’Brien JP. Lumbar intervertebral foramens. An in vitro study of their shape in relation to intervertebral disc pathology. Spine (Phila Pa 1976) 1991;16:525–9.. [PubMed] [Google Scholar]
- [16].Ebraheim NA, Liu J, Ramineni SK, et al. Morphological changes in the cervical intervertebral foramen dimensions with unilateral facet joint dislocation. Injury 2009;40:1157–60.. [DOI] [PubMed] [Google Scholar]
- [17].Khiami F, Breque C, Pascal-Mousselard H, et al. Intervertebral foramen variation following dynamic L4-L5 interspinal device implantation: foramen size after interspinal device implantation. J Spinal Disord Tech 2013;26:E215–20.. [DOI] [PubMed] [Google Scholar]
- [18].Spivak JM, Kummer FJ, Chen D, et al. Intervertebral foramen size and volume changes in low grade, low dysplasia isthmic spondylolisthesis. Spine (Phila Pa 1976) 2010;35:1829–35.. [DOI] [PubMed] [Google Scholar]
- [19].Ebraheim NA, Liu J, Shafiq Q, et al. Quantitative analysis of changes in cervical intervertebral foramen size with vertebral translation. Spine (Phila Pa 1976) 2006;31:E62–5.. [DOI] [PubMed] [Google Scholar]
- [20].Takasaki H, Hall T, Jull G, et al. The influence of cervical traction, compression, and spurling test on cervical intervertebral foramen size. Spine (Phila Pa 1976) 2009;34:1658–62.. [DOI] [PubMed] [Google Scholar]
- [21].Sari H, Akarirmak U, Karacan I, et al. Computed tomographic evaluation of lumbar spinal structures during traction. Physiother Theory Pract 2005;21:3–11.. [PubMed] [Google Scholar]
- [22].Ko S, Choi W, Lee J. The prevalence of cervical foraminal stenosis on computed tomography of a selected community-based Korean population. Clin Orthop Surg 2018;10:433–8.. [DOI] [PMC free article] [PubMed] [Google Scholar]
- [23].Farfan HF, Kirkaldy-Willis WH. The present status of spinal fusion in the treatment of lumbar intervertebral joint disorders. Clin Orthop Relat Res 1981. 198–214.. [PubMed] [Google Scholar]
- [24].Haraldsson S, Willner S. A comparative study of spondylolisthesis in operations on adolescents and adults. Arch Orthop Trauma Surg 1983;101:101–5.. [DOI] [PubMed] [Google Scholar]
- [25].Szypryt EP, Twining P, Mulholland RC, et al. The prevalence of disc degeneration associated with neural arch defects of the lumbar spine assessed by magnetic resonance imaging. Spine (Phila Pa 1976) 1989;14:977–81.. [DOI] [PubMed] [Google Scholar]
- [26].Wong DA, Transfeldt E. Macnab's Backache. Philadelphia, PA: Lippincott Williams & Wilkins; 2007. [Google Scholar]
- [27].Yan S, Wang K, Zhang Y, et al. Changes in L4/5 intervertebral foramen bony morphology with age. Sci Rep 2018;8:7722. [DOI] [PMC free article] [PubMed] [Google Scholar]
- [28].Hawasli AH, Chang J, Yarbrough CK, et al. Interpedicular height as a predictor of radicular pain in adult degenerative scoliosis. Spine J 2016;16:1070–8.. [DOI] [PMC free article] [PubMed] [Google Scholar]


