


Supplemental Digital Content is available in the text
Keywords: article type, authorship-weighted scheme, Google Maps, medical subject headings, PubMed central, social network analysis
Abstract
Background:
Many authors are concerned which types of peer-review articles can be cited most in academics and who were the highest-cited authors in a scientific discipline. The prerequisites are determined by: (1) classifying article types; and (2) quantifying co-author contributions. We aimed to apply Medical Subject Headings (MeSH) with social network analysis (SNA) and an authorship-weighted scheme (AWS) to meet the prerequisites above and then demonstrate the applications for scholars.
Methods:
By searching the PubMed database (pubmed.com), we used the keyword “Medicine” [journal] and downloaded 5,636 articles published from 2012 to 2016. A total number of 9,758 were cited in Pubmed Central (PMC). Ten MeSH terms were separated to represent the journal types of clusters using SNA to compare the difference in bibliometric indices, that is, h, g, and x as well as author impact factor(AIF). The methods of Kendall coefficient of concordance (W) and one-way ANOVA were performed to verify the internal consistency of indices and the difference across MeSH clusters. Visual representations with dashboards were shown on Google Maps.
Results:
We found that Kendall W is 0.97 (χ = 26.22, df = 9, P < .001) congruent with internal consistency on metrics across MeSH clusters. Both article types of methods and therapeutic use show higher frequencies than other 8 counterparts. The author Klaus Lechner (Austria) earns the highest research achievement(the mean of core articles on g = Ag = 15.35, AIF = 21, x = 3.92, h = 1) with one paper (PMID: 22732949, 2012), which was cited 23 times in 2017 and the preceding 5 years.
Conclusion:
Publishing article type with study methodology and design might lead to a higher IF. Both classifying article types and quantifying co-author contributions can be accommodated to other scientific disciplines. As such, which type of articles and who contributes most to a specific journal can be evaluated in the future.
Highlights
Google Maps is particularly used to show geographical presentations. This approach is rarely seen in previous papers.
The individual academic achievements can be measured by the authorship-weighted scheme which is a novel approach used for quantifying coauthor contributions in an article byline.
The way to classify the type of articles is similar to the latent class used in education and psychometric fields. The objective assessment of comparing the citation metrics among types of articles has been demonstrated in this study.
1. Introduction
Every June, millions of academic scholars pay close attention to the Journal Citation Reports, which release journal impact factors for journals indexed in social science citation. The statistical methods used for assessing (1) the academic quality of journals or authors and citation rates[1] and the knowledge structure and development of research fields based on analysis of related publications[2] are defined as bibliometric analyses. As of April 4, 2019, 26 articles regarding bibliometrics were published in Medicine (Baltimore), and 17 papers entitled with bibliometric analysis since 2015.[3–7]
In the literature, some authors[8] described the influence of article type on the impact factor(IF) for journals and found that a higher IF was associated with the publication of reviews and original articles instead of case reports. Some[9] reported that rigorous systematic reviews received more than twice the mean number of citations compared to other systematic or narrative reviews. The value of case reports about the IF is low, since they are rarely cited by articles.[10]
Another approach to classify article types was proposed to apply the analyses of Medical Subject Headings (MeSH) as a proxy of journals’ scopes.[11] This is due to the fact that heterogeneous research types have different feature patterns within a journal based on a variety of basic and clinical scopes. The connections among these MeSH terms can be investigated by applying social network analysis (SNA)[12–15] to co-occurrence features. However, to date, no matching scheme has been proposed in the literature to help citation analyses assign articles into an appropriate article type. As such, the prediction of article types (or topics classified by MeSH terms) related to the number of citation in a journal requires further study.
Another essential topic in bibliometrics is to select the most cited authors who contributed to a specific journal or discipline. Publications are a major criterion for assessing scientists for promotion, tenure or funding.[16,17] However, not all authors are necessarily viewed as equal contributors to an article. The trend toward more authors per published paper is also required to ensure those listed first (primary author) or last (responding author) that should be generally apportioned more credit for the work than middle authors,[18] As such, many counting schemes have been proposed to quantifying co-author contributions,[19] such as fractional counting[20–24] and authorship-weighted counting[22–24] besides the traditional full counting (i.e., all authors contribute equally to an article). We have not seen any of these applied to scientific disciplines so far.
In this study, we attempt to
-
1.
classify the type of articles using MeSH terms,
-
2.
quantify co-author contributions with an authorship-weighted scheme (AWS), and then
-
3.
demonstrate how to visually select the most-cited authors for a target journal.
2. Methods
2.1. Data source
By searching the PubMed database (pubmed.org), we used the keywords of “Medicine” [Journal] on October 7, 2018, and downloaded 5636 articles published from 2012 to 2016. An author-made Microsoft Excel Visual Basic for Application module was used to analyze and present the contents and research results. All downloaded abstracts are based on the type of journal article. All data used in this study were downloaded from PubMed Central (PMC), which means ethical approval is not necessary for the study, according to the regulation promulgated by the Taiwan Ministry of Health and Welfare.
2.2. Frequency distribution of the number of authors per paper for Medicine
The graph was generated using articles of Medicine (Baltimore) downloaded for MEDLINE bibliographic data
-
(1)
to display the frequency distribution of the number of authors per article for Medicine, and
-
(2)
to ensure the trend toward more authors per published paper in the past.
2.3. Two approaches for displaying research results
2.3.1. The paper-based perspective
Social network analysis (SNA) was applied to classify MeSH terms of articles in Medicine (Baltimore). In keeping with the Pajek guidelines[25] using SNA, we defined a MeSH term [i.e., a major topic with an asterisk (∗) in downloaded MeSH labels] as a node (or an actor) that is connected to another counterpart node through the edge of a line. Usually, another weight is defined by the number of connections between two nodes. The algorithm of community partition was performed to identify and separate clusters.
Each article was in turn identified to a specific MeSH cluster through the maximum likelihood estimation(MLE) [i.e., selecting the highest weighted summation score from all possible clusters (k), whereas the weighted summation score for MeSH (i) in a given cluster  , Wi is the degree centrality of MeSH (i) in the journal network]. As a result, the unique MeSH cluster for an article is determined by selecting the maximum summation score across all possible clusters through article MeSH terms and the degree centralities, see Supplemental Digital Content 1. That is the type of each article can be determined by the specific cluster representative of the specific MeSH term.
The bibliometric indices (i.e., h, g, x,[26–28] and AIF[29,30]) for each MeSH cluster can be obtained by calculating the number of citable and cited papers over the 5 years from 2012 to 2016. The Kendall coefficient of concordance (W)[31] was computed to examine the internal consistency(IC) of the data (i.e., 4 indices) related to MeSH clusters. If the agreement is accepted by the statistical alpha level (<0.05),[32] the following analysis of one-way ANOVA for inspecting the difference in mean of indices is meaningful.
The highly associated citing journals with Medicine (Baltimore) were also presented using SNA on Google Maps, see Figure 1.
Figure 1.
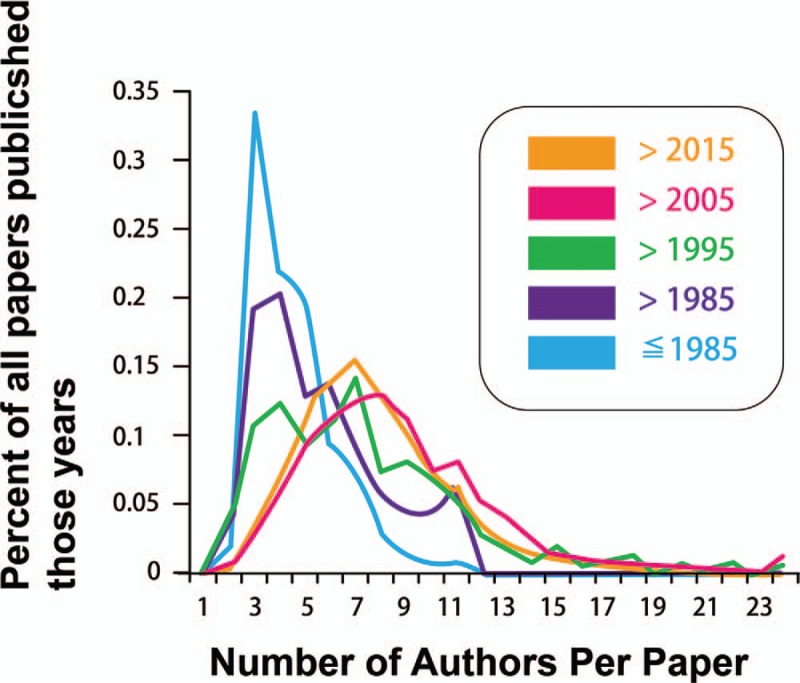
Frequency distribution of the number of authors per paper by decade for Medicine.
2.3.2. The author-based perspective
An AWS was developed according to the Rasch rating scale model[33] for quantifying author contributions as the Equation (1):
 |
Considering a paper of m−1 authors with the last being the corresponding author, Wj in Eq. (1) denotes the weight for an author on the order j (=m−2) in the article byline. The power  is an integer number from m−1 to 0 in descending order. The
  for the first author is thus assigned by m−1.
 |
The sum of authorships equals 1 for each paper referred to Eq. (2). This is a basic concept that ensures that all papers have an equal weight irrespective of the number of coauthors.[34] Accordingly, more importance is given to the first (=exp(m−1), primary) and the last (=exp(m−2), corresponding or supervisory) authors, while it is assumed that the others (the middle authors) have made smaller contributions.[22,35] In Eq. (2), the smallest portion (=exp(0)=1) is assigned to the last second author with the odds = 1 as the basic reference.
The AIF of an author A for a given the year (e.g., 2017) can be defined in Eq. (3):
 |
All authors’ citation numbers for each article were in descending order along with the ascending sequential integral number (i) from 1 to n. The three indices were computed as follows: h(≥ci), g(≤  ) and x-indexes
  , where all the number of cited papers (denoted by ci)] based on cited publications in 2017 and the preceding 5 years. The mean of core articles on g denoted by Ag is defined as
  ) to improve the discrimination of individual research achievements.[36]
Due to the real numbers of weighted contributions proportioned to coauthors, the rule for applying author weights to calculate h-index is defined as follows: (1)h = cm + (k-1)/10 for h-cores if max(ci)<1, where k = the point at citations≥ h-cores/10 if max(ci)<1, see Supplemental Digital Content 2), and (2) h = h + the decimal if max(ci)> = 1, where cm = the maximal proportional citation weights across all ci for an individual authors. As such, both h and g indices are mute to differentiate the achievements using integral numbers can be improved (i.e., with decimal digits).[36] The most highly-cited authors can also be plotted with a dashboard on Google Maps. Authors’ x-indexes are located on axis X, Ag on axis Y, bubbles sized by AIF, and colored by h-index, see Figure 1.
2.4. Video abstract for organizing data
We provide readers the opportunity to outline the key findings of this study in a dynamic video (Supplemental Digital Content 3) with a dataset (Supplemental Digital Content 4). Through this multimedia content, anyone interested in our work can experience the research anytime, anywhere. (Fig. 2)
Figure 2.
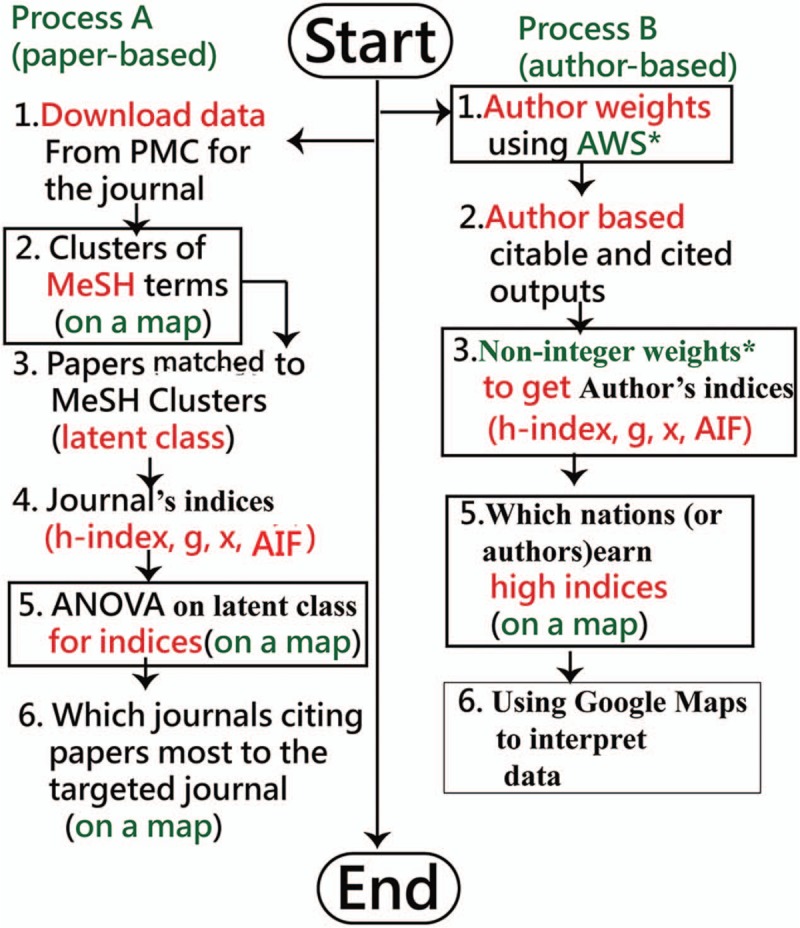
Study flowchart.
3. Results
3.1. Frequency distribution of the number of authors per paper for Medicine
The graph (Fig. 1) provides us with a better understanding of these perceptions and necessities in quantifying co-author contributions. Qualitatively speaking, those listed first (primary author) or last (responding author) in the byline are generally apportioned more credit for the work than middle authors,[18] even if the exact portions of each authors’ contribution are not determined from their byline position.
3.2. Clusters of MeSH terms
The top 10 MeSH clusters were separated on Figure 3. The representative terms with the most influential degree centrality are shown for each cluster. We recommend that interested readers scan the QR-coed on Figure 3 to see the details of information in PMC by clicking the word of publication when the specific MeSH bubble is selected.
Figure 3.
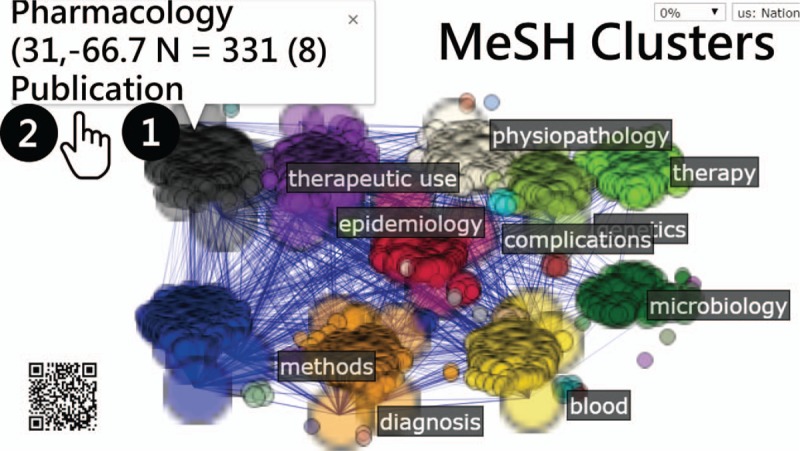
Clusters of MeSH terms related to the journal of Medicine.
3.3. Analysis of Kendall coefficient of concordance (W)
The counts of citable and cited articles across MeSH clusters and over the years from 2012 to 2016 are shown in Table 1. Four bibliometric indices are shown in Tables 2 and 3. We found that Kendall W is 0.39 (χ=14.20, df = 9, P = 12) without IC for the four indices (at the bottom in Table 4). If we remove the AIF with a lower correlation from indices, the IC can be improved and accepted (W = 0.97, χ = 26.22, df = 9, P < .001).
Table 1.
Citable and cited papers across MeSH clusters and over the years.

Table 2.
AIF and h-index for MeSH clusters over the years.

Table 3.
g-index and h-index for MeSH clusters over the years.

Table 4.
Analysis of Kendall coefficient of concordance (W).

One-way ANOVA shows that the means of MeSH clusters are statistically distinct (F (20,9) = 12.86, P < .001) in Figure 4. It can be seen that MeSH clusters represented by both methods and therapeutic use display higher metrics than others.
Figure 4.
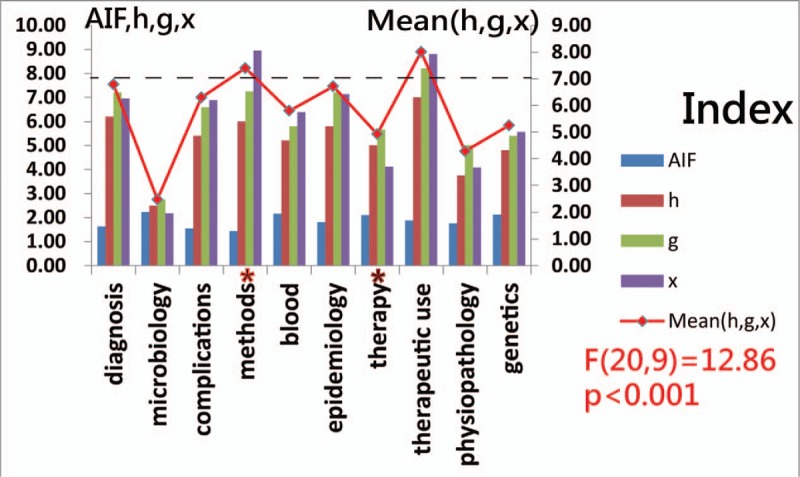
Comparison of bibliometric indices among clusters.
The top 10 clusters of citing journals to Medicine (Baltimore) are present in Figure 5. The representatives with the highest degree of centrality for each cluster are highlighted with journal names. The biggest bubble size is the journal of Medicine (Baltimore), Oncotarget and PloS One, in order.
Figure 5.
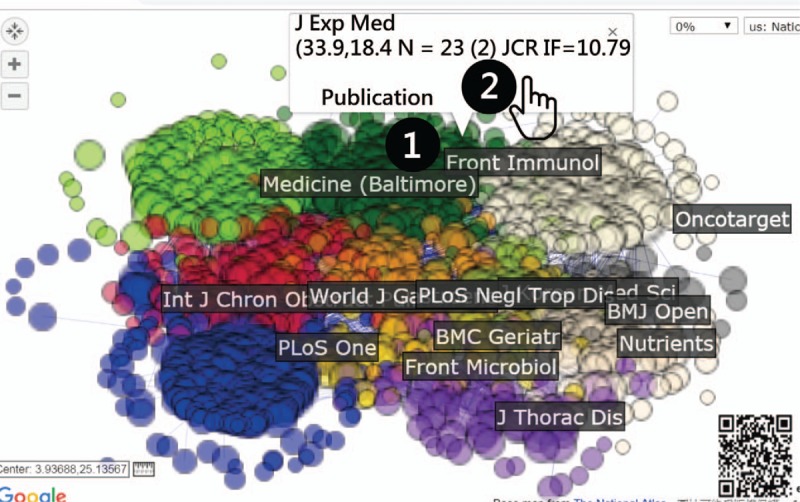
Clusters of citing journals to the journal of Medicine.
3.4. x-indexes for authors on Google Maps
The author Klaus Lechner from Austria earns the most highly-cited achievement (Ag = 15.35, AIF = 21, x = 3.92, h = 1.35) with 1 paper (PMID: 22732949, 2012) cited 23 times in 2017 over the past 5 years. We suggest interested authors scan the QRcode on Figure 6 to examine the author's publication outputs in PMC by clicking the specific author bobble.
Figure 6.
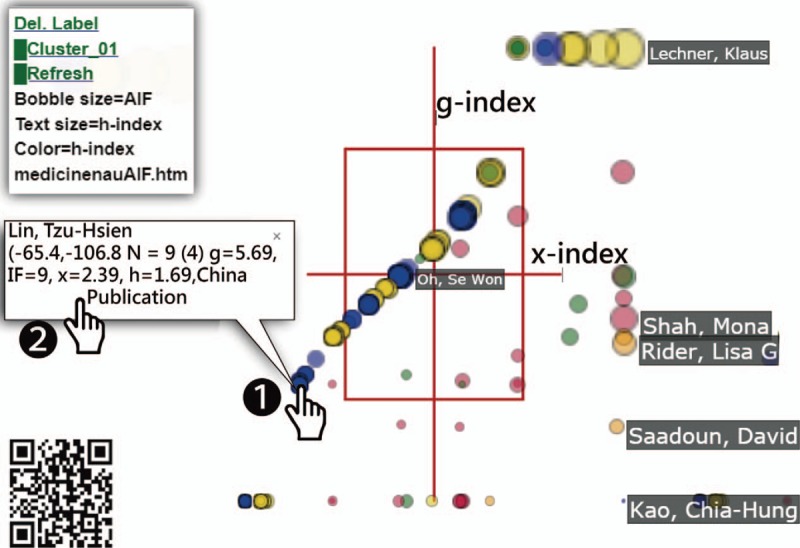
The most highly-cited authors for Medicine in 2007.
Another author, Se Won Oh from South Korea owns metrics (Ag = 7.6, AIF = 12, x = 2.76, h = 1.6) with one paper (PMID:26426658, 2015) cited 12 times in 2017 and the preceding 5 years. The comparison and calculation of these bibliometric indices will be further discussed in the next section.
4. Discussions
4.1. Principal findings
We found that both MeSH clusters (or concepts) of methods and therapeutic use show significantly higher metrics compared to other eight counterparts (F (20,9) = 12.86, P < .001). The results are similar to the study in 2002[30] addressing that for published papers in the field of emergency medicine, commonly used measures of study methodology and design can predict the frequency of citations.
As compared to the previous studies[8–10] addressing
-
(1)
a higher IF being associated with the publication of reviews and original articles instead of those case reports;
-
(2)
rigorous systematic reviews receiving more number of citations than other narrative reviews; and
-
(3)
case reports with low IFs due to rarely cited by articles, the MeSH clusters is a new approach to verify article types with a different number of cited papers in a journal or scientific discipline.
4.2. Study features
The first feature is to objectively identify the type of articles by way of applying SNA[11–15] to MeSH terms; in particular, by matching each article to the corresponding cluster (concept) and making the bibliometric indices linked to the clusters in comparison (Fig. 3). The latent clusters can be characterized by a pattern of conditional probabilities that indicate the chance that articles are classified to a specific concept or characteristic, like the latent class model (LCM)[37,38] in statistics, used for featuring the type of articles.[39]
The second feature is to develop the AWS for quantifying co-author contributions in computing bibliometric indices, particularly using the proportional decimal numbers of weighted author credits. As such, both integral h and g indices that are mute to rank the achievements can be improved by using the decimal digits.[36] Also, Vavryčuk combined weighted scheme[34] (or the harmonic credits)[42] is a special case of the AWS we developed in Eq. (1).
In comparison to the 2 prominent authors mentioned in Results, both have only one paper cited 23 and 12 times with total weighted citations of 15.35 and 7.60, respectively. The calculations can be yielded by (1)  ,[20] where g = 1 for Ag (= 15.35 and 7.60); (2) the weighted citation credits ÷ the citable = AIF[29,30] = 15.35/0.73 = 21 and 7.60/0.63 = 12 (based on Eq. (1), articles in PMC with ID = 22732949 and 26426658 in byline); (3)
  [21] = 3.92 = sqrt (1∗15.35) and 2.64 = sqrt(1∗7.60); (4) h = 1+0.35 and 1+0.6 when h = h + the decimal if max(ci)> = 1. All authors shown in Figure 5 are subject to the criterion of x-index ≥ 2 in this study.
The reasons for using Ag and x-index on two axes in Figure 5 are both indices are
-
(1)
close correlated to each other than other 2(i.e., h and AIF);
-
(2)
newly modified and developed later than h-index. Furthermore, AIF is sensitive to the number of citable papers [e.g., AIF for microbiology = 2.23 higher than others in Table 2 due to a smaller citable sample size = 30 and AIF = 2.03 for author Chia-Hung Kao with the smallest bubble at the right-bottom corner in Figure 5 due to a largest citable papers = 108].
The reason, without considering h-index as the main metric, is discussed in examples:[28] if 1 author has a single publication with 100 citations and another has ten publications each with 10 citations, then the h-index of the former is one while the h-index of the latter is 10. At the other extreme, an author with 100 publications, each with a single citation, has an h-index of 1. If x-index was applied, all those examples mentioned above would reach an identical value of 10 for measuring the individual research achievement. Alternatively, the g-indexes are similar to h-indexes at 1, 10, and 1. The Ag- indexes are located at 100, 10, and 1. Hence, x-index is used for discriminate individual research achievements in this study.
Let us look at the productive author Chia-Hung Kao[14] (Taiwan) who published 108 citable papers in Medicine (Baltimore), with 68 cited in citing journals. The bubble denoted by AIF (=2.03 = 48.34/23.79) in Figure 5 is very small, located in the bottom right corner. The top 3 cited weights are 2.94, 1.63, and 1.47, respectively, indicating Ag(2) = 2.28 = (2.93+1.63)/2, x(55) = 5.06 = sqrt(55∗0.47), and h(1) = 1+0.94 = 1.94.
There are many other bibliometric indices, such as R-index  [40] and Euclidean-index
  .[41] Each has its features and limitations. The third feature in this study is a demonstration of the combination of various indices on a dashboard using Google Maps to display, which is rarely seen in the literature.
The fourth feature is the PMC citations used in this study. Traditionally, over 100 papers were found with a search of “most-cited articles” [Title] in the PubMed library on October 10, 2018. Most of the applied academic databases, such as the Scientific Citation Index (SCI; Thomson Reuters, New York, NY), Scopus (Elsevier, Amsterdam, the Netherlands), and Google Scholar,[43,44] to investigate the most cited articles in a specific discipline. None were found using the PubMed library (i.e., a free search engine accessing primarily the MEDLINE database of references and abstracts on life sciences and biomedical topics) to retrieve the citing articles.
4.3. Limitations
Although findings are based on the above analysis, there are still several potential limitations that may encourage further research efforts. First, this study only focuses on one target journal and can be generalized to other fields or areas, particularly with different characteristics and science categories.
Second, there might be some biases in author identification because different authors with the same name or abbreviation but affiliated with different institutions exist.
Third, using MeSH terms to define the article type is arbitrary. The concept should be inducted from all or at least 2 or 3 main elements instead of the principal one. For example, methods are related to surgery and instrumentation; therapeutic use close to prevention & control and drug therapy; blood associated with metabolism mortality. Interested readers are invited to scan the QRcode on Figure 1 to examine more relevant MeSH in a cluster to define the true concept for the latent cluster.
Finally, although our cluster analysis and the AWS formula are useful approaches for verifying the association of MeSH terms and the number of weighted cited papers for individual authors, the results may be affected by the accuracy of MeSH terms and author real contributions instead of the last as the true corresponding author. We used a variety of methods of cleaning and identifying data in this research, but there still exist some typos and errors, which will affect the cluster results to some extent.
5. Conclusions
Through the above results and discussion, some valuable results for Medicine (Baltimore) were obtained, including article types of a scholarly journal associated with the number of the cited metrics. Results suggest that both methods of classifying article types and quantifying co-author contributions might be accommodated to other scientific disciplines. As such, which type of articles and who contributes most to a specific journal can be evaluated by scientists and scholars in the future.
Acknowledgments
We thank Enago (www.enago.tw) for the English language review of this manuscript. All authors declare no conflicts of interest.
Author contributions
Conceptualization: Tsair-Wei Chien.
Data curation: Tsair-Wei Chien.
Formal analysis: Hsien-Yi Wang, Wei-Chih Kan.
Methodology: Hsien-Yi Wang, Wei-Chih Kan.
Resources: Wei-Chih Kan.
Software: Tsair-Wei Chien.
Supervision: Shih-Bin Su.
Validation: Wei-Chih Kan, Shih-Bin Su.
Writing – original draft: Tsair-Wei Chien.
Writing – review & editing: Shih-Bin Su.
Tsair-Wei Chien orcid: 0000-0003-1329-0679.
Supplementary Material
Supplementary Material
Supplementary Material
Supplementary Material
Footnotes
Abbreviations: AIF = author impact factor, AWS = authorship-weighted scheme, IF = impact factor, JCR = journal citation report, JIF = journal impact factor, MeSH = medical subject headings, PMC = pubmed central, SNA = social network analysis, VBA = visual basic for application.
How to cite this article: Chien TW, Wang HY, Kan WC, Su SB. Whether article types of a scholarly journal are different in cited metrics using cluster analysis of MeSH terms to display. Medicine. 2019;98:43(e17631).
The authors have no funding and conflicts of interest to disclose.
All data were downloaded from MEDLINE database at pubmed.com.
Supplemental Digital Content is available for this article.
References
- [1].Wiki. Definition of Bibliometrics. 2019/4/4 available at https://en.wikipedia.org/wiki/Bibliometrics [Google Scholar]
- [2].IGI Global. What is bibliometric analysis. 2019/4/4 available at https://www.igi-global.com/dictionary/education-literature-development-responsibility/2406 [Google Scholar]
- [3].Yin X, Cheng F, Wang X, et al. Top 100 cited articles on rheumatoid arthritis: A bibliometric analysis. Medicine (Baltimore) 2019;98:e14523. [DOI] [PMC free article] [PubMed] [Google Scholar]
- [4].Xu D, Luo P, Li S, et al. Current Status of helicopter emergency medical services in China: a bibliometric analysis. Medicine (Baltimore) 2019;98:e14439. [DOI] [PMC free article] [PubMed] [Google Scholar]
- [5].Zou LX, Sun L. Global diabetic kidney disease research from 2000 to 2017: a bibliometric analysis. Medicine (Baltimore) 2019;98:e14394. [DOI] [PMC free article] [PubMed] [Google Scholar]
- [6].Zhao N, Tao K, Wang G, et al. Global obesity research trends during 1999 to 2017: a bibliometric analysis. Medicine (Baltimore) 2019;98:e14132. [DOI] [PMC free article] [PubMed] [Google Scholar]
- [7].Jiang Y, Hu R, Zhu G. Top 100 cited articles on infection in orthopaedics: a bibliometric analysis. Medicine (Baltimore) 2019;98:e14067. [DOI] [PMC free article] [PubMed] [Google Scholar]
- [8].Rodríguez-Lago L, Molina-Leyva A, Pereiro-Ferreirós M, et al. Influence of article type on the impact factor of dermatology journals. Actas Dermosifiliogr 2018;109:432–8.. [DOI] [PubMed] [Google Scholar]
- [9].Bhandari M, Montori VM, Devereaux PJ, et al. Hedges Team. Doubling the impact: publication of systematic review articles in orthopaedic journals. J Bone Joint Surg Am 2004;86-A:1012–6.. [PubMed] [Google Scholar]
- [10].Nielsen MB, Seitz K. Impact factors and prediction of popular topics in a journal. Ultraschall Med 2016;37:343–5.. [DOI] [PubMed] [Google Scholar]
- [11].Minguet F, Salgado TM, Santopadre C, et al. Redefining the pharmacology and pharmacy subject category in the journal citation reports using medical subject headings (MeSH). Int J Clin Pharm 2017;39:989–97.. [DOI] [PubMed] [Google Scholar]
- [12].Lu Y, Figler B, Huang H, et al. Characterization of the mechanism of drug-drug interactions from PubMed using MeSH terms. PLoS One 2017;12:e0173548. [DOI] [PMC free article] [PubMed] [Google Scholar]
- [13].Chien TW, Chow JC, Chang Y, et al. Applying Gini coefficient to evaluate the author research domains associated with the ordering of author names: a bibliometric study. Medicine (Baltimore) 2018;97:e12418. [DOI] [PMC free article] [PubMed] [Google Scholar]
- [14].Chien TW, Chang Y, Wang HY. Understanding the productive author who published papers in medicine using National Health Insurance Database: a systematic review and meta-analysis. Medicine (Baltimore) 2018;97:e9967. [DOI] [PMC free article] [PubMed] [Google Scholar]
- [15].Chien TW, Wang HY, Chang Y, et al. Using Google Maps to display the pattern of coauthor collaborations on the topic of schizophrenia: a systematic review between 1937 and 2017. Schizophr Res 2018;pii: S0920-9964(18)30573-5. [DOI] [PubMed] [Google Scholar]
- [16].Beasley BW, Wright SM. Looking forward to promotion: characteristics of participants in the Prospective Study of Promotion in Academia. J Gen Intern Med 2003;18:705–10.. [DOI] [PMC free article] [PubMed] [Google Scholar]
- [17].Thomas PA, Diener-West M, Canto MI, et al. Results of an academic promotion and career path survey of faculty at the Johns Hopkins University School of Medicine. Acad Med 2004;79:258–64.. [DOI] [PubMed] [Google Scholar]
- [18].Wren JD, Kozak KZ, Johnson KR, et al. The write position. A survey of perceived contributions to papers based on byline position and number of authors. EMBO Rep 2007;8:988–91.. [DOI] [PMC free article] [PubMed] [Google Scholar]
- [19].Sekercioglu CH. Quantifying coauthor contributions. Science 2008;322:371. [DOI] [PubMed] [Google Scholar]
- [20].Batista PD, Campiteli MG, Kinouchi O. Is it possible to compare researchers with different scientific interests? Scientometrics 2006;68:179–89.. [Google Scholar]
- [21].Lindsey D. Further evidence for adjusting for multiple authorship. Scientometrics 1982;4:389–95.. [Google Scholar]
- [22].Egghe L, Rousseau R, Van Hooydonk G. Methods for accrediting publications to authors or countries: Consequences for evaluation studies. J Am Soc Inform Sci 2000;51:145–57.. [Google Scholar]
- [23].Tscharntke T, Hochberg ME, Rand TA, et al. Author sequence and credit for contributions in multiauthored publications. PLOS Biol 2007;5:e18. [DOI] [PMC free article] [PubMed] [Google Scholar]
- [24].Waltman L. A review of the literature on citation impact indicators. 2015. arXiv: 1507.02099. [Google Scholar]
- [25].BatageljV, MrvarA. Pajek - Analysis, and Visualization of Large Networks. inJünger, M., Mutzel, P., (Eds.) pp.77-103. Graph Drawing Software, Springer, Berlin, 2003. [Google Scholar]
- [26].Hirsch JE. An index to quantify an individual's scientific research output. Proc Natl Acad Sci USA 2005;102:16569–72.. [DOI] [PMC free article] [PubMed] [Google Scholar]
- [27].Egghe L. Theory and practise of the g-index. Scientometrics 2006;69:131–52.. [Google Scholar]
- [28].Fenner T, Harris M, Levene M, et al. A novel bibliometric index with a simple geometric interpretation. PLoS One 2018;13:e0200098. [DOI] [PMC free article] [PubMed] [Google Scholar]
- [29].Lippi G, Mattiuzzi C. Scientist impact factor (SIF): a new metric for improving scientists’ evaluation? Ann Transl Med 2017;5:303. [DOI] [PMC free article] [PubMed] [Google Scholar]
- [30].Pan RK, Fortunato S. Author Impact Factor: tracking the dynamics of individual scientific impact. Sci Rep 2014;4:4880. [DOI] [PMC free article] [PubMed] [Google Scholar]
- [31].Kendall MG, Babington SB. The problem of m rankings. Ann Mathem Stat 1939;10:275–87.. [Google Scholar]
- [32].Zaiontz C. Kendall's Coefficient of Concordance (W). Real Statistics Using Excel at http://www.real-statistics.com/reliability/kendalls-w/ [Google Scholar]
- [33].Andrich D. A rating scale formulation for ordered response categories. Psychometrika 1978;43:561–73.. [Google Scholar]
- [34].Vavryčuk V. Fair ranking of researchers and research teams. PLoS One 2018;13:e0195509. [DOI] [PMC free article] [PubMed] [Google Scholar]
- [35].Mimouni M, Zayit-Soudry S, Segal O, et al. Trends in authorship of articles in major ophthalmology journals by gender, 2002–2014. Ophthalmology 2016;123:1824–8.. [DOI] [PubMed] [Google Scholar]
- [36].Huang MH, Chi PS. A comparative analysis of the application of H-index, G-index, and A-index in institutional-level research evaluation. J Library Inform Stud 2010;8:1–0.. [Google Scholar]
- [37].Callaham M, Wears RL, Weber E. Journal prestige, publication bias and other characteristics associated with citation of published studies in peer-reviewed journals. JAMA 2002;287:2847–50.. [DOI] [PubMed] [Google Scholar]
- [38].Kobewka DM, van Walraven C, Taljaard M, et al. The prevalence of potentially preventable deaths in an acute care hospital: A retrospective cohort. Medicine (Baltimore) 2017;96:e6162. [DOI] [PMC free article] [PubMed] [Google Scholar]
- [39].Martinho-Dias D, Sousa-Pinto B, Botelho-Souza J, et al. Publication trends of Allergy, Pediatric Allergy and Immunology, and Clinical and Translational Allergy journals: a MeSH term-based bibliometric analysis. Clin Transl Allergy 2018;8:6. [DOI] [PMC free article] [PubMed] [Google Scholar]
- [40].BiHui J, LiMing L, Rousseau R, et al. The R- and AR-indices: Complementing the h-index. Chin Sci Bullet 2007;52:855–63.. [Google Scholar]
- [41].Perry M, Reny PJ. How to count citations if you must. Am Econ Rev 2016;106:2722–41.. [Google Scholar]
- [42].Hagen NT. Harmonic allocation of authorship credit: source-level correction of bibliometric bias assures accurate publication and citation analysis. PLoS One 2008;3:e4021. [DOI] [PMC free article] [PubMed] [Google Scholar]
- [43].Alotaibi NM, Nassiri F, Badhiwala JH, et al. The most cited works in aneurysmal subarachnoid hemorrhage: a bibliometric analysis of the 100 most cited art. World Neurosurg 2016;89: 587-592.e6. [DOI] [PubMed] [Google Scholar]
- [44].Thulesius H. Assessing research impact with Google Scholar: the most cited articles in the journal 2008–2010. Scand J Prim Health Care 2011;29:193–5.. [DOI] [PMC free article] [PubMed] [Google Scholar]
Associated Data
This section collects any data citations, data availability statements, or supplementary materials included in this article.