

Abstract
Introduction:
The optimal method to detect impairments in cerebrovascular pressure autoregulation in neonates with hypoxic-ischemic encephalopathy (HIE) is unclear. Improving autoregulation monitoring methods would significantly advance neonatal neurocritical care.
Methods:
We tested several mathematical algorithms from the frequency and time domains in a piglet model of HIE, hypothermia, and hypotension. We used laser Doppler flowmetry and induced hypotension to delineate the gold standard lower limit of autoregulation (LLA). Receiver operating characteristic curve analyses were used to determine which indices could distinguish blood pressure above the LLA from that below the LLA in each piglet.
Results:
Phase calculated in the frequency band with maximum coherence, as well as the correlation between mean arterial blood pressure (MAP) and near-infrared spectroscopy relative total tissue hemoglobin (HbT) or regional oxygen saturation (rSO2) accurately discriminated functional from dysfunctional autoregulation. Neither hypoxiaischemia nor hypothermia affected the accuracy of these indices. Coherence alone and gain had low diagnostic value relative to phase and correlation.
Conclusion:
Our findings indicate that phase shift is the most accurate component of autoregulation monitoring in the developing brain, and it can be measured using correlation or by calculating phase when coherence is maximal. Phase and correlation autoregulation indices from MAP and rSO2, and vasoreactivity indices from MAP and HbT are accurate metrics that are suitable for clinical HIE studies.
Keywords: brain hypoxia, cerebrovascular circulation, hypothermia, ischemia, newborn
Introduction
Cerebral pressure autoregulation buffers changes in systemic arterial blood pressure to maintain steady cerebral blood flow (CBF). Dysfunctional autoregulation with pressure-passive CBF may be a key contributor to secondary brain injury in neonatal hypoxicischemic encephalopathy (HIE). [1–5] Though several techniques can be used to monitor autoregulation, the method with greatest accuracy in HIE is unclear. Identifying the most accurate autoregulation monitoring method for use in clinical trials would advance neonatal neurocritical care.
Autoregulation is monitored by detecting the relationship between cerebral perfusion pressure (CPP) and CBF. Autoregulatory vasoreactivity is measured by the relationship between CPP and cerebral blood volume (CBV). In neonates, mean arterial blood pressure (MAP) is the only accessible clinical indicator of CPP. Continuous measures of CBF and CBV in the neonatal clinical setting can be challenging. Transcranial Doppler is commonly used to measure CBF velocity, and changes in intracranial pressure (ICP) can identify CBV fluctuations. [6] However, Doppler cannot be conducted continuously for multiple days, and continuous ICP monitoring is not possible in most neonates.
Near-infrared spectroscopy (NIRS) can be applied noninvasively and continuously to obtain indicators of CBF and CBV that are used to measure autoregulation and vasoreactivity. [6–8] The regional cortical oxygen saturation (rSO2) trends with CBF during periods of stable arterial oxygen saturation and steady cerebral metabolic rate. [9–11] Fluctuations in relative total tissue hemoglobin (HbT), which is the sum of oxygenated and deoxygenated hemoglobin, can detect regional changes in CBV. [6, 11, 12]
Multiple mathematical approaches are used to interrogate the relationship between blood pressure and CBF or CBV and generate autoregulation and vasoreactivity indices. These approaches can be classified into frequency [13, 14] and time [15] domain analyses. Autoregulation has a characteristic impulse-response time that makes the frequency domain attractive because these methods give frequency- specific results. In time-domain analysis, the signals are filtered in the frequency band of cerebral pressure autoregulation before the correlation between perfusion pressure and CBF or CBV is calculated, providing a similar frequency-specific measure. Though both domains have been used to study autoregulation in HIE, [1–4] they are not interchangeable. Direct comparisons between the domains have not been thoroughly tested in HIE. Such a comparison is essential to ensure that the most accurate autoregulation metric is used in clinical research and potentially advanced into clinical practice.
We analyzed data from a piglet model of HIE, hypothermia, rewarming, and controlled hypotension to compare frequency- and time-domain mathematical processing. We used laser Doppler flowmetry (LDF) to measure relative CBF, calculate each piglet’s lower limit of autoregulation (LLA), and thereby distinguish functional from dysfunctional autoregulation. [6, 11] We hypothesized that phase calculated in the bandwidth with highest coherence between MAP and HbT would distinguish blood pressure above the LLA from that below the LLA more accurately than the other indices.
Additionally, hypoxic-ischemic (HI) brain injury and hypothermia affect accuracy in detecting the LLA with NIRS. [9–11] Potential oxidative stress [16] and proinflammatory cytokine shifts [17] during rewarming could affect the magnitude of subsequent vasoreactive responses. If the relative change in vascular responses above the LLA compared to that below the LLA is reduced after rewarming, an index’s ability to detect this change and distinguish functional from dysfunctional autoregulation might be reduced. We secondarily tested whether HI, hypothermia, and rewarming decrease accuracy in distinguishing blood pressure above or below the LLA relative to that of sham procedure or normothermia.
Materials and Methods
We analyzed data from piglets that we have previously reported to conserve animals. [9–11] The Johns Hopkins University Animal Care and Use Committee approved all protocols, and all procedures complied with the United States Public Health Service Policy on the Humane Care and Use of Laboratory Animals and the Guide for the Care and Use of Laboratory Animals. We ensured animal comfort at all points in the protocols.
Within each study, [9–11] male piglets (3–5 days old, 1–2.5 kg) were randomized to undergo HI or sham procedure (Figure 1). Some piglets were also randomized to receive normothermia, sustained whole-body hypothermia, or hypothermia+rewarming. Others recovered for 1 or 2 days after HI. All piglets with available autoregulation data were analyzed for the current study.
Figure 1.
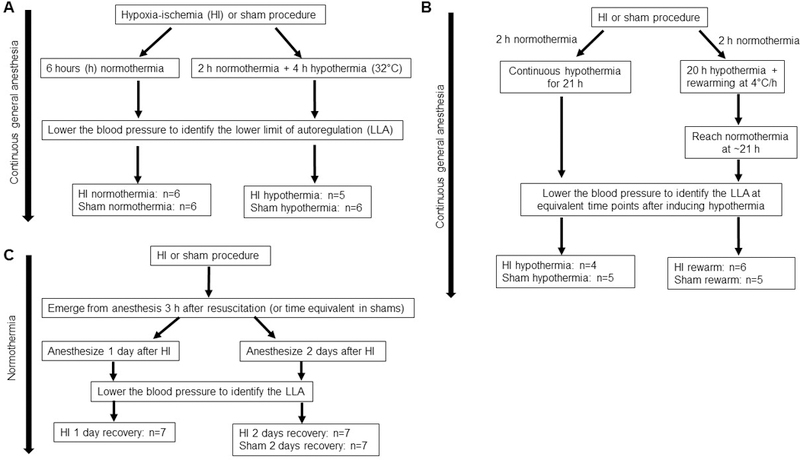
Data were analyzed from piglets of three previously published studies. [9–11] Panels A, B, and C show each study’s design and group allocation after randomization.
Anesthesia and surgery
We induced general anesthesia with 5% isoflurane in 50%/50% nitrous oxide/oxygen through a nose cone. The piglets were intubated and mechanically ventilated to maintain normocapnea. A femoral venous catheter and a femoral arterial catheter were placed for intravenous (IV) fluids, medications, blood sampling, and continuous arterial blood pressure monitoring. Fentanyl (10 mcg/kg bolus + 10–20 mcg/kg/h IV) was started, and the isoflurane was decreased to 1.5%. All piglets received vecuronium (1 mg/kg/h) to prevent respiratory effort during the hypoxia-asphyxia protocol for HI injury and to provide the same anesthetic to all groups. A 5 French balloon catheter was inserted into the contralateral femoral vein and advanced into the inferior vena cava for later inflation to induce controlled hypotension. Three cranial, frontoparietal burr holes (≤4 mm each) were made for placement of the laser Doppler probe (Moor Instruments, Devon, U.K., model DRT4), ICP monitor, and temperature probe. A NIRS pediatric optode (Covidien, Boulder, CO) was placed on the skin contralateral to the invasive monitors to measure contralateral frontoparietal cortex. We decreased the isoflurane to 0.4% [10] or 0.8% [9, 11] upon completion of surgery. The fentanyl and nitrous oxide continued for the rest of the experiment.
For the cohort of piglets that emerged from anesthesia, we re-induced anesthesia as described above 1 or 2 days after HI or sham procedure (Figure 1C). The femoral 5 French venous balloon catheter and intracranial monitors were placed during the second anesthetic.
HI brain injury
We previously published our HI injury protocol. [18] This protocol produces hypoxic and ischemic neuronal and glial cell injury in cortex, white matter, and putamen. [9, 18–20] Briefly, we lowered the inspired fraction of oxygen (FiO2) to 0.10 for 45 min followed by min of room air, which is required for successful cardiac resuscitation. Then, the endotracheal tube was clamped for 7 min to produce asphyxia. We resuscitated the piglets with chest compressions and epinephrine (0.1 mg/kg IV). Piglets that did not resuscitate by 3 min of compressions were excluded. Sham piglets received the same anesthesia and surgery but did not undergo HI.
Temperature
Some piglets remained normothermic at a goal rectal temperature of 37.5–39.5°C (normothermia for swine) with warming blankets and a heating lamp (Figure 1B). Piglets randomized to receive hypothermia had whole-body cooling initiated 2 h after resuscitation from HI or time equivalent in shams. Hypothermia was induced with a cooling blanket and ice packs to achieve a goal rectal temperature of 32°C. We delay hypothermia induction by 2 h to mimic the cooling delays that may occur during clinical treatment of HIE. Some piglets received whole-body rewarming at 4°C/h. Rewarming was accomplished by increasing the water temperature that circulated through the blanket and by applying warm packs. Rewarming did not overshoot the normothermic goal temperature. Sham piglets received the same temperature regimen as did HI piglets.
Cerebral signal acquisition
We synchronously sampled the LDF, NIRS rSO2 and HbT, ICP, and MAP at a sample rate of 100 Hz with ICM+ software (Cambridge University, Cambridge, UK). The HbT was obtained from NIRS measurements at 805 nm wavelength, which is isosbestic to both deoxy- and oxyhemoglobin. [6] All signals were averaged in 10-s consecutive windows. This operation resamples the data at 0.1 Hz and eliminates high-frequency noise from respiration and pulse yet still permits signal analyses of oscillations <0.05 Hz. [15] The CPP was calculated as MAP-ICP. Changes in CBF were estimated by LDF and rSO2. [9–11] Fluctuations in CBV were estimated by ICP and HbT. [6]
Identifying the lower limit of autoregulation
After obtaining data for at least 2–3 h during normotension with an apparent LDF autoregulatory plateau, we slowly inflated the balloon catheter in the femoral vein over 2–3 h using a syringe pump to decrease venous return. In rewarmed pigs, the balloon catheter inflation began after normothermia was reached. A scatter plot was generated between CPP and LDF for each piglet across the entire 2–3 h period of balloon catheter inflation (Figure 2). We then identified each piglet’s LLA by using piecewise regression of the plot of LDF as a function of CPP (SigmaStat 3.1, Systat, San Jose, CA). We previously reported the piglets’ LLA values (Supplemental Table 1 ). [9–11] The investigator who calculated the LLAs (JKL) was blinded to the time and frequency domain indices.
Figure 2.
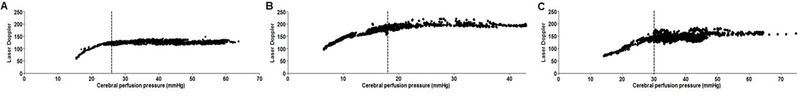
Examples of cerebral blood flow measurements by laser Doppler flowmetry in three piglets. The vertical line demarcates each piglet’s lower limit of autoregulation. (A, B) Two different piglets that received hypoxic-ischemic (HI) brain injury and hypothermia. (C) HI-injured piglet with normothermia.
Frequency- and time-domain analytics
We summarize the frequency domain analytics of autoregulation and their different interpretations. When blood pressure is on the autoregulatory plateau, the input (MAP or CPP) wave is not transmitted to the output CBF. This generates low coherence and low gain between blood pressure and CBF. Functional vasoreactivity is identified when an increase in blood pressure causes a decrease in CBV, thereby generating coherence with a negative phase shift (blood pressure and CBV are out-of-phase). When blood pressure is below the LLA with pressure-passive CBF and CBV, blood pressure is coherent to both CBF and CBV with positive phase shift (blood pressure and CBF or CBV are in-phase) and high gain.
In the time domain, blood pressure along the autoregulatory plateau generates a near-zero correlation between blood pressure and CBF. Functional vasoreactivity results in a negative correlation between blood pressure and CBV with negative phase shift (out-of-phase). When blood pressure is below the LLA, there is a positive correlation between blood pressure and CBV or CBF with positive phase shift (in-phase).
Frequency and time domain signal processing
We exported the data from ICM+ to MATLAB (Mathworks Inc., Natick, MA, USA), and an investigator blinded to piglet treatment group (RG) calculated the autoregulation and vasoreactivity indices offline. Autoregulation indices were generated from three pairs of input and output signals: (1) MAP and rSO2, (2) CPP and LDF, and (3) MAP and LDF. We also calculated vasoreactivity indices from three pairs of input and output signals: (1) MAP and HbT, (2) CPP and HbT, and (3) MAP and ICP. Though only the MAP and NIRS rSO2 and HbT are routinely available during neonatal neurocritical care, we included the additional signal pairs that have been commonly used in translational and adult autoregulation studies for comparative purposes. The relationship between transcranial Doppler (analogous to laser Doppler flux) and either MAP [21] or CPP, [22] depending on the availability of ICP monitoring to calculate CPP, has been well described as an autoregulation measure. Classic vasoreactivity monitoring in adult and pediatric studies has been derived from the pressure reactivity index, with MAP as the input and ICP as the output. [23, 24]
Each piglet’s signals were partitioned into 6-min, consecutive epochs. This method provides a balance between having adequate time spans in each epoch that are long enough to accurately detect events that last 1 min [25] yet also short enough to obtain multiple measurements with perfusion pressure above or below the LLA. This ensured autoregulation index comparisons in equivalent time epochs. The 6-min epoch approximates the epoch that is frequently used in correlation analyses [26] and exceeds the epoch length of other coherence studies using short datasets in the low frequency band. [27]
We used four mathematical algorithms to calculate indices from spectral coherence, cosine of the cross-spectral phase, gain, and Pearson’s correlation coefficient for each pair of signals. These methods are described in detail below. In total, this method generated 12 autoregulation indices and 12 vasoreactivity indices.
A representative index value for dysfunctional autoregulation was generated for each piglet by averaging all values obtained from epochs with CPP 3 mmHg or more below the LLA. Similarly, a representative index value for functional autoregulation was calculated as the average of all values from epochs with CPP 3 mmHg or greater above the LLA. Thus, each piglet had one index for dysfunctional autoregulation (blood pressure below the LLA) and one index for functional autoregulation (blood pressure above the LLA) from each signal pair (e.g., MAP and HbT) and mathematical algorithm (e.g., cosine of the cross-spectral phase). We excluded data from CPP less than 3 mmHg above or below the LLA to clearly distinguish dysfunctional from functional autoregulation.
Spectral coherence (frequency domain)
In piglets, spontaneous fluctuations in MAP and ICP and the corresponding changes in rSO2 and HbT operate in the time scale of approximately 50–300 s. [6, 15] Coherence was calculated in the frequency range 0.003–0.02 Hz (50 to 333 s) where piglet autoregulation is detectable. Several methods can be used to estimate coherence, including the multivariate autoregressive (MAR) approach, the Welch periodogram approach, [28] and the smoothing of spectral quantities or tapering approach. [27, 29] Because the MAR method is most suitable for datasets with a small number of samples within relatively short time epochs, [30] we used this approach for the current study. This is also consistent with methodology in other studies with short epochs. [27, 31]
We modeled the data using an MAR process with model order determined by Akaike information criterion. [32] The model order varied between 28 and 40 for different datasets. For consistency, we set a model order of 40 for all datasets. We estimated the regression coefficients through a modified Yule-Walker approach [27, 33] and calculated a covariance matrix from the residual errors. The MAR coefficients and error covariance matrix were used to calculate the cross-spectrum between the two signals and the auto (power) spectra of the two signals. [33] Then, we calculated the spectral coherence (COH) as the ratio of the square of the magnitude of the cross-spectrum to the product of the auto-spectra of the two signals. COH is a continuous measure that approaches 1 as two signals become increasingly associated but does not discern the presence of phase shift between two signals that have power in a common frequency. In cases of perfect association, the COH is 1 regardless of the phasic relationship. COH is zero when the two signals are not associated. We used the maximum COH within the frequency 0.003–0.02 Hz for the statistical analysis.
Cosine of the cross-spectral phase (frequency domain)
We identified the frequency band with maximum COH within the frequency range 0.003–0.02 Hz where piglet autoregulation is detectable. [6, 15] We then calculated phase shift between the input and output signals using the cross-spectrum at the frequency band with maximum COH. The emphasis on studying phase shift in coherent data is similar to wavelet transform phase shift methodology that calculates phase only when coherence exceeds 0.48. [34] However, our method differs in that we do not use a coherence threshold. Rather, we calculate phase in the frequency band of maximum COH, and we do not require the data to pass a predetermined COH limit. Then, the phase value was cosine transformed for analysis (phase).
Gain (frequency domain)
We calculated the input-output transfer gain as the ratio of the magnitude of the crossspectrum to the power spectrum of the input signal. [14] The gain value at the frequency of maximum coherence within 0.003–0.02 Hz was used for the statistical analysis.
Pearson’s correlation coefficient (time domain)
We calculated a Pearson’s correlation coefficient (COR) between signal pairs averaged in 10-s epochs. When autoregulation is functional and MAP is above the LLA and along the autoregulatory plateau, analysis of blood pressure (MAP or CPP) and CBF (LDF or rSO2) yields a negative or near-zero COR (incoherent or coherent with phase shift). When MAP is below the LLA during dysfunctional autoregulation, COR approaches 1 and becomes increasingly positive with progressive impairments in autoregulation (coherent with minimal phase shift).
The inverse relationship between blood pressure (MAP or CPP) and CBV (ICP or HbT) during functional vasoreactivity generates a negative COR that approaches −1 with robust vasoreactivity (coherent with phase shift). Dysfunctional and pressure-passive vasoreactivity yields a positive COR that approaches 1 (coherent with minimal phase shift).
Statistical analysis
We used receiver operating characteristic (ROC) analyses to describe each index’s ability to distinguish functional autoregulation or vasoreactivity (CPP above the LLA) from dysfunctional autoregulation or vasoreactivity (CPP below the LLA). The 95% confidence interval (CI) of the area under the ROC curve (AUC) was determined by bootstrapping piglets with over 1000 replications for each index. [35] We estimated index AUCs and CIs for all piglets and separately for only HI piglets and only shams. Based on visual inspection of a graph with AUCs (Figure 3 and 4), the indices with the highest estimated AUCs were placed into “group 1” and those with the lowest AUCs were placed into “group 2.” We also estimated AUCs and 95% bootstrap CIs for piglets stratified by normothermia, sustained hypothermia, or rewarming.
Figure 3.
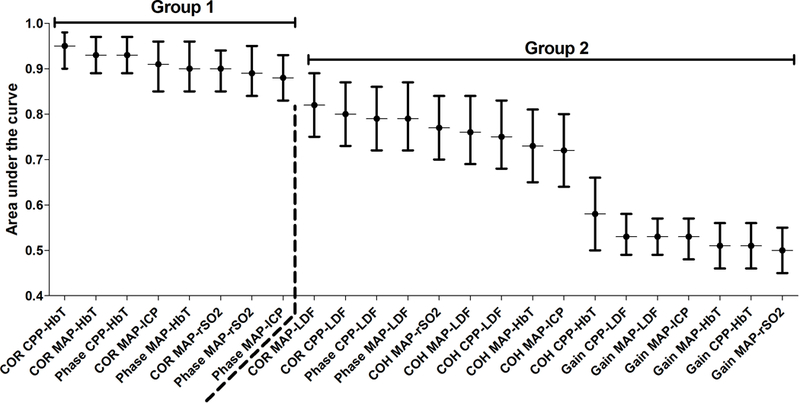
The areas under the curve (AUC) from the receiver operator characteristic analysis of each index’s ability to discriminate CPP below the LLA from CPP above the LLA in all piglets (n=66). The indices were divided into groups 1 and 2 based on visual inspection of the AUCs. The dashed line separates groups 1 and 2.
Figure 4.
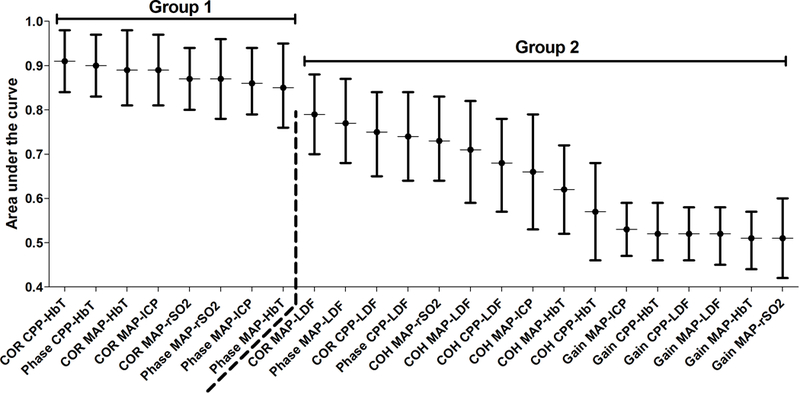
The areas under the curve (AUC) from the receiver operator characteristic analysis of each index’s ability to discriminate CPP below the LLA from CPP above the LLA in 35 piglets with hypoxic-ischemic brain injury. The indices were divided into groups 1 and 2 based on visual inspection of the AUCs. The dashed line separates groups 1 and 2.
Then, we used a pairwise bootstrap approach to compare each index’s AUC against all others. We conducted these analyses using data from all piglets and separately among HI piglets and among shams. We used the bootstrap method to resample piglets while accounting for each piglet having multiple measures at different instances, and we compared the resulting distribution of estimated AUC for each index pair. We randomly permuted the index type of each piglet to simulate an environment under the null hypothesis that the indices are equally good measures, as is recommended for hypothesis testing with the bootstrap method. [36] We compared the difference in AUC between each index pair to the bootstrap-constructed distribution of differences under the null hypothesis of no difference (equivalent to a Δ [difference] in AUC of 0). [37] Because the number of index pairs is large (24 indices, choose 2 = 276 comparisons), we adjusted for multiple comparisons to maintain an overall type one error rate of 0.05 using Benjamini and Hochberg’s method. [38]
To explore whether HI affected each index’s ability to distinguish CPP above and below the LLA, we estimated the difference in AUC between HI piglets and shams and tested this difference against the null hypothesis of no difference (ΔAUC 0). We also explored whether temperature affected each index’s ability to discriminate CPP above the LLA from CPP below the LLA. To accomplish this, we made pairwise comparisons between the normothermia, sustained hypothermia, and rewarming groups to determine whether the difference in AUC between piglets of different temperature regimens differed from the null hypothesis of no difference (ΔAUC 0).
Results
Data were available for 68 piglets. Two piglets were excluded because their blood pressure decreased too rapidly and 6-min epochs could not be constructed for CPP below the LLA. The mean (±standard deviation) number of 6-min epochs in periods with CPP below or CPP above the LLA was 46.6±44.9 (range: 1–249) and 131.7±94.8 (range: 12–395), respectively, for all piglets in all experimental conditions. The mean values of each index for CPP above or below the LLA are shown in Supplemental Table 2.
Comparison of the indices’ abilities to discriminate between CPP above and CPP below the LLA in all piglets
The AUC values with 95% CI for the COR, phase, COH, and gain indices are shown in Figure 3. Indices in group 1 demonstrated high discriminatory ability to distinguish whether CPP was above or below the LLA. The group 1 indices were CORCPP-HbT, CORMAP-HbT, PhaseCPP-HbT, CORMAP-ICP, PhaseMAP-HbT, CORMAP-rSO2, PhaseMAP-rSO2, and PhaseMAP-ICP. In contrast, the group 2 indices had modest, and in some cases poor, discriminatory ability. The group 2 indices were CORMAP-LDF, CORCPP-LDF, PhaseCCP-LDF, PhaseMAP-LDF, COHMAP-rSO2, COHMAP-LDF, COHCPP-LDF, COHMAP-HbT, COHMAP-ICP, COHCPP-HbT, GainCPP-LDF, GainMAP-LDF, GainMAP-ICP,GainMAP-HbT, GainCPP-HbT, and GainMAP-rSO2.
Pairwise comparisons revealed no significant AUC differences among the indices of group 1, suggesting comparable discriminatory ability across these metrics (adjusted p>0.05 for all comparisons; figure 3). Several indices in group 1 had significantly higher AUCs than those in group 2 (Table 1). The AUCs of all group 1 indices significantly exceeded that of each gain metric (adjusted p<0.05 for all comparisons; data not shown).
Table 1.
Statistically significant, pairwise comparisons of the receiver operator characteristic area under the curve for autoregulation and vasoreactivity indices in all piglets (n=66)
| GROUP 2 | ||||||||||
|---|---|---|---|---|---|---|---|---|---|---|
| COR MAP- LDF |
COR CPP- LDF |
Phase MAP-LDF |
Phase CPP-LDF |
COH MAP- rSO2 a |
COH MAP- LDF |
COH CPP- LDF |
COH MAP- HbT a |
COH MAP- ICP |
COH CPP- HbT |
|
| GROUP 1 | ||||||||||
| COR MAP-HbT a | Δ0.16 * (0.10, 0.23) | Δ0.17 * (0.09, 0.25) | Δ0.18 * (0.11, 0.26) | Δ0.20 * (0.13, 0.27) | Δ0.21 * (0.13, 0.30) | Δ0.35 * (0.27, 0.43) | ||||
| COR MAP-rSO2 a | Δ0.12 * (0.06, 0.19) | Δ0.13 * (0.07, 0.20) | Δ0.14 * (0.08, 0.22) | Δ0.16 * (0.09, 0.24) | Δ0.17 * (0.09, 0.26) | Δ0.31 * (0.23, 0.40) | ||||
| COR CPP-HbT | Δ0.12 * (0.06, 0.19) | Δ0.14 * (0.08, 0.21) | Δ0.15 * (0.07, 0.23) | Δ0.15 * (0.08, 0.23) | Δ0.17 * (0.10, 0.24) | Δ0.18 * (0.10, 0.25) | Δ0.19 * (0.11, 0.27) | Δ0.21 * (0.13, 0.29) |
Δ0.22 * (0.14, 0.30) | Δ0.36 * (0.27, 0.44) |
| COR MAP-ICP | Δ0.14 * (0.06, 0.22) | Δ0.15 * (0.08, 0.24) | Δ0.17 * (0.10, 0.25) | Δ0.18 * (0.11, 0.26) | Δ0.32 * (0.24, 0.41) | |||||
| Phase MAP-HbT a | Δ0.13 * (0.06, 0.20) | Δ0.14 * (0.06, 0.21) | Δ0.15 * (0.08, 0.23) | Δ0.17 * (0.10, 0.25) | Δ0.18 * (0.09, 0.27) | Δ0.32 * (0.24, 0.41) | ||||
| Phase MAP-rSO2 a | Δ0.12 * (0.06, 0.19) | Δ0.13 * (0.06, 0.20) | Δ0.14 * (0.07, 0.22) | Δ0.16 * (0.10, 0.23) | Δ0.17 * (0.08, 0.26) | Δ0.31 * (0.23, 0.40) | ||||
| Phase CPP-HbT | Δ0.16 * (0.09, 0.23) | Δ0.16 * (0.09, 0.24) | Δ0.18 * (0.10, 0.25) | Δ0.20 * (0.12, 0.27) | Δ0.21 * (0.13, 0.29) | Δ0.35 * (0.26, 0.43) | ||||
| Phase MAP-ICP | Δ0.13 * (0.05, 0.21) | Δ0.15 * (0.08, 0.23) | Δ0.16 * (0.08, 0.24) | Δ0.30 * (0.21, 0.39) | ||||||
Data shown represent the difference in area under the curve for the group 1 index – group 2 index (Δ) and 95% confidence intervals.
Adjusted p-value<0.05.
COR, correlation; MAP, mean arterial blood pressure; LDF, Laser Doppler flowmetry; CPP, cerebral perfusion pressure; Phase, cosine of the cross-spectral phase; COH, spectral coherence; rSO2, near-infrared spectroscopy regional oxyhemoglobin saturation; HbT, near-infrared spectroscopy relative total tissue hemoglobin; ICP, intracranial pressure.
The index is derived from parameters that are available during neonatal clinical care.
Comparison of the indices after HI brain injury
Among piglets with HI injury, no statistical differences in AUC were observed among the group 1 indices (figure 4). Several group 1 indices had significantly higher AUC than did several group 2 indices (Table 2). All gain metrics had significantly lower AUC than each of group 1’s indices (adjusted p<0.05 for all comparisons; data not shown).
Table 2.
Statistically significant, pairwise comparisons of the receiver operator characteristic area under the curve for autoregulation and vasoreactivity indices in piglets with hypoxic-ischemic brain injury (n=35).
| GROUP 2 | ||||||
|---|---|---|---|---|---|---|
| COH MAP- rSO2 a |
COH MAP- LDF |
COH CPP- LDF |
COH MAP- HbT a |
COH MAP- ICP |
COH CPP- HbT |
|
| GROUP 1 | ||||||
| COR MAP-HbT a | Δ0.16 * (0.07, 0.26) | Δ0.22 * (0.09, 0.34) | Δ0.27 * (0.16, 0.39) | Δ0.32 * (0.21, 0.45) | ||
| COR MAP-rSO2 a | Δ0.20 * (0.09, 0.30) | Δ0.25 * (0.15, 0.35) | Δ0.21 * (0.08, 0.34) | Δ0.30 * (0.19, 0.42) | ||
| COR CPP-HbT | Δ0.18 * (0.10, 0.26) | Δ0.20 * (0.09, 0.32) | Δ0.23 * (0.12, 0.36) | Δ0.29 * (0.29, 0.40) | Δ0.25 * (0.13, 0.37) | Δ0.34 * (0.23, 0.46) |
| COR MAP-ICP | Δ0.21 * (0.09, 0.35) | Δ0.27 * (0.18, 0.37) | Δ0.23 * (0.13, 0.33) | 0.32 * (0.20, 0.45) | ||
| Phase MAP-HbT a | Δ0.18 * (0.06, 0.31) | Δ0.23 * (0.12, 0.36) | Δ0.29 * (0.17, 0.42) | |||
| Phase MAP-rSO2 a | Δ0.13 * (0.05, 0.22) | Δ0.19 * (0.08, 0.31) | Δ0.25 * (0.15, 0.35) | Δ0.30 * (0.18, 0.43) | ||
| Phase CPP-HbT | Δ0.17 * (0.09, 0.25) | Δ0.19 * (0.08, 0.31) | Δ0.22 * (0.11, 0.34) | Δ0.28 * (0.18, 0.38) | Δ0.33 * (0.23, 0.45) | |
| Phase MAP-ICP | Δ0.20 * (0.10, 0.30) | Δ0.29 * (0.18, 0.42) | ||||
Data shown represent the difference in area under the curve for the group 1 index – group 2 index (Δ) and 95% confidence intervals.
Adjusted p-value<0.05.
COH, spectral coherence; CPP, cerebral perfusion pressure; LDF, Laser Doppler flowmetry; MAP, mean arterial blood pressure; HbT, near-infrared spectroscopy relative total tissue hemoglobin; COR, correlation; ICP, intracranial pressure; rSO2, near-infrared spectroscopy regional oxyhemoglobin saturation; Phase, cosine of the cross-spectral phase.
The index is derived from parameters that are available during neonatal clinical care.
Comparison of the indices after sham procedure
Among sham piglets, the AUC did not statistically differ between any group 1 indices. Several group 1 indices had higher AUC than group 2 indices (Table 3). Every gain index had lower AUC than each group 1 index (adjusted p<0.05 for all comparisons; data not shown).
Table 3.
Statistically significant, pairwise comparisons of the receiver operator characteristic area under the curve for autoregulation and vasoreactivity indices in piglets with sham procedure (n=31).
| GROUP 2 | ||
|---|---|---|
| COH MAP- ICP |
COH CPP- HbT |
|
| GROUP 1 | ||
| COR MAP-HbT a | Δ0.36 * (0.26, 0.47) | |
| COR MAP-rSO2 a | Δ0.32 * (0.22, 0.43) | |
| COR CPP-HbT | Δ0.17 * (0.08, 0.28 |
Δ0.37 * (0.26, 0.48) |
| COR MAP-ICP | Δ0.32 * (0.20, 0.43) | |
| Phase MAP-HbT a | Δ0.34 * (0.23, 0.45) | |
| Phase MAP-rSO2 a | Δ0.33 * (0.22, 0.45) | |
| Phase CPP-HbT | Δ0.36 * (0.26, 0.47) | |
| Phase MAP-ICP | Δ0.30 * (0.18, 0.42) | |
Data shown represent the difference in area under the curve for the group 1 index – group 2 index (Δ) and 95% confidence intervals.
Adjusted p-value<0.05.
COH, spectral coherence; CPP, cerebral perfusion pressure; LDF, Laser Doppler flowmetry; MAP, mean arterial blood pressure; HbT, near-infrared spectroscopy relative total tissue hemoglobin; COR, correlation; ICP, intracranial pressure; rSO2, near-infrared spectroscopy regional oxyhemoglobin saturation; Phase, cosine of the cross-spectral phase.
The index is derived from parameters that are available during neonatal clinical care.
Impact of HI or temperature on the indices
The effects of HI brain injury and temperature on the indices’ ability to distinguish CPP below or above the LLA are shown in Table 4. HI and temperature did not significantly affect the ability to diagnose CPP below or above the LLA in any group 1 index (p>0.05 for all comparisons). Among the group 2 indices, HI decreased the accuracy of COHMAP-LDF and COHMAP-HbT to below that of sham procedure (p<0.05 for each). COHMAP-ICP performed significantly better during hypothermia than during normothermia (p<0.05). Discriminatory ability of COHCPP-LDF was greater in hypothermia than in rewarming (p<0.05). CORMAP-LDF performed better in normothermia than in rewarming (p<0.05). Finally, GainCPP-LDF had greater diagnostic ability after rewarming than during normothermia (p<0.05).
Table 4.
Statistically significant, pairwise comparisons of the receiver operator characteristic area under the curve between hypoxic-ischemic (n=35) and sham (n=31) piglets and between normothermia (n=35), sustained hypothermia (n=20), and rewarming (n=11).
| Experimental Condition |
Metric | ΔAUC | Lower limit 95% CI |
Upper limit 95% CI |
p value |
|---|---|---|---|---|---|
| HI vs. Sham | COH CPP-LDF | −0.16 b | −0.3 | −0.02 | 0.037 |
| COH MAP-HbT a | −0.25 b | −0.40 | −0.10 | 0.005 | |
| Hypothermia vs. normothermia | COH MAP-ICP | 0.22 c | 0.06 | 0.38 | 0.019 |
| Hypothermia vs. rewarming | COH CPP-LDF | 0.21 d | 0.03 | 0.39 | 0.046 |
| Normothermia vs. rewarming | COR MAP-LDF | 0.20 e | 0.0 | 0.42 | 0.049 |
| Normothermia vs. rewarming | Gain CPP-LDF | −0.20 f | −0.35 | 0.0 | 0.009 |
ΔAUC, difference in area under the curve; CI, confidence interval; HI, hypoxia ischemia; COH, spectral coherence; CPP, cerebral perfusion pressure; LDF, Laser Doppler flowmetry; MAP, mean arterial blood pressure; HbT, near-infrared spectroscopy relative total tissue hemoglobin; ICP, intracranial pressure; COR, correlation.
The index is derived from parameters that are available during neonatal clinical care.
The index had lower diagnostic ability after HI than after sham procedure.
, The index had greater diagnostic ability during sustained hypothermia than during normothermia.
The index had greater diagnostic ability during sustained hypothermia than after rewarming.
The index had greater diagnostic ability during normothermia than after rewarming.
The index had greater diagnostic ability after rewarming than during normothermia
Discussion
We compared the diagnostic ability of frequency (COH, phase, gain) and time (COR) domain autoregulation and vasoreactivity indices to discriminate CPP below the LLA from CPP above the LLA in a neonatal piglet model of HIE, hypothermia, rewarming, and controlled hypotension. Both COR and phase had high accuracy for identifying pressure passivity, whereas COH alone and gain at the bandwidth of maximal coherence performed poorly. Because both COR and phase quantify the phase shift between the input (MAP or CPP) and output (rSO2, LDF, HbT, or ICP) signals involved in autoregulation, our findings indicate that phase shift is the most important component of the relationship between blood pressure and CBF or CBV to capture when monitoring autoregulation and vasoreactivity in the HI-injured, developing brain.
Coherence measures the transmission of blood pressure waves to the CBF and CBV, and gain measures the magnitude of this transmission. The relatively low discriminatory power of coherence alone and gain suggest that perfusion pressure waves are similarly transmitted to the CBF and CBV regardless of whether blood pressure is above or below the LLA. Coherence and gain do not take phase shift into account, and autoregulatory vasoreactivity is multiphasic. When blood pressure is on the autoregulatory plateau, blood pressure and CBV are out of phase. When blood pressure decreases to below the LLA, blood pressure and CBV are pressure passive and in phase. We theorize that COH alone and gain poorly distinguished pressure reactivity from pressure passivity over the examined frequency band because COH and gain do not assess the phase relationship.
Few neonatal studies have directly compared frequency and time domain methods within the same subject. One study of 12 piglets reported that COH alone poorly characterized autoregulation. [39] Here, we verify in a larger piglet cohort that COH alone is indeed a poor autoregulation metric, including after HI injury. In a clinical study of 60 premature neonates that compared NIRS frequency and time domain methods, the authors concluded that time domain is a more accurate and easier method for neonatal autoregulation monitoring. [40] However, that study did not evaluate phase in the frequency bandwidth of maximum COH. Moreover, that and most clinical neonatal studies do not have a comparative and continuous CBF measure to define the state of autoregulation. The advantage of testing mathematical algorithms in a piglet model is that we can use LDF to continuously detect CBF, accurately determine when blood pressure is above or below the LLA, and generate a gold standard against which different algorithms can be tested within the same animal. With these methods, we were able to perform systematic comparative analyses among autoregulation metrics and identify phase and COR approaches as those that should move forward to clinical validation studies.
Phase and COR did not show a statistical difference when calculated from the NIRS HbT or rSO2. Multiple factors can influence rSO2, including the fluctuations in cerebral metabolic rate that occur with changes in sedation or pain management, changes in oxygen delivery, and changes in temperature. Because HbT is calculated at the 805 nm wavelength that is isosbestic to both oxygenated and deoxygenated hemoglobin, it should be relatively unaffected by changes in cerebral metabolic rate or oxygen delivery provided that the total hemoglobin, carbon dioxide, and sedation levels remain constant. We maintained normocapnea within a constant plane of anesthesia in our piglets, and we did not use hemorrhage as a method to induce hypotension. Accordingly, the indices derived from rSO2 performed as well as those from HbT. However, treatment and physiologic conditions cannot be as rigorously controlled in clinical practice. Whether the accuracy of autoregulation and vasoreactivity indices from rSO2 and HbT differ during clinical treatment of HIE deserves study.
Monitoring methods ideally should be validated in preclinical models and controlled physiologic experiments before clinical deployment. Among the indices calculated from parameters available during routine neonatal clinical care (specifically MAP, HbT, and rSO2), the HI injury significantly decreased the ability of COHMAP-HbT to detect pressure passivity relative to that of sham procedure. The fact that HI injury did not affect accuracy of phase and COR supports the use of these metrics in clinical HIE studies. Moreover, temperature did not affect the accuracy of indices derived from MAP and HbT or rSO2, which supports their use in clinical studies.
We did not induce hypotension during rewarming because we assumed that the change in cerebral metabolic rate and CBF coupling would confound our measurements. CORMAP-LDF had lower diagnostic accuracy after rewarming than during normothermia, whereas GainCPP-LDF performed better after rewarming than during normothermia. Further testing on autoregulation monitoring during and after rewarming is critical if these metrics are to be considered for clinical use. The closest clinical correlate to LDF is transcranial Doppler. Autoregulatory vasoreactivity remains disrupted after the completion of rewarming from clinical hypothermic cardiopulmonary bypass, [41] hypothermic treatment for adult traumatic brain injury, [42] and in rats. [43] In neonatal HIE, potential oxidative stress [16] and inflammation [17] during rewarming could affect the magnitude and change in subsequent vasoreactive responses as blood pressure changes. This could affect whether an index can detect the relative change in vascular reactivity when blood pressure is above versus below the LLA. Moreover, the piglet rewarming rate of 4°C/h in this study is faster than typical clinical rewarming rates for HIE, which are usually 0.25–0.5°C/h. Studies using more clinically relevant rewarming rates are needed.
We have determined that phase and COR have the best ability to discriminate pressure passivity versus pressure reactivity in piglets. We cannot examine neuropathologic injury or behavioral outcomes in our piglets because of the severe injury that occurs from induced hypotension. Nonetheless, phase and COR using MAP and NIRS HbT or rSO2 appear to be reliable candidate measures for clinical autoregulation studies in HIE.
We specifically analyzed maximal COH. Though it is possible that our COH estimates were not reliable, the phase calculations in the frequency band of maximal COH distinguished blood pressure above from that below the LLA with high accuracy. Phase between two signals in a frequency band is only reliable if the COH meets the significance criterion at that frequency band. Thus, the excellent performance of phase suggests that our COH estimations were accurate. Additional studies are needed to examine relevant coherence thresholds in HIE.
Each piglet’s LLA was identified using piecewise regression of a static LDF-CPP curve from the entire 2–3 h period of induced hypotension without a time series analysis. This method provides a gold standard LLA, and the LLAs were calculated by an investigator blinded to the autoregulation indices. However, using a regression method to identify the LLA has similarities with time domain COR, and this could potentially bias index performance. Nevertheless, metrics from both the frequency and time domains accurately distinguished blood pressure above from that below the LLA. The top performing indices COR and phase in the bandwidth of maximal coherence showed no statistical AUC differences. Thus, our method of calculating the LLA did not favor the time domain over the frequency domain. Though we did not use alternative methods to calculate the LLA to double check our findings, we visually verified the LLA by inspecting each piglet’s LDF-CPP plot (examples are shown in figure 2). Clinically, the goal of autoregulation monitoring is to detect the risk of neurologic injury before injury occurs by identifying the LLA and maintaining blood pressure above the LLA. We will explore whether phase or COR predict brain injury in clinical HIE in future studies.
The appropriate frequency bandwidth for detecting autoregulation and vasoreactivity signals is the subject of much debate with high variation. [1, 5, 44] Because we previously established that spontaneous fluctuations in CPP typically occur on the time scale of 50–300 s, [6, 15] we focused our analyses within the frequency range 0.003–0.02 Hz (50 to 333 s). A recent study with constant frequency oscillations in CPP in piglets showed that maximal phase shift between MAP and ICP (which reflects CBV fluctuations) occurs at 0.017 Hz (1 min). [25] This is within the range tested in our study.
The piglet methodology must be distinguished from clinical practice. The piglets were under anesthesia to ensure comfort using low-dose isoflurane. Though higher doses of isoflurane may uncouple CBF, [45] the low dose of isoflurane in our experiment still revealed apparent blood pressure ranges with an autoregulatory plateau, LLA, and pressure passivity, [9–11] as shown in Figure 2. Clinically, babies receive a lighter level of sedation, which may cause changes in cerebral metabolic rate and movement. This can change the oxyhemoglobin concentration, which would be expected to have a greater effect on rSO2 than on HbT, and introduce monitoring artifacts. Clinicians do not permit neonates to have extremely low blood pressure as we did with the piglets. We also separated the blood pressure range for above the LLA from that below the LLA by 3 mmHg to clearly delineate functional from dysfunctional autoregulation. Differences in clinical autoregulatory function may be harder to detect with narrower blood pressure ranges.
We acknowledge several limitations. Few prior studies directly compare different autoregulation metrics in the piglet model. Without the necessary input from previous studies, such as the expected difference in the predictive power of the autoregulation indices and their respective measurement error, we were unable to quantify the power in this study to detect statistical differences. We only tested males, and data were analyzed retrospectively from three separate studies. We did not measure hypertension and autoregulatory function because newborn piglets frequently suffer cardiac failure before the upper limit of autoregulation can be reached. Though we calculated gain at the frequency of maximum COH, we did not assess the statistical significance of the COH or use a COH threshold. Determining the statistical significance of COH prior to calculating gain may improve accuracy. Because the COH threshold for brain injury in HIE is not known, we used the maximal COH in this exploratory, preclinical study. We did not examine wavelet COH analysis [5] or neurovascular coupling. [46]
Conclusion
In a neonatal piglet model of HI brain injury, phase and COR calculations between MAP and NIRS HbT or rSO2 accurately discriminated whether CPP was above or below the LLA. HI injury did not reduce the accuracy of these indices. In contrast, COH alone and gain were poor indicators of autoregulation and vasoreactivity. Candidate indices for clinical HIE autoregulation studies include phase and COR between MAP and HbT or rSO2.
Supplementary Material
Acknowledgements.
We thank Claire Levine for her editorial assistance.
Funding. This work was supported by the National Institutes of Health, Bethesda, MD, USA [grant numbers K08NS080984 (JKL), R01NS107417 (JKL), and R01NS060703 (RCK),], the American Heart Association Grant in Aid (ANM, RBG, and JKL), and the American Heart Association Transformational Project Award (JKL).
Footnotes
Statement of Ethics. Animal experiments conformed to internationally accepted standards and were approved by the Johns Hopkins University Animal Care and Use Committee.
Disclosures. Some methods used to measure and monitor autoregulation as described in this manuscript were patented by The Johns Hopkins University, listing KB as co-inventor. These patents are exclusively licensed to Medtronic Inc. and KB received a portion of the licensing fee. JKL received research support from Medtronic for a separate study. JKL was also a paid advisory board member for Medtronic. This arrangement has been reviewed and approved by the Johns Hopkins University in accordance with its conflict of interest policies. Medtronic had no role in the current study’s design, data collection and analysis, interpretation of the results, writing, or decision to submit our manuscript for publication.
References
- 1.Massaro AN, Govindan RB, Vezina G, et al. Impaired cerebral autoregulation and brain injury in newborns with hypoxic-ischemic encephalopathy treated with hypothermia. J Neurophysiol. 2015; 114:818–824. [DOI] [PMC free article] [PubMed] [Google Scholar]
- 2.Tekes A, Poretti A, Scheurkogel MM, et al. Apparent diffusion coefficient scalars correlate with near-infrared spectroscopy markers of cerebrovascular autoregulation in neonates cooled for perinatal hypoxic-ischemic injury. AJNR Am J Neuroradiol. 2015; 36:188–193. [DOI] [PMC free article] [PubMed] [Google Scholar]
- 3.Burton VJ, Gerner G, Cristofalo E, et al. A pilot cohort study of cerebral autoregulation and 2-year neurodevelopmental outcomes in neonates with hypoxic-ischemic encephalopathy who received therapeutic hypothermia. BMC Neurol. 2015; 15:209–015-0464–4. [DOI] [PMC free article] [PubMed] [Google Scholar]
- 4.Lee JK, Poretti A, Perin J, et al. Optimizing cerebral autoregulation may decrease neonatal regional hypoxic-ischemic brain injury. Dev Neurosci. 2017; 39:248–256. [DOI] [PMC free article] [PubMed] [Google Scholar]
- 5.Tian F, Tarumi T, Liu H, Zhang R, Chalak L. Wavelet coherence analysis of dynamic cerebral autoregulation in neonatal hypoxic-ischemic encephalopathy. Neuroimage Clin. 2016; 11:124–132. [DOI] [PMC free article] [PubMed] [Google Scholar]
- 6.Lee JK, Kibler KK, Benni PB, et al. Cerebrovascular reactivity measured by near-infrared spectroscopy. Stroke. 2009; 40:1820–1826. [DOI] [PubMed] [Google Scholar]
- 7.Edwards AD, Wyatt JS, Richardson C, Delpy DT, Cope M, Reynolds EO. Cotside measurement of cerebral blood flow in ill newborn infants by near infrared spectroscopy. Lancet. 1988; 2:770–771. [DOI] [PubMed] [Google Scholar]
- 8.Soul JS, du Plessis AJ. New technologies in pediatric neurology. near-infrared spectroscopy. Semin Pediatr Neurol. 1999; 6:101–110. [DOI] [PubMed] [Google Scholar]
- 9.Lee JK, Yang ZJ, Wang B, et al. Noninvasive autoregulation monitoring in a swine model of pediatric cardiac arrest. Anesth Analg. 2012; 114:825–836. [DOI] [PMC free article] [PubMed] [Google Scholar]
- 10.Larson AC, Jamrogowicz JL, Kulikowicz E, et al. Cerebrovascular autoregulation after rewarming from hypothermia in a neonatal swine model of asphyxic brain injury. J Appl Physiol (1985). 2013; 115:1433–1442. [DOI] [PMC free article] [PubMed] [Google Scholar]
- 11.Lee JK, Brady KM, Mytar JO, et al. Cerebral blood flow and cerebrovascular autoregulation in a swine model of pediatric cardiac arrest and hypothermia. Crit Care Med. 2011; 39:2337–2345. [DOI] [PMC free article] [PubMed] [Google Scholar]
- 12.Tsuji M, duPlessis A, Taylor G, Crocker R, Volpe JJ. Near infrared spectroscopy detects cerebral ischemia during hypotension in piglets. Pediatr Res. 1998; 44:591–595. [DOI] [PubMed] [Google Scholar]
- 13.Soul JS, Hammer PE, Tsuji M, et al. Fluctuating pressure-passivity is common in the cerebral circulation of sick premature infants. Pediatr Res. 2007; 61:467–473. [DOI] [PubMed] [Google Scholar]
- 14.O’Leary H, Gregas MC, Limperopoulos C, et al. Elevated cerebral pressure passivity is associated with prematurity-related intracranial hemorrhage. Pediatrics. 2009; 124:302–309. [DOI] [PMC free article] [PubMed] [Google Scholar]
- 15.Brady KM, Lee JK, Kibler KK, et al. Continuous time-domain analysis of cerebrovascular autoregulation using near-infrared spectroscopy. Stroke. 2007; 38:2818–2825. [DOI] [PMC free article] [PubMed] [Google Scholar]
- 16.Santos PT, O’Brien CE, Chen MW, et al. Proteasome biology is compromised in white matter after asphyxic cardiac arrest in neonatal piglets < 10.1161/JAHA.118.009415>. 2018. [DOI] [PMC free article] [PubMed]
- 17.Bisschops LL, Hoedemaekers CW, Mollnes TE, van der Hoeven JG. Rewarming after hypothermia after cardiac arrest shifts the inflammatory balance. Crit Care Med. 2011; . [DOI] [PubMed] [Google Scholar]
- 18.Wang B, Armstrong JS, Reyes M, et al. White matter apoptosis is increased by delayed hypothermia and rewarming in a neonatal piglet model of hypoxic ischemic encephalopathy. Neuroscience. 2016; 316:296–310. [DOI] [PMC free article] [PubMed] [Google Scholar]
- 19.O’Brien CE, Santos PT, Kulikowicz E, et al. Hypoxia-ischemia and hypothermia independently and interactively affect neuronal pathology in neonatal piglets with short-term recovery. Dev Neurosci. 2019; In Press. [DOI] [PMC free article] [PubMed] [Google Scholar]
- 20.Easley RB, Jennings J, Kibler K, Brady KM, Serratos B, Andropoulos DB, Brunetti M, Heitmiller E, Lee JK, Smith M, Dulloor P, Marino BS, Spaeth J, Everett AD. Cerebrovascular Autoregulation Impairment is Associated with Elevations in Plasma Glial Fibrillary Acidic Protein during Congenital Heart Surgery (Abstracts from the American Heart Association’s Emerging Science Series, April 25, 2012). Circulation. 2012; :3. [Google Scholar]
- 21.Soehle M, Chatfield DA, Czosnyka M, Kirkpatrick PJ. Predictive value of initial clinical status, intracranial pressure and transcranial doppler pulsatility after subarachnoid haemorrhage. Acta Neurochir (Wien). 2007; 149:575–583. [DOI] [PubMed] [Google Scholar]
- 22.Zeiler FA, Cardim D, Donnelly J, Menon DK, Czosnyka M, Smielewski P. Transcranial doppler systolic flow index and ICP-derived cerebrovascular reactivity indices in traumatic brain injury. J Neurotrauma. 2018; 35:314–322. [DOI] [PubMed] [Google Scholar]
- 23.Aries MJ, Czosnyka M, Budohoski KP, et al. Continuous monitoring of cerebrovascular reactivity using pulse waveform of intracranial pressure. Neurocrit Care. 2012; 17:67–76. [DOI] [PubMed] [Google Scholar]
- 24.Brady KM, Shaffner DH, Lee JK, et al. Continuous monitoring of cerebrovascular pressure reactivity after traumatic brain injury in children. Pediatrics. 2009; 124:e1205–12. [DOI] [PubMed] [Google Scholar]
- 25.Fraser CD 3rd, Brady KM, Rhee CJ, et al. The frequency response of cerebral autoregulation. J Appl Physiol (1985). 2013; 115:52–56. [DOI] [PubMed] [Google Scholar]
- 26.Brady K, Joshi B, Zweifel C, et al. Real-time continuous monitoring of cerebral blood flow autoregulation using near-infrared spectroscopy in patients undergoing cardiopulmonary bypass. Stroke. 2010; 41:1951–1956. [DOI] [PMC free article] [PubMed] [Google Scholar]
- 27.Barbieri R, Triedman JK, Saul JP. Heart rate control and mechanical cardiopulmonary coupling to assess central volume: A systems analysis. Am J Physiol Regul Integr Comp Physiol. 2002; 283:R1210–20. [DOI] [PubMed] [Google Scholar]
- 28.Halliday DM, Rosenberg JR, Amjad AM, Breeze P, Conway BA, Farmer SF. A framework for the analysis of mixed time series/point process data--theory and application to the study of physiological tremor, single motor unit discharges and electromyograms. Prog Biophys Mol Biol. 1995; 64:237–278. [DOI] [PubMed] [Google Scholar]
- 29.Timmer J, Lauk M, Pfleger W, Deuschl G. Cross-spectral analysis of physiological tremor and muscle activity. I. theory and application to unsynchronized electromyogram. Biol Cybern. 1998; 78:349–357. [DOI] [PubMed] [Google Scholar]
- 30.Kay SM. Modern Spectral Estimation: Theory and Application. New Jersey: Prentice Hall, 1998. [Google Scholar]
- 31.Wyller VB, Barbieri R, Saul JP. Blood pressure variability and closed-loop baroreflex assessment in adolescent chronic fatigue syndrome during supine rest and orthostatic stress. Eur J Appl Physiol. 2011; 111:497–507. [DOI] [PMC free article] [PubMed] [Google Scholar]
- 32.Akaike H A new look at the statistical model identification. IEEE transactions on automatic control. 1974; 19:716–723. [Google Scholar]
- 33.Kay SM. Modern Spectral Estimation Theory and Application. New Jersey: Prentice Hall, 1998. [Google Scholar]
- 34.Liu X, Czosnyka M, Donnelly J, et al. Wavelet pressure reactivity index: A validation study. J Physiol. 2018; 596:2797–2809. [DOI] [PMC free article] [PubMed] [Google Scholar]
- 35.DiCiccio TJ, Efron B. Bootstrap confidence intervals . Statistical Science. 1996; 11:189–228. [Google Scholar]
- 36.Hall P, Wilson SR. Two guidelines for bootstrap hypothesis testing. Biometrics. 1991; :757–762. [Google Scholar]
- 37.Mandrekar JN. Receiver operating characteristic curve in diagnostic test assessment. Journal of Thoracic Oncology. 2010; 5:1315–1316. [DOI] [PubMed] [Google Scholar]
- 38.Benjamini Y, Hochberg Y. Controlling the false discovery rate: A practical and powerful approach to multiple testing. J Roy Statist Soc Ser B. 1995; 57:289−−300. [Google Scholar]
- 39.Hahn GH, Heiring C, Pryds O, Greisen G. Applicability of near-infrared spectroscopy to measure cerebral autoregulation noninvasively in neonates: A validation study in piglets. Pediatr Res. 2011; 70:166–170. [DOI] [PubMed] [Google Scholar]
- 40.Eriksen VR, Hahn GH, Greisen G. Cerebral autoregulation in the preterm newborn using near-infrared spectroscopy: A comparison of time-domain and frequency-domain analyses. J Biomed Opt. 2015; 20:037009. [DOI] [PubMed] [Google Scholar]
- 41.Joshi B, Brady K, Lee J, et al. Impaired autoregulation of cerebral blood flow during rewarming from hypothermic cardiopulmonary bypass and its potential association with stroke. Anesth Analg. 2010; 110:321–328. [DOI] [PMC free article] [PubMed] [Google Scholar]
- 42.Lavinio A, Timofeev I, Nortje J, et al. Cerebrovascular reactivity during hypothermia and rewarming. Br J Anaesth. 2007; 99:237–244. [DOI] [PubMed] [Google Scholar]
- 43.Ueda Y, Suehiro E, Wei EP, Kontos HA, Povlishock JT. Uncomplicated rapid posthypothermic rewarming alters cerebrovascular responsiveness. Stroke. 2004; 35:601–606. [DOI] [PubMed] [Google Scholar]
- 44.Howlett JA, Northington FJ, Gilmore MM, et al. Cerebrovascular autoregulation and neurologic injury in neonatal hypoxic-ischemic encephalopathy. Pediatr Res. 2013; 74:525–535. [DOI] [PMC free article] [PubMed] [Google Scholar]
- 45.Aksenov D, Eassa JE, Lakhoo J, Wyrwicz A, Linsenmeier RA. Effect of isoflurane on brain tissue oxygen tension and cerebral autoregulation in rabbits. Neurosci Lett. 2012; 524:116–118. [DOI] [PubMed] [Google Scholar]
- 46.Chalak LF, Zhang R. New wavelet neurovascular bundle for bedside evaluation of cerebral autoregulation and neurovascular coupling in newborns with hypoxic- ischemic encephalopathy. Dev Neurosci. 2017; 39:89–96. [DOI] [PMC free article] [PubMed] [Google Scholar]
Associated Data
This section collects any data citations, data availability statements, or supplementary materials included in this article.