Abstract
There is intense clinical interest in the potential effects of platelet-rich plasma (PRP) for the treatment of osteoarthritis (OA). This study tested the hypotheses that (1) ‘lower’ levels of the inflammatory mediators (IM) interleukin-1-beta (IL-1β) and tumor-necrosis-factor-alpha (TNF-α), and (2) ‘higher’ levels of the growth factors (GF) insulin-like-growth-factor-1 and transforming-growth-factor-beta-1 within leukocyte-poor PRP correlate with more favorable chondrocyte and macrophage responses in vitro. Samples were collected from ten ‘healthy’ young male (23–33 years old) human subjects (H-PRP) and nine older (62–85 years old) male patients with severe knee OA (OA-PRP). The samples were separated into groups of ‘high’ or ‘low’ levels of IM and GF based on multiplex cytokine and ELISA data. Three-dimensional (3D) alginate bead chondrocyte cultures and monocyte-derived macrophage cultures were treated with 10% PRP from donors in different groups. Gene expression was analyzed by qPCR. Contrary to our hypotheses, the effect of PRP on chondrocytes and macrophages was mainly influenced by the age and disease status of the PRP donor as opposed to the IM or GF groupings. While H-PRP showed similar effects on expression of chondrogenic markers (Col2a1 and Sox9) as the negative control group (p>0.05), OA-PRP decreased chondrocyte expression of Col2a1 and Sox-9 mRNA by 40% and 30%, respectively (Col2a1, p=0.015; Sox9, p=0.037). OA-PRP also upregulated TNF-α and MMP-9 (p<0.001) gene expression in macrophages while H-PRP did not. This data suggests that PRP from older individuals with OA contain factors that may suppress chondrocyte matrix synthesis and promote macrophage inflammation in vitro.
Keywords: Platelet Rich Plasma, Osteoarthritis, Aging, Cartilage Metabolism, Macrophage Activation
Introduction:
Osteoarthritis (OA) is a leading cause of disability. The pathophysiology of OA is a complex, multi-factorial process that involves the interplay between mechanics, biology, and structure1. Biological factors are thought to include increasing chondrocyte insensitivity to anabolic signals and an increasingly inflammatory joint milieu2,3. The mainstay of treatment in OA has long included anti-inflammatory therapy for symptomatic relief until end-stage joint destruction which can be treated with joint replacement. In recent years, clinical reports suggest a positive effect of platelet-rich plasma (PRP) injections on patient reported outcomes (PRO) for the treatment of knee OA2,4. While mechanisms of action remain unknown, it has been suggested that PRP may dampen inflammation and stimulate a regenerative response2 leading patients to seek treatment in hopes of staving off joint replacement5.
PRP contains a mixture of growth factors (GF), cytokines and other proteins. Recent studies show high variability in the levels of growth factors and inflammatory mediators between males and females, between different individuals, and between samples from the same individual depending on timing and method of preparation6,7,8. The multiple sources of variability in PRP composition substantially complicate understanding mechanisms of action and evaluation of clinical effectiveness9,10,11.
Several randomized controlled trials (RCT) comparing PRP to hyaluronic acid (HA) or placebo show mixed results12,13,14,15. Meta-analyses of recent studies suggest that leukocyte poor PRP may be more effective than HA in improving patient reported outcomes, but there were differences in response due to disease state15. The differences in response have been attributed to age13,14, to the OA disease state of the patient4,12,14, as well as to the concentration of platelets and leukocytes within the PRP13,14,16,17. There has been limited information on whether differences in the concentration of GF and cytokines within PRP prepared from different individuals affect chondrocyte and macrophage metabolism in vitro6.
This study was performed to evaluate the effects of cytokine and growth factor concentrations in PRP on chondrocyte and macrophage responses in vitro. Specifically, we aimed to determine whether the concentration of inflammatory factors (IM) such as interleukin (IL)-1-beta (IL-1β) and tumor-necrosis-factor-alpha (TNF-α), and GF such as insulin-like growth factor (IGF-1) and transforming growth factor-beta (TGF-β1) in leukocyte-poor PRP affects the response of cartilage (chondrocytes) and inflammatory (macrophages) cells in vitro. We hypothesized that ‘lower’ levels of IM and/ or ‘higher’ levels of GF within PRP would correlate with positive cellular responses of increased chondrocyte matrix synthesis and lower macrophage inflammatory responses. Furthermore, we hypothesized that the in vitro cellular responses would be independent of the age and knee OA status of the PRP donors.
Methods:
Human Subject Recruitment and Sample Collection
The protocols, policies and human sample collection methods were approved by the Stanford University Institutional Review Board (IRB-31943, 27369, and IRB-3780), and informed consent was obtained from all participants. Peripheral blood samples were obtained from 10 young (23–33 years old) and healthy male volunteers who denied history of knee pain or significant knee injury requiring crutches or surgery. Nine older (62–85 years old) males with end-stage knee OA had blood samples collected prior to knee arthroplasty. Leukocyte depleted PRP was prepared from all blood samples using the same standardized double-spin protocol18,19. This protocol consisted of 1 ‘hard spin’ for 10 minutes at 1000 rpm followed by a ‘soft spin’ for 9 mins at 800 rpm. After the ‘hard spin’ the plasma layer was collected from above the buffy coat layer. The leukocyte poor plasma was then concentrated with the ‘soft spin’ and the top two-thirds was discarded while the bottom one-third of the samples was collected as the final PRP. The resulting PRP was concentrated to a platelet count ranging from 1.65 × 10^6/ml to 3.10 × 10^6/ml. An aliquot of each sample was inspected by microscopy and no white blood cells were visualized in any of the samples. All samples were aliquoted and frozen within one hour of collection.
Quantification of Growth Factors and Cytokines in PRP samples
The cytokine and growth factor levels in the PRP samples were analyzed using the Bio-Plex Pro Human Cytokine 27-Plex Immunoassay (Bio-Rad, USA). The concentrations of IGF-1 and TGF-β1 were quantified using enzyme-linked immunosorbent assay (ELISA) kits (R&D System, Minneapolis, MN, USA). All measurements were done at the same time with each sample undergoing one freeze-thaw cycle.
Chondrocyte Isolation and Three-Dimensional Alginate Bead Cultures
Grossly intact cartilage collected at the time of total knee replacement surgery from a single patient served as the sole source of chondrocytes for this study. The chondrocytes were isolated from the dissected tissue by plating for 24 hours at 37° C with Collagenase type 2 and type 4 solution at 1 mg/ml (Worthington Chemicals, Lakewood NJ, USA) in chondrocyte growth medium (DMEM/F12 nutrient mix supplemented with 10% fetal bovine serum and 1% penicillin-streptomycin, Gibco/Invitrogen, USA). The resulting chondrocytes were filtered through a 70-micron filter and centrifuged at 450g for 15 minutes, to separate the enzymatic solution, and washed twice with PBS (Gibco). Cells were cultured in 10 cm tissue culture dishes in chondrocytes growth medium until near confluency. Three-dimensional (3D) alginate beads cultures were performed as previously described 20,21,22. Briefly, chondrocytes were collected after treatment of the cultures with trypsin solution (Gibco/Invitrogen USA), counted and re-suspended in a pre-warmed 0.15M NaCl solution to achieve a concentration of 400k cells per ml. An equal volume of 1.2% alginate solution was added to the cells and gently mixed. Chondrocytes in the resulting solution were aspirated into a syringe and released dropwise into a pre-cooled 12-well plate with 1ml of cold 102mM calcium chloride solution, maintained under gentle stirring by a shaker. With this experimental procedure, two 12-well plates with 20 3-dimensional (3D) alginate beads per well were prepared (~20,000 cells/bead, ~400,000 cells/ well). The beads were washed with PBS to remove the calcium solution, and cultured in chondrocyte growth media at 37° C for 14 days to allow acclimation to the culture environment23.
Experimental PRP Treatment on 3D Healthy Human Chondrocytes
The chondrocytes encapsulated in 3D alginate beads were then treated twice with either 10% PRP, chondrocyte growth medium (negative control) or growth medium supplemented with 10ng/ml of recombinant human TGF-β1 factor (R&D System, Minneapolis, MN, USA) as a positive control. The first treatment was done after 14 days of culture. At 48 hours after the first PRP treatment, supernatants from each well were collected and a second PRP treatment was performed. Supernatants and cells from all cultures were collected 48 hours later (96 hours after the first PRP treatment). Chondrocytes were recovered from alginate beads as previously described18 and mRNA was collected (RNAeasy Micro Kit protocol, Qiagen, Hilden, Germany). The concentration of the mRNA samples was quantified by spectrophotometery (NanoDrop).
PBMC Isolation and Monocyte-derived Macrophages Cultures
To study the immunological effects after PRP treatment, peripheral blood monocytes (PBMC) isolated from a single healthy young male (<35 years old) donor was performed using the Ficoll-Paque density gradient media protocol (GE Healthcare Life Science, Pittsburgh, USA). Mononuclear cells were washed twice in DPBS 1X (Gibco/Invitrogen) to eliminate the gradient and plated in 10cm dishes with RPMI-1640 1X medium (Hyclone/ GE Healthcare Life Science, Pittsburgh, USA), supplemented with 10% fetal bovine serum and 1% penicillin-streptomycin (Gibco/Invitrogen). One day later, medium was changed with complete RPMI-1640 1X medium supplemented with 30ng/ml of recombinant human Macrophage Colony Stimulating Factor (M-CSF) (PeproTech, Rocky Hill NJ, USA). Medium was changed every two days with fresh M-CSF medium for 7 days to differentiate macrophages. On Day 5, trypsin was used to separate the macrophages for counting and plating into 6-well plates, with 250k cells/well. On day 7 (2 days after plating into 6-well plates), monocyte-derived macrophages were treated with serum free 10% PRP medium, serum free complete RPMI medium (negative control) and serum free complete RPMI medium supplemented with 50ng/ml lipopolysaccharide (LPS, Sigma Aldrich) as a positive control. After 24 hours, supernatants were collected, while cells were washed with DPBS. mRNA was recovered directly from the wells using 350μl of RLT lysis buffer per well (RNAeasy Micro Kit protocol, Qiagen, Hilden, Germany). The concentration of the mRNA samples was quantified by NanoDrop, then samples were stored at −80°C.
Quantitative PCR
The changes in gene expression following PRP treatment for both the human chondrocyte cultures and monocyte-derived macrophage cultures were analyzed by quantitative PCR (qPCR). mRNA was isolated using the RNAeasy Micro Kit protocol (Qiagen, Hilden, Germany). cDNA was constructed using the High Capacity cDNA Reverse Transcription Kit (Applied Biosystems, USA). Quantitative PCR was performed with the Taqman PreAmp Master Mix Kit (Applied Biosystems, USA) to detect gene expression changes between PRP treatments, treatment with normal chondrocyte medium (negative control) and treatment with recombinant TGF-β1(positive control). Primers for COL1A1, COL2A1, COL10, SOX9, Aggrecan, and MMP’s 1, 3, 9, and 13 were used for the chondrocyte samples, while TNF-α, IL-1β, MMP- 1, 3, 9, and 13 were used to analyze the monocyte-derived macrophage cultures.
Statistical Analysis
Descriptive statistics are presented as means and standard deviations. The qPCR, ELISA, and Luminex cytokine and growth factor panel data were evaluated using two-sample t-tests with unequal variance. The two-sided level of significance was α = 0.05 and all analyses were performed with GraphPad Prism version 6.0h (GraphPad Software, La Jolla, CA). The overall mean value (for all samples) for each individual molecule in the Luminex panel was calculated, and the Z-score, indicating the number of standard deviations above (positive values) or below (negative values) the mean was calculated for each sample. These data were visualized via a heat map with a standard color scheme to represent differences in gene expression (Figure 1). Relative gene expression for all qPCR samples were determined using 2^-dCT and the standard deviation from the mean was calculated via Prism.
Figure 1:
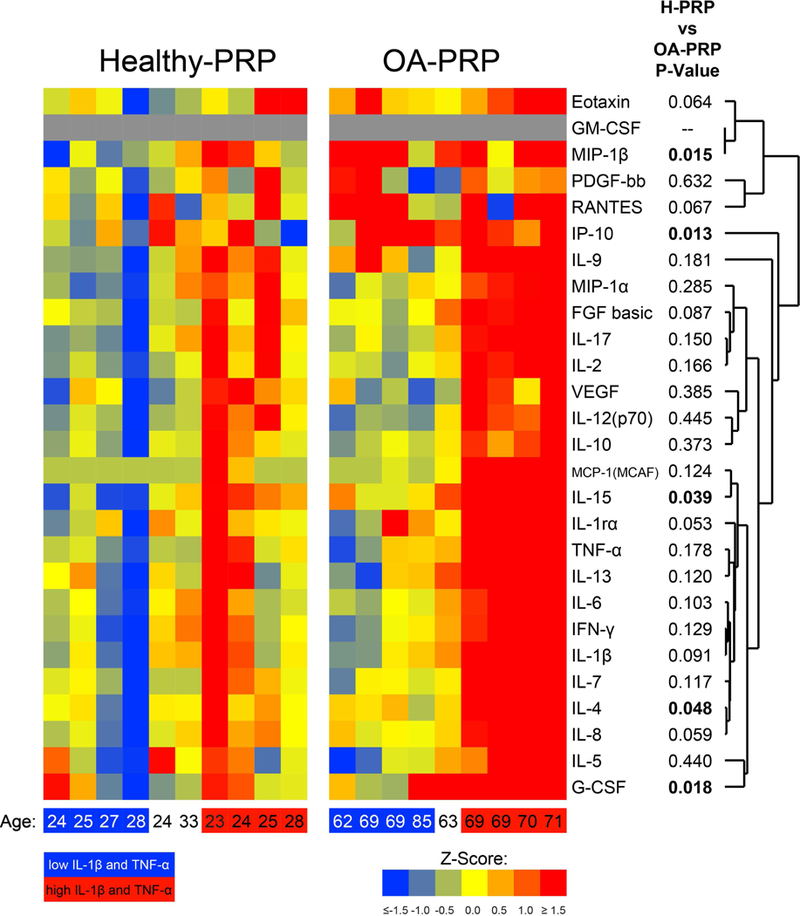
Heatmap of cytokine and growth factor profiles within PRP samples, measured by Luminex panel. The Z-score indicates the number of standard deviations above (positive values) or below (negative values) the overall mean (of all samples healthy and OA combined), with with blue-green shades representing decreased values from the mean and orange-red hues indicating higher values. The samples are grouped according the ‘low’ and ‘high’ inflammatory mediator groups, which are represented on the bottom axis by the blue square= ‘low’ IM group, red square= ‘high’ IM group. Age of patient represented in years old.
Results:
Characteristics of PRP
In this study, the composition of PRP (Figure 1) showed individual variation within both the ‘healthy’ (H-PRP) and the OA (OA-PRP) cohorts.
Cytokine Levels.
Analyses showed that PRP from the OA cohort had higher levels of the cytokines IL-15, IP-10, MIP-1b, GCSF, and IL-4 (p<0.050, Figure 1 and Table 1) than that of the healthy cohort. Several other cytokines such as IL-8, IL-1β, IL-1 receptor antagonist protein (IRAP), fibroblast growth factor (FGF), RANTES and Eotaxin trended higher in OA-PRP (p<0.100, Figure 1 and Table 1) than H-PRP. The anti-inflammatory ratio of IRAP to IL-1β was similar between cohorts (OA-PRP: 12.4 versus H-PRP: 12.2; p=0.960, Table 1).
Table 1:
Mean and standard deviation of cytokine and growth factor levels within PRP samples as measured by Luminex panel in pg/ml, plus and minus the standard deviation.
| H-PRP (pg/ml) | OA-PRP (pg/ml) | p-value | |
|---|---|---|---|
| IP-10 | 317.9 ± 88.9 | 582.4 ± 249.8 | 0.013* |
| MIP-1β | 54.7 ± 15.8 | 92.7 ± 36.7 | 0.015* |
| G-CSF | 46.0 ± 10.0 | 62.7 ± 16.1 | 0.018* |
| IL-15 | 1.7 ± 1.3 | 4.8 ± 3.7 | 0.039* |
| IL-4 | 5.1 ± 1.0 | 6.3 ± 1.4 | 0.048* |
| IL-8 | 23.9 ± 6.4 | 31.8 ± 9.8 | 0.059 |
| Eotaxin | 54.9 ± 15.3 | 82.9 ± 37.9 | 0.064 |
| Rantes | 7888.7 ± 990.6 | 9195.8 ± 1712.4 | 0.067 |
| FGF | 16.9 ± 9.0 | 25.1 ± 10.5 | 0.087 |
| IL-6 | 16.5 ± 5.1 | 21.8 ± 7.7 | 0.103 |
| TNF-α | 58.8 ± 15.7 | 70.7 ± 20.3 | 0.178 |
| IRAP | 78.5 ± 18.2 | 102.5 ± 29.2 | 0.053 |
| IL-1β | 6.4 ± 1.7 | 8.5 ± 2.8 | 0.091 |
| IRAP/IL-1β | 12.2 ± 2.1 | 12.4 ± 2.2 | 0.960 |
H-PRP: n=10, OA-PRP: n=9. IP-10= Interferon gamma-induced protein 10; MIP-1β= Macrophage inflammatory protein-1β; G-CSF= Granulocyte- colony stimulating factor; IL= Interleukin; Rantes= CCL5; FGF= Fibroblast growth factor; TNF-α= Tumor necrosis factor- alpha; IRAP= IL-1 receptor antagonist protein.
P-value: <0.05.
Growth Factor Levels.
Analyses showed increased levels of anabolic growth factors in H-PRP compared to that of OA-PRP (Figure 2). The mean IGF-1 concentration in the H-PRP cohort was considerably higher than that of the OA-PRP cohort (129.2 ng/ml vs 86.9 ng/ml, respectively, p=0.004). The mean TGF-β1 concentration was higher in the H-PRP cohort than that of the OA-PRP cohort (120.3 ng/ml versus 81.7 ng/m, respectively, p=0.021).
Figure 2:
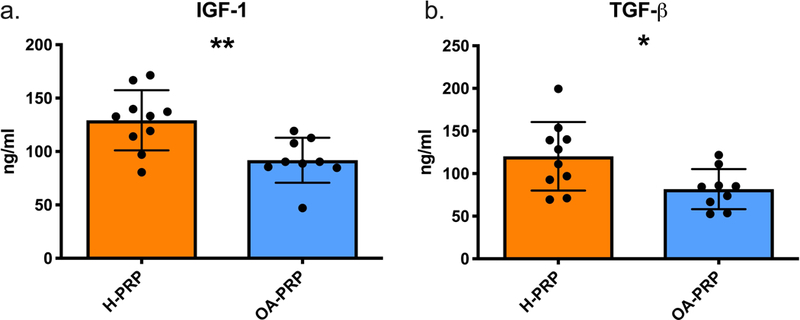
Growth factor levels in PRP measured by ELISA. H-PRP: n=10, OA-PRP: n=9. Error bars indicating standard deviation. (a.) IGF-1 concentration: p= 0.004. (b.) TGF-β concentration: p= 0.021.
Platelet Concentration.
Significant differences were noted between the mean platelet concentration of the H-PRP and OA-PRP (Figure 3a). The mean platelet concentration in the OA-PRP was less than the H-PRP (1.82 × 10^6/ml versus 2.25 × 10^6/ml, p=0.047).
Figure 3:
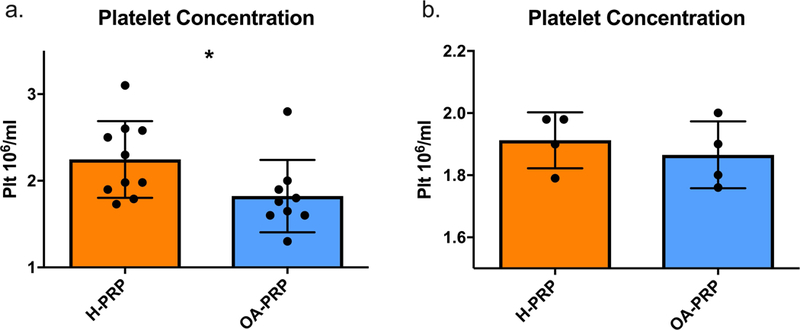
Platelet concentrations in PRP. (a.) Plt = Platelet, H-PRP = ‘Healthy’ PRP samples (n=10), OA-PRP = Osteoarthritic PRP samples (n=9). P-value for H-PRP versus OA-PRP: p=0.047. (b.) Grouping by similar platelet concentration to control for disease and age related differences: H-PRP (n=4), OA-PRP (n=4), p=0.524.
Chondrocyte Responses to PRP
The chondrocytes showed differential responses to H-PRP and OA-PRP in several respects (p<0.050, Figure 3). For matrix synthesis, both H-PRP (p<0.001, Figure 4) and OA-PRP (p=0.036, Figure 4a) upregulated Col1a1 above that of the negative control. However, H-PRP increased Col1a1 gene expression ten-fold above that of the negative control, which was significantly greater than the four-fold increase observed after administration of OA-PRP (p=0.002). Administration of H-PRP resulted in similar Col2a1 and Sox-9 gene expression compared to the negative control (p>0.050, Figure 4b). In contrast, OA-PRP decreased Col2a1 mRNA by 40% and Sox-9 mRNA by 30% compared to that of the serum free negative control (Col2a1, p=0.015; Sox9, p=0.037, Figure 4b and 4c). Stimulation with the positive control, TGF-β, caused a significantly greater upregulation of all matrix genes measured than the H-PRP and OA-PRP (Relative Expression: Col1a1, 16.66; Col2a1, 20.38; Sox9, 2.08; ACAN, 2.84).
Figure 4:
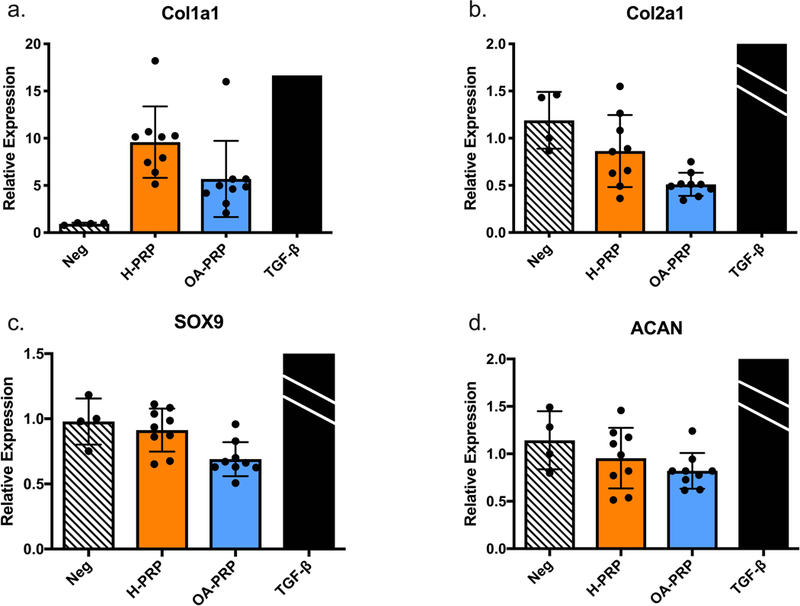
Chondrocyte response to PRP treatment, grouped by disease status, and measured by qPCR. ACAN= Aggrecan, Neg = Negative control; H-PRP: n=10, OA-PRP: n=9. TGF-β, positive control, mean relative expression: Col1a1, 16.66; Col2a1, 20.38; Sox9, 2.08; ACAN, 2.84. TGF-β bars for Figures 4b, c, and d were cropped due to the substantially higher relative expression.Error bars indicate standard deviation. P-values versus Negative control: *<0.05, ***<0.001.
Both H-PRP and OA-PRP increased MMP gene expression levels above that of the negative control (p<0.001, Figure 5), with H-PRP increasing MMP-1, −9, and −13 more than OA-PRP (p<0.001). H-PRP stimulation of chondrocytes upregulated MMP-9 gene expression 59-fold from the negative control, which was more than double the 21-fold increase of MMP-9 with OA-PRP. H-PRP similarly increased MMP-1 gene expression by 36.5-fold and MMP-13 by 48.6-fold above that of the negative control, where OA-PRP increased MMP-1 by 18.3-fold and MMP-13 by 22.4-fold above that of the negative control. MMP-3 had a more modest increase from that of the negative control, with H-PRP increasing expression 2.7-fold (p<0.001, Figure 5b) and OA-PRP increasing expression 2.4-fold (p=0.004, Figure 5b). The increase in MMP-3 was similar between the two cohorts (p=0.368, Figure 5b).
Figure 5:
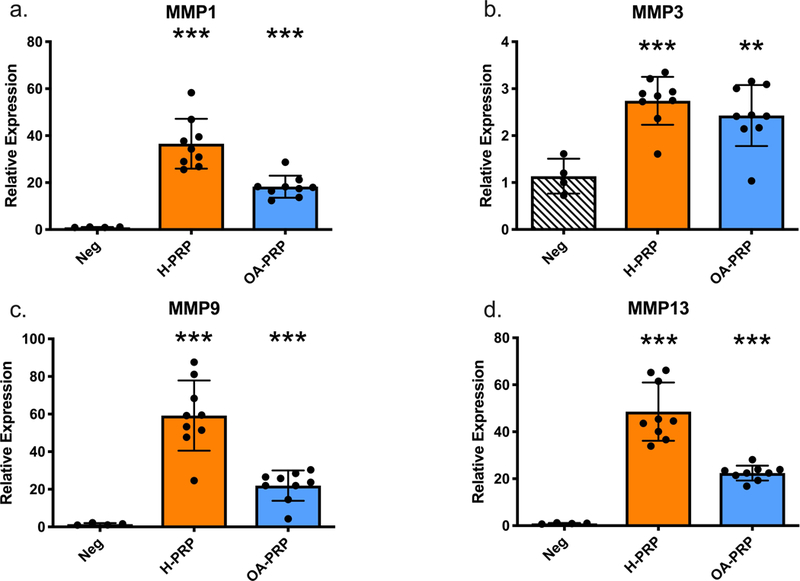
Matrix Metallopeptidase (MMP) expression changes due to PRP treatment on chondrocytes, grouped by disease status and measured by qPCR. H-PRP: n=10, OA-PRP: n=9. Error bars indicate standard deviation. P-values versus Negative control: **<0.01, ***<0.001.
Macrophage Response to PRP
When analyzing the effects of PRP on macrophage activation, treatment with OA-PRP was found to upregulate TNF-α (p<0.001) and MMP-9 (p<0.001) compared to treatment with H-PRP (Figure 6). TNF-α was increased by 3-fold in OA-PRP compared to that of the negative control (p<0.001, Figure 6a). The major MMP secreted by macrophages, MMP-9, was increased by 8-fold in OA-PRP compared to that of the negative control (p<0.001, Figure 6b). IL-1β gene expression was not significantly changed from that of the baseline negative control (p>0.050) following administration of either H-PRP or OA-PRP.
Figure 6:
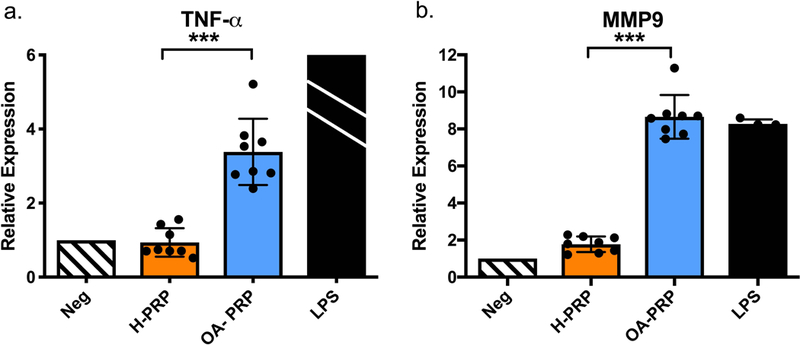
Macrophage gene expression changes due to PRP stimulation, measured by qPCR. H-PRP: n=10, OA-PRP: n=9; LPS = lipopolysaccharide. The mean relative expression of TNF-a due to LPS was 98.13 with a standard deviation of +/− 34.6, the LPS bar was cropped due to the substantially higher relative expression of LPS. Error bars indicate standard deviation. P-values for OA-PRP versus H-PRP: ***<0.001.
PRP Effects Based on Cytokine Grouping
Due to the striking difference in the response of chondrocytes and macrophages between OA-PRP and H-PRP, as well as the large variation of PRP composition within those groups (Figure 1), we sought to determine whether IM and GF grouping could be used to predict cellular response.
High and Low Inflammatory Mediator (IM) Groups.
To separate into ‘low’ and ‘high’ inflammatory mediator groups we focused on the major factors mediating inflammation in OA: IL-1β and TNF-α. We used the Z-scores for those cytokines shown in Figure 1 and Table 2, to separate samples into groups of ‘low’ (n=4) and ‘high’ (n=4) IM for each patient cohort, excluding one OA-PRP and two H-PRP samples that were intermediate in IM levels (Figure 1). There was a natural separation into ‘low’ and ‘high’ inflammation groups in the OA-PRP cohort. In the ‘high’ OA-PRP group, IL-1β and TNF-α, were all greater than 2 standard deviations (SD) higher than the ‘low’ OA-PRP group (p<0.050, Table 2). However, in the H-PRP group there was more of a spectrum of IM values (Figure 1). For H-PRP, the ‘low’ and ‘high’ IM groups showed a trend toward differing means for IL-1β (p=0.073) and TNF-α (p=0.065, Table 2).
Table 2:
‘Low’ and ‘High’ inflammatory mediator groups characterized by Z-score, which is calculated as standard deviations from the mean for each cytokine.
| ‘Low’ H-PRP Z-score (n=4) |
‘High’ H-PRP Z-score (n=4) |
p-value |
‘Low’ OA-PRP Z-score (n=4) |
‘High’ OA-PRP Z-score (n=4) |
p-value |
|
|---|---|---|---|---|---|---|
| IL-1β | −0.84 ± 0.78 | 0.63 ± 1.07 | 0.073 | −0.27 ± 0.57 | 2.94 ± 1.13 | 0.005* |
| TNF-α | −0.67 ± 0.51 | 0.89 ± 1.14 | 0.065 | −0.37 ± 0.79 | 2.06 ± 0.62 | 0.003* |
Plus and minus the standard deviation in Z-score. H-PRP = ‘Healthy’ PRP samples, OA-PRP = Osteoarthritic PRP samples.
P-value: <0.050.
Comparison of the cytokine levels of IL-1β and TNF-α between the ‘low’ IM samples of H-PRP and OA-PRP (Figure 7), showed that levels of both IM between the two groups were similar. In contrast, TNF-α levels in the ‘high’ IM OA-PRP group were similar to that of the ‘high’ H-PRP, but IL-1β was higher in the OA cohort (p=0.046, Figure 7b). However, the anti-inflammatory ratio of IRAP/IL-1β was similar between the ‘high’ and ‘low’ IM groups for both the H-PRP and OA-PRP cohorts.
Figure 7:
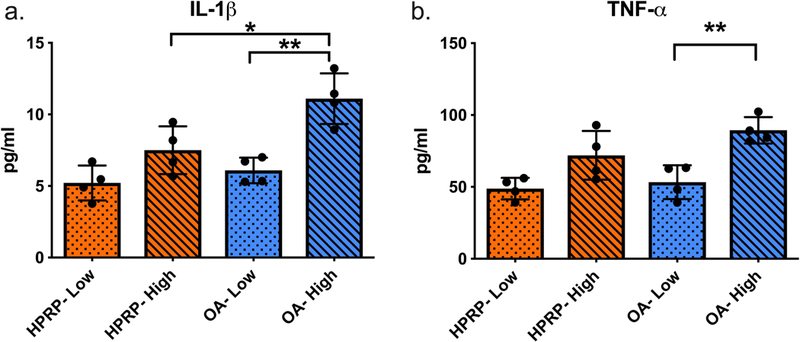
‘Low’ and ‘High’ inflammatory cytokine groups of PRP, quantified from Luminex panel protein concentrations. Low= ‘low’ IM groupings (n=4), High= ‘high’ IM groupings (n=4). Error bars indicate standard deviation. P-values for: OA-High versus HPRP- High *<0.050; OA-Low versus OA-High **<0.010.
High and Low Growth Factor (GF) Groups.
To separate into ‘low’ and ‘high’ GF levels, we focused on the anabolic growth factors: IGF-1 and TGF-β1. We used a similar method as detailed above, to separate samples into groups of ‘low’ (n=4) and ‘high’ (n=4) GF for each patient cohort, excluding one OA-PRP and two H-PRP samples that were intermediate in IGF-1 and TGF-β1 levels. When grouping the PRP by ‘high’ and ‘low’ GF levels, IGF-1 and TGF-β1 were both increased in the ‘high’ GF groups compared to the ‘low’ GF groups for both H-PRP and OA-PRP (p<0.010).
Chondrocyte Response by Growth Factor and Inflammatory Mediator Levels
Although both the H-PRP and OA-PRP ‘high’ GF groups had increased levels of IGF-1 and TGF-β1 compared the ‘low’ GF groups (p<0.010), there was no correlation in reponse of Col1a1 and Col2a1 expression. The chondrocytic MMP response to IM levels, also showed no correlation in gene expression of MMP’s to IM groupings. This sub-analysis demonstrated similar findings as in Figures 4 and 5, where the chondrocyte response to PRP reflected whether it came from a young healthy male or an older male with OA.
Macrophage Response by Inflammatory Mediator Levels
The grouping of H-PRP by inflammatory mediator levels resulted in a minor but statistically significant difference in macrophage activation (Figure 8). Treatment with the ‘low’ IM H-PRP resulted in lower TNF-α expression than treatment with the ‘high’ IM H-PRP (p=0.049, Figure 8a), but not significantly reduced from the negative control. There was no difference in macrophage activation between the ‘low’ IM and ‘high’ IM OA-PRP (p=0.747, Figure 8a) despite significant differences in the measured levels of IL-1β between these two sub-groups (Figure 7a). Both the ‘low’ IM and ‘high’ IM OA sub-groups increased TNF-α expression 3.3 and 3.5-fold respectively (p=0.004, p=0.027), and MMP-9 levels 8.4 and 8.9-fold, respectively (p<0.001, p=0.002), compared to the negative control. Both TNF-α (p=0.002) and MMP-9 (p<0.001) were upregulated in the ‘low’ IM OA-PRP treated samples compared to those treated with the ‘low’ IM H-PRP (Figure 8), even though the concentrations of IM were similar (Figure 7).
Figure 8:
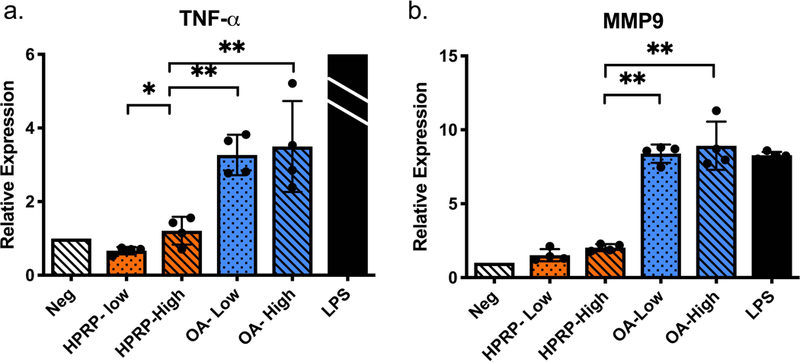
Macrophage gene expression changes due to PRP stimulation, separated by IM groupings, and measured by qPCR. Low= ‘low’ IM grouping (n=4), High= ‘high’ IM grouping (n=4), LPS = lipopolysaccharide (n=4). The mean relative expression of TNF-a due to LPS was 98.13 with a standard deviation of +/− 34.6, the LPS bar was cropped due to the substantially higher relative gene expression. Error bars indicate standard deviation. P-values for HPRP-Low versus HPRP- High *<0.05; the remaining P-values (*<0.05, **<0.01, ***<0.001) indicate versus HPRP- High.
Responses to PRP with Similar Platelet Concentrations
Sub-analysis was performed using four H-PRP and four OA-PRP samples with similar platelet concentrations. The two cohorts overlapped between the platelet concentrations of 1.76 × 10^6/ml and 2.0 × 10^6/ml. For these subgroups, the mean H-PRP platelet concentration was 1.91 × 10^6/ml versus 1.87 × 10^6/ml in the OA-PRP group. The mean platelet concentration between the two subgroups was similar (p=0.524, Figure 3b).
Chondrocyte Response Controlled for Platelet Concentration.
Analyzing the chondrocyte response to PRP treatment with similar platelet concentrations revealed a disease-related response. Again, H-PRP caused a greater upregulation of Col1a1 gene expression compared to OA-PRP (p=0.032, Figure 9a). Col2a1 expression was also significantly reduced with OA-PRP compared to the negative control (p=0.007, Figure 9b). OA-PRP reduced the mean relative expression of SOX-9 by 25% compared to H-PRP (H-PRP: 0.912, OA-PRP: 0.686; p=0.010).
Figure 9:
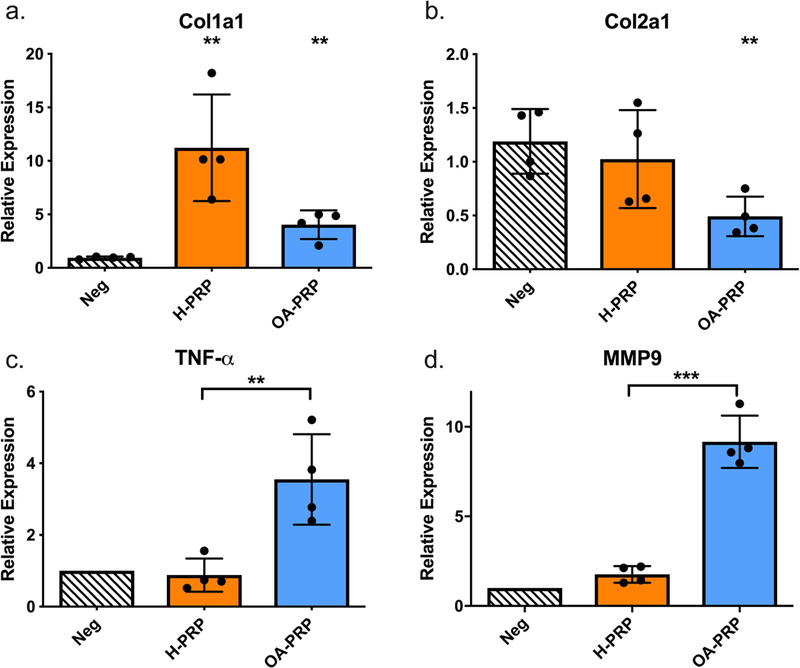
Chondrocytic and macrophage response controlled for PRP treatment with similar platelet concentrations. H-PRP = ‘Healthy’ PRP samples (n=4), OA-PRP = Osteoarthritic PRP samples (n=4). (a.) Chondrocytic response for Col1a1: H-PRP versus OA-PRP, p=0.032; both H-PRP and OA-PRP versus negative control, p=0.006 and 0.004 respectively. (b.) Chondrocytic response for Col2a1 OA-PRP versus negative control, p=0.007. (c.) Macrophage response for TNF-α: H-PRP versus OA-PRP, p=0.018. (d.) Macrophage response for MMP-9: H-PRP versus OA-PRP, p=0.001.
Macrophage Response Controlled for Platelet Concentration.
When analyzing the effects of PRP treatment with similar platelet concentrations on macrophage activation, a consistent upregulation of inflammatory genes was noted with OA-PRP. Treatment with OA-PRP was found to upregulate TNF-α 403% (p=0.018) and MMP-9 520% (p=0.001) compared to treatment with H-PRP (Figure 9).
Discussion:
This study demonstrated significant differences in both the composition of PRP between ‘healthy’ young men and that of older males with knee OA, as well as the responses of chondrocytes and macrophages to treatment with PRP from these two groups. Treatment of 3-D chondrocyte cultures with PRP from older males with knee OA decreased gene expression for the key cartilage matrix protein of type II collagen. Furthermore, OA-PRP resulted in significant upregulation of mRNA for inflammatory proteins in human macrophages, which was not apparent follow treatment with PRP from healthy young males. These data show that patient age and OA disease state influence the bioactivity of PRP and suggest that PRP prepared from older patients with OA may depress chondrocyte matrix synthesis and promote the inflammatory macrophage phenotype.
The study also showed that PRP from older donors with OA not only had increased levels of many different inflammatory cytokines but also contained less growth factors and platelets. Previous studies by Xiong et al, have shown a similar age-related decline in IGF-1 levels and the ratio of growth factors to pro-inflammatory factors within PRP6. Despite there being significant variation within the study cohorts, these data further demonstrated that the interpersonal variation was not as important as the age and disease status of the PRP donor. The PRP from healthy young males increased chondrocytic gene expression of type 1 collagen more than that of older men with OA. While PRP from healthy young males did not change expression of type 2 collagen and Sox-9; PRP from older males with OA decreased chondrocyte production of these two markers of chondrogenesis. The differences in growth factors (IGF-1 and TGF-β1) and inflammatory mediators (IL-1β and TNF-α) between high and low GF and IF groups of the H-PRP and OA-PRP cohorts did not alter these findings suggesting that other proteins within PRP were responsible for these effects.
Exploring the effect of cytokine levels in PRP on stimulating or damping the inflammatory milleu, we observed that neither PRP from healthy donors nor PRP with low inflammatory mediators suppressed macrophage activation. Furthermore, PRP from older donors with OA greatly increased key markers of inflammation. While we noted a minor reduction in TNF-α expression by macrophages that were stimulated with PRP from healthy donors with low levels of IM compared to healthy donors with high levels of IM, neither ‘low’ or ‘high’ IM H-PRP significantly altered TNF-α expression from the negative control. Overall, the PRP from older donors with OA resulted in significant upregulation to TNF-α and MMP-9 mRNA expression in macrophages. This effect was not observed with stimulation by PRP from healthy young donors.
Analysis of the subgroups with similar platelet concentrations showed a similar chondrogenic and inflammatory response to PRP treatment as were noted with subanalsys for similar inflammatory and growth factors. These findings further suggest that the observed cellular responses may be due to other factors related to aging or the OA disease status of the PRP donor than the platelet composition or the measured proteins. Together these data show that PRP from older males with OA suppresses chondrocyte metabolism and incites an inflammatory response in macrophages in vitro.
Our in vitro data provide a potential explanation for the results of recent randomized controlled trials (RCT) suggesting an effect of OA disease status on the efficacy of PRP treatment. An RCT by Cole et al. examining the effect of PRP on altering the inflammatory response in vivo showed a reduction in intra-articular TNF-α and IL-1β at 12-weeks post-treatment4. However, sub-analyses of this data noted the beneficial effect of PRP was mostly in patients with a BMI <24 and mild OA disease (Kellgran and Lewis (KL) grade 1)4. Their study was consistent with another RCT by Filardo et al, that only showed a benefit in PRO from PRP treatment in patients with KL grade 0–2 and not KL grades 3–414. Our in vitro data showing a negative cellular response to PRP prepared from older donors with advanced knee OA suggest a potential mechanism for these clinical observations.
Following treatment with OA-PRP, human chondrocytes obtained from grossly normal appearing areas of an osteoarthritic knee reduced Col2a1 expression and increased Col1a1 expression when treated with OA-PRP. A review of the literature on the chondrogenic effects of PRP in vitro, shows mixed results. Like our study, Lee et al, showed that 10% PRP increased the fibrous Col1a1 phenotype and decreased Col2a1 gene expression in meniscal cartilage from healthy young rabbits24. In contrast, a study by Jeyakumar and colleagues, showed that compared to 10% fetal calf serum, 10% PRP from healthy donors increased Col2a1 and decreased Col1a1 mRNA in human OA chondrocytes25. Despite the controversy in the literature, we believe our study shows that PRP from both healthy and OA patients increases Col1a1 expression, while OA-PRP causes a reduction in Col2a1 not observed with H-PRP. The strong upregulation of Sox-9 and type II collagen mRNA consistent with an anabolic response to TGF-β1 (positive control) showed that our chondrocyte cultures were viable and that PRP treatment did not result in a comparable upregulation of chondrogenic markers.
Of interest, treatment of 3-D chondrocyte cultures with both OA-PRP and H-PRP resulted in upregulation of mRNA for the major collagenases MMP-1 and −13, MMP-3 (Stromelysin 1) and the gelatinase MMP-9 that are known to play a primary role in the structural remodeling during OA26,27. The increase in MMP’s were significantly greater with H-PRP and were not affected by the growth factor or inflammatory mediator grouping. Other studies have also shown that PRP upregulates MMP’s24,25,28, with the hypothesis being that the concentrated inflammatory cytokines (Il-1β and TNF-α) within PRP activates the known MMP pathways to stimulate remodeling27. Research with APS made from PRP with increased concentrations of anti-inflammatory proteins have been shown to reduce MMP-13 production from chondrocytes stimulated with Il-1β and TNF-α29. In that study, it was suggested that the inhibition of MMP-13 was due to an IRAP/IL-1β ratio of greater than 40:129. The mean IRAP/IL-1β ratio in our PRP samples was approximately 12 and could potentially explain the observed differences in chondrocyte response. We also found there was no difference in the IRAP/IL-1β ratio between PRP from older patients with knee OA and ‘healthy’ younger patients, even though the mean level of the two individual cytokines tended to be increased in OA-PRP compare to H-PRP.
Limitations of our study include the small sample sizes, the grouping of PRP samples into ‘low’ and ‘high’ groups based on a couple proteins, and the lack of age matched ‘healthy’ PRP samples for the OA-PRP cohort. Furthermore, in vitro studies are limited in ability to predict in vivo responses that are affected by cross-talk between healthy, diseased and regulatory tissues. To more closely model the in vivo cartilage environment, we employed 3D alginate bead cultures, which have been shown to prevent chondrocyte dedifferentiation and to increase Col2a1 levels compared to 2D monolayer cultures23. In addition, our in vitro study of chondrocytes harvested from the grossly intact side of a single OA knee, allowed testing the responses to different donor’s PRP on a similar population of chondrocytes. This also allowed us to more closely model the likely effects of PRP the ideal target chondrocytes in a KL grade <2 osteoarthritic knee. However, lack of histological analysis and use of FBS in all samples remain limitations in our study. Finally, due to differences between males and females in PRP composition and mesenchymal stromal cell differentiation potential6,30, this study focused on samples from male donors. Further evaluation of the effects of PRP from women on chondrocyte and macrophage cultures are needed.
In conclusion, this study showed that although there is significant variation in the composition of inflammatory mediators and growth factors within PRP from different donors, the age and OA disease state of male donors influenced chondrocyte and macrophage responses to PRP treatment. Compared to stimulation with TGF-β1, neither H-PRP nor OA-PRP upregulated gene expression for type II collagen or Sox-9 in human chondrocytes from an osteoarthritic knee consistent with lack of a chondrogenic response. Furthermore, PRP from older males with OA suppressed the expression of these chondrogenic markers and stimulated an inflammatory phenotype in human macrophages from a young and healthy donor. While both H-PRP and TGF-β1 stimulated upregulation of type I collagen, this suggests an undesired fibrotic response from these chondrocytes obtained from an osteoarthritic knee. These in vitro data did not show chondrogenic benefit of PRP from either young and healthy males or older males with osteoarthritis on human chondrocytes from an osteoarthritic joint. The in vitro data also showed potential detrimental effects of PRP from older males with osteoarthritis on the same human chondrocyte and macrophage cultures. These data suggest that age and OA disease state may influence the clinical response to PRP treatment. Further clinical studies are needed to determine predictors of clinical responses to PRP treatment.
Supplementary Material
Acknowledgements:
Funding:
NIH R01 051963 (PI-Chu), VA 101RX002452 (PI-Chu) and Stanford Medical Scholars Research Program (O’Donnell/Chu).
References:
- 1.).Chu CR, Andriacchi. 2015. Dance between biology, mechanics, and structure: A systems-based approach to developing osteoarthritis prevention strategies. J Orthop Res 33(7): 939–47. [DOI] [PMC free article] [PubMed] [Google Scholar]
- 2.).Laver L, Marom N, Dnyanesh L, et al. 2017. PRP for degenerative cartilage disease: a systematic review of clinical studies. Cartilage 8(4): 341–364. [DOI] [PMC free article] [PubMed] [Google Scholar]
- 3.).Moussa M, Lajeunesse D, Hilal G, et al. 2017. Platelet rich plasma (PRP) induces chondroprotection via increasing autophagy, anti-inflammatory markers, and decreasing apoptosis in human osteoarthritic cartilage. Experimental Cell Research 352: 146–156. [DOI] [PubMed] [Google Scholar]
- 4.).Cole BJ, Karas V, Hussey K, et al. 2016. A prospective, double-blind randomized controlled trial comparing clinical outcomes and effects on intra-articular biology for treatment of knee osteoarthritis. Am J Sports Med 45(2): 339–346. [DOI] [PubMed] [Google Scholar]
- 5.).Piuzzi NS, Chughtai M, Khlopas A, et al. 2017. Platelet-rich plasma for treatment of knee osteoarthritis: a review. J Knee Surg 30(7): 627–633. [DOI] [PubMed] [Google Scholar]
- 6.).Xiong G, Lingampalli N, Koltsov JCB, et al. 2017. Men and women differ in the biochemical composition of platelet-rich plasma. Am J Sports Med 6: 1–8. [DOI] [PMC free article] [PubMed] [Google Scholar]
- 7.).Boswell SG, Cole BJ, Sundman EA, et al. 2012. Platelet-rich plasma: a milieu of bioactive factors. Arthroscopy 28(3):429–439. [DOI] [PubMed] [Google Scholar]
- 8.).Castillo TN, Pouliot MA, Kim HJ, Dragoo JL. 2011. Comparison of growth factors and platelet concentration from commercial platelet separation systems. Am J Sports Med 39(2): 266–271. [DOI] [PubMed] [Google Scholar]
- 9.).Sakata R and Reddi AH. 2016. Platelet-rich plasma modulates action on articular cartilage lubrication and regeneration. Tissue Engineering: Part B 22 (5): 408–419. [DOI] [PubMed] [Google Scholar]
- 10.).Knop E, De Paula LE, Fuller R. 2015. Platelet-rich plasma for osteoarthritis treatment. Rev Bras Reumatol 207: 1–13. [DOI] [PubMed] [Google Scholar]
- 11.).Khoshbin A, Leroux T, Wasserstein D, et al. 2013. The efficacy of platelet-rich plasma in treatment of symptomatic knee osteoarthritis: a systematic review with quantitative synthesis. Arthroscopy 29(12): 2037–2048. [DOI] [PubMed] [Google Scholar]
- 12.).Raeissadat SA, Rayegani SM, Hassanabadi H, et al. 2015. Knee osteoarthritis injection choices: platelet- rich plasma (PRP) versus hyaluronic acid (a one-year randomized clinical trial). Clin Med Insights: Arthritis and Musculoskeletal Disorders 8: 1–8. [DOI] [PMC free article] [PubMed] [Google Scholar]
- 13.).Filardo G, Di Matteo B, Di Martino A, et al. 2015. Platelet-rich plasma intra-articular knee injections show no superiority versus viscosupplementation: a randomized controlled trial. Am J Sports Med 43(7): 1575–1582. [DOI] [PubMed] [Google Scholar]
- 14.).Filardo G, Kon E, Di Martino A, et al. 2012. Platelet-rich plasma vs hyaluronic acid to treat knee degenerative pathology: study design and preliminary results of a randomized controlled trial. BMC Musculoskeletal Disorders 13(229): 1–8. [DOI] [PMC free article] [PubMed] [Google Scholar]
- 15.).Chang KV, Hung CY, Aliwarga F, et al. 2014. Comparative effectiveness of platelet-rich plasma injections for treating knee joint cartilage degenerative pathology: a systematic review and meta-analysis. Archives PMR 95: 562–575. [DOI] [PubMed] [Google Scholar]
- 16.).Cavallo C, Filardo G, Mariani E, et al. 2014. Comparison of platelet-rich plasma formulations for cartilage healing: an in vitro study. J Bone Joint Surg Am 96(5): 423–429. [DOI] [PubMed] [Google Scholar]
- 17.).Braun HJ, Kim HJ, Chu CR, Dragoo JL. The effect of platelet-rich plasma formulations and blood products on human synoviocytes: implications for intra-articular injury and therapy. Am J Sports Med. 2014;42(5): 1204–1210. [DOI] [PMC free article] [PubMed] [Google Scholar]
- 18.).Sabarish R, Lavu V, Rao SR. 2015. A comparison of platelet count and enrichment percentages in the platelet rich plasma (PRP) obtained following preparation by three different methods. J Clin Diagn Res 9(2): ZC10–12. [DOI] [PMC free article] [PubMed] [Google Scholar]
- 19.).Marx RE. 2004. Platelet-Rich-Plasma: evidence to support it use. J Oral Maxillofac Surg 62(4): 489–496. [DOI] [PubMed] [Google Scholar]
- 20.).De Ceuninck F, Lesur C, Pastoureau P, et al. 2004. Culture of chondrocytes in alginate beads. Methods Mol Med 100:15–22. [DOI] [PubMed] [Google Scholar]
- 21.).Coyle CH, Izzo NJ, Chu CR. 2009. Sustained hypoxia enhances chondrocyte matrix synthesis. J Orthop Res 27:793–799. [DOI] [PMC free article] [PubMed] [Google Scholar]
- 22.).Chu CR, Izzo NJ, Papas BS, Fu FH. 2006. In vitro exposure to 0.5% bupivacaine is cytotoxic to bovine articular chondorcytes. Arthroscopy 22(7):693–699. [DOI] [PubMed] [Google Scholar]
- 23.).Caron MMJ, Emans PJ, Coolsen MME, et al. 2012. Redifferentiation of dedifferentiated human articular chondrocytes: comparison of 2D and 3D cultures. Osteoarthritis and cartilage 20:1170–1178. [DOI] [PubMed] [Google Scholar]
- 24.).Lee HR, Shon OJ, Park SI, et al. 2016. Platelet-rich plasma increases levels of catabolic molecules and cellular dedifferentiation in the meniscus of a rabbit model. Int J Mol Sci 17(1):120. [DOI] [PMC free article] [PubMed] [Google Scholar]
- 25.).Jejakumar V, Niculescu-Morzsa E, Bauer C, et al. 2017. Platelet-rich plasma supports proliferation and redifferentiation of chondrocytes during in vitro expansion. Front Bioeng Biotechnol 5:75. [DOI] [PMC free article] [PubMed] [Google Scholar]
- 26.).Goldring MB, Otero M, Plumb DA, et al. 2014. Roles of inflammatory and anabolic cytokines in cartilage metabolism: signals and multiple effectors converge on MMP-13 regulation in osteoarthritis. Eur Cell Mater 21:202–220. [DOI] [PMC free article] [PubMed] [Google Scholar]
- 27.).Tetlow LC, Adlam DJ, Woolley DE. 2001. Matrix metalloproteinase and proinflammatory cytokine production by chondrocytes of human osteoarthritic cartilage. Arthitis Rheum 44(3):585–594. [DOI] [PubMed] [Google Scholar]
- 28.).Van Buul GM, Koevoet WLM, Kops N, et al. 2011. Platelet-rich plasma releasate inhibits inflammatory processes in osteoarthritic chondrocytes. Am J Sport Med 39(11):2362–2370. [DOI] [PubMed] [Google Scholar]
- 29.).Woodell-May J, Matsuka A, Oyster M, et al. 2011. Autologous protein solution inhibits MMP-13 production by Il-1b and TNFa-stimulated human articular chondrocytes. J Orthop Res 29(9):1320–1326. [DOI] [PubMed] [Google Scholar]
- 30.).Payne KA, Didiano DM, Chu CR. 2010. Donor sex and age influence the chondrogenic potential of human femoral bone marrow stem cells. Osteoarthritis Cartilage 18(5): 705–713. [DOI] [PMC free article] [PubMed] [Google Scholar]
Associated Data
This section collects any data citations, data availability statements, or supplementary materials included in this article.


