Abstract
Background:
Differences in postembryonic developmental trajectories can pro-foundly alter adult phenotypes and life histories. Thyroid hormone (TH) regulates metamorphosis in many vertebrate taxa with multiphasic ecologies, and alterations to TH metabolism underlie notable cases of paedomorphosis in amphibians. We tested the requirement for TH in multiple postembryonic developmental processes in zebrafish, which has a monophasic ecology, and asked if TH production was compromised in paedomorphic Danionella.
Results:
We showed that TH regulates allometric growth in juvenile zebrafish, and inhibits relative head growth. The lateral line system showed differential requirements for TH: the hormone promotes canal neuromast formation and inhibits neuromast proliferation in the head, but causes expansion of the neuromast population in the trunk. While Danionella morphology resembled that of larval zebrafish, the two Danionella species analyzed were not similar to hypothyroid zebrafish in their shape or neuromast distribution, and both possessed functional thyroid follicles.
Conclusions:
Although zebrafish do not undergo a discrete ecological transformation, we found that multiple tissues undergo transitions in developmental trajectories that are dependent on TH, suggesting the TH axis and its downstream pathways as likely targets for adaptation. Nonetheless, we found no evidence that evolutionary paedomorphosis in Danionella is the result of compromised TH production.
Keywords: Danionella, danionin, lateral line, metamorphosis, morphometrics, neuromasts, paedomorphosis, thyroid hormone, zebrafish
1 |. INTRODUCTION
Shifts in the timing and magnitude of developmental processes during later, postembryonic stages of development can profoundly alter adult phenotypes.1–3 Revealing the pathways that regulate ontogenetic trajectories of different developmental processes will be critical in understanding how life histories and phenotypes are formed. Further, discerning the mechanisms by which different processes may be decoupled will be critical for a complete understanding of the evolution of development.
An extreme way in which postembryonic development may be changed is through paedomorphosis, wherein an organism does not complete terminal stages of development1,4; organisms on the spectrum of paedomorphosis retain larval characteristics into adulthood.5 Paedomorphosis is generally most obvious when it originates in clades with ecologically multiphasic life histories. Ecologically multiphasic vertebrates are those that undergo an ecological shift as they transform to juveniles, for example, amphibians that metamorphose from aquatic larvae to terrestrial juveniles. Paedomorphosis in these clades involves loss of a markedly divergent life history stage and may be phenotypically quite obvious.5,6 Paedomorphosis in clades with ecologically monophasic life histories may be less morphologically striking, but paedomorphosis has nonetheless been posited as an important evolutionary process in many monophasic groups, including in mammals.7,8
Since vertebrates with multiphasic life cycles often undergo a metamorphosis triggered by a single molecular pathway (generally thyroid hormone, TH), paedomorphosis could theoretically evolve in these groups through a single genetic change. Thus, disruptions to TH pathways cause developmental arrest and underlie cases of paedomorphosis, as in the Mexican axolotl.5,9 In contrast, ecologically mono-phasic vertebrates generally have more subtle relationships with the molecular signals that regulate progression through postembryonic development. TH functions as an important regulator of developmental processes in ecologically monophasic vertebrates (eg, zebrafish and mammals), but disruptions to the thyroid axis do not result in whole-organism arrest.10–12 In ecologically monophasic groups, the pathways regulating postembryonic developmental progression are less clear, as are the mechanisms and pathways that might underlie evolutionary paedomorphosis.
Teleosts represent the largest and most speciose group of vertebrates, exhibiting a remarkable range of life history strategies.13,14 Most marine fishes are ecologically multi-phasic, and pelagic larvae undergo profound physiological metamorphosis to transform into benthic juveniles.14 Metamorphosis is stimulated by TH in flat fish15–17 and reef fish,18 and likely in many other species.19 Like in amphibians, TH stimulates the abrupt transformation of discrete tissues across the body, causing dramatic changes in overall morphology, sensory systems, and other organs.
In contrast, most freshwater fishes, including zebrafish (Danio rerio), are ecologically monophasic. These monophasic species show a more subtle and protracted transformations from larva to juvenile. Nonetheless, specific tissues (including skeleton, pigment pattern, and the lateral line) do undergo major remodeling during postembryonic development.20–23 Many of these remodeling processes, including those in the skeleton and the pigment pattern, are dependent on TH.12,24–26 Whether in total these transformations and remodeling processes constitute a “metamorphosis” depends on how broadly the term is defined.14,27 A clearer picture of normal developmental trajectories in zebrafish, as well as the relative dependencies on TH, can inform our concept of how normal postembryonic development is regulated and whether this species exhibits a metamorphosis homologous to that of marine species.
Many fish species have been described as paedomorphic, including ice fish,28 gobies,29,30 and blennioid fishes.31 Danionella is a danionin relative of zebrafish, sister clade to the group containing zebrafish, and Danios, Devarios, and Microdeverios.32 Danionella is miniaturized and developmentally arrested, resembling larval zebrafish in several ways: adult Danionella lack scales, barbels, and many typically late-ossifying bones,33,34 and retain a larva-like pigment pattern and feeding kinematics.35,36 Danionella translúcida is emerging as a novel model for studying behavior, neurobiology, and brain function,37,38 and a hybrid genome assembly was recently completed.39 A better understanding of the developmental relationships between Danionella and zebrafish, along with information about the pathways underlying paedomorphosis in Danionella, will offer new insights about this emerging model.
In this study we focused on two trait systems that change over the course of postembryonic development. We first focused on body shape, which changes dramatically during postembryonic development of many species. Vertebrates with multiphasic life cycles exhibit considerable shape change (ie, allometric growth) during their profound physiological metamorphosis, followed by more proportional (ie, isometric) growth as juveniles and adults.
We next focused on development of the lateral line system. This flow-sensing sensory system consists of individual neuromasts distributed across the body in specific patterns.23,40,41 The lateral line system is transformed during metamorphosis in amphibians42 and lampreys,43 and in teleosts with both ecologically multiphasic (eg, flatfishes44) and ecologically monophasic lifecycles (eg, zebrafish23).
Our goals in this study were 3-fold. First, we aimed to characterize shape change and the development of the lateral line system during normal zebrafish development, asking whether these developmental trajectories show evidence of a metamorphic transformation that corresponds with a period of increased TH production. Second, we tested whether TH is required in the development of these systems, determining the extent to which the hormone is required to coordinate shape change and/or lateral line development with overall growth. Finally, we tested whether adults of two Danionella species recapitulate any stage of normal zebrafish ontogeny, further testing the possibility that developmental arrest in Danionella is due to a lack of TH production.
2 |. RESULTS AND DISCUSSION
2.1 |. Zebrafish shows allometric shifts during postembryonic development
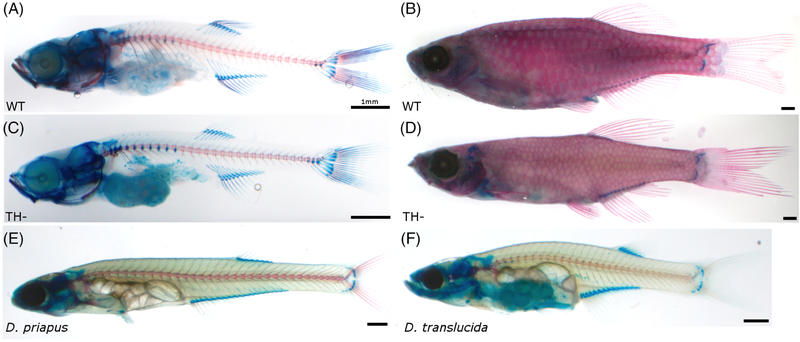
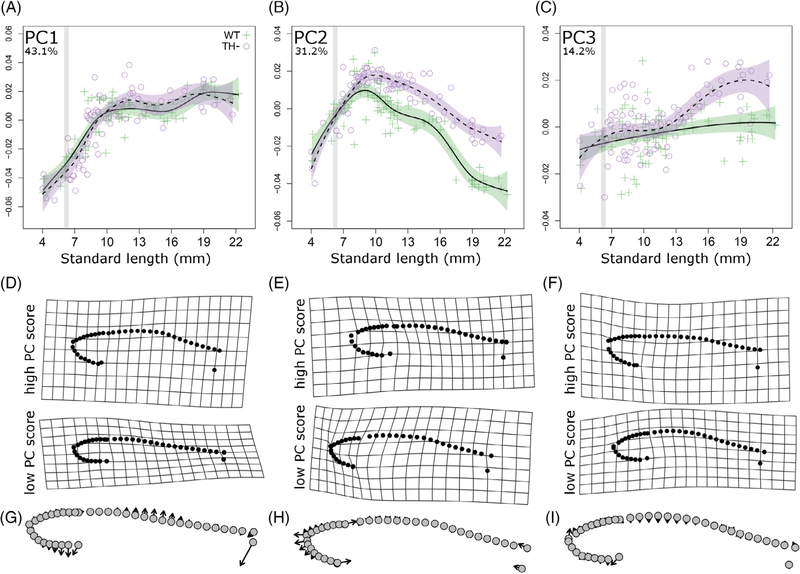
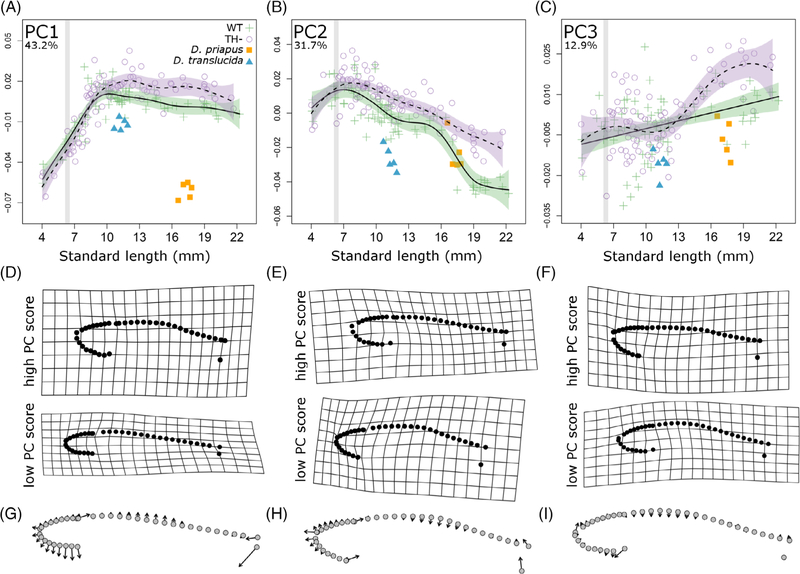
To test the extent to which euthyroid wild-type (WT) zebrafish undergo changes in overall morphology during postembryonic development (see Figure 1A,B), we first assessed allometric growth trajectories of body shape (Figure 2, green crosses). Together, the first three principal components captured more than 88% of total shape variation; these were plotted against individual standard length (SL; Figure 2). PC1 primarily captured body depth (Figure 2D, G). In this axis, WT zebrafish allometrically increase body depth until the end of the larval period (10 mm SL), then maintain a roughly isometric change in body depth (Figure 2A). PC2 captures the relative size of the head. This component peaks at ~9 mm SL, and then decreases gradually during juvenile and adult growth (green crosses, Figure 2B). The dorsal profile captured by PC3 increases gradually with growth (Figure 2C).
FIGURE 1.
Cleared and stained zebrafish and Danionella. A, Wild-type (WT) juvenile zebrafish. B, WT adult zebrafish. C, Hypothyroid (TH−) juvenile zebrafish. D, TH− adult zebrafish. E, Adult Danionella priapus. F, Adult Danionella translucida
FIGURE 2.
Thyroid hormone regulates allometric trajectories in zebrafish. A-C, Principle component (PC) scores of body shape plotted against standard length for both WT (green cross) and TH− (purple open circle) zebrafish. Percent variation explained by each PC axis is shown in the upper left corner. Developmental trajectory is shown in solid line with purple SE for WT and dashed line with green SE for TH−. For comparison between graphs, gray stripes highlight period from 6 to 6.4 SL, during which TH availability is elevated. D-F, Deformation grids showing extreme shapes along each PC. G-I, Vector plots showing shape change along each PC axis, with arrows pointing from negative to positive PC values
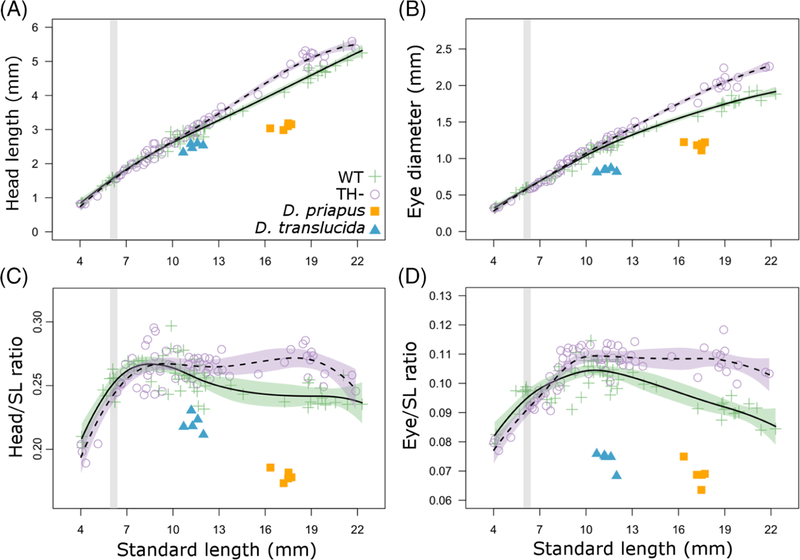
To more directly test for growth in head proportion during development, we plotted the ratio of head length/SL over the course of growth (Figure 3C, green crosses). This ratio mirrored PC2, peaking at ~8 mm SL and then gradually declined afterward (green crosses, Figure 3C). Eye size had a similar developmental trajectory to head length, continued to grow proportionally during larval phase, peaking at ~10 mm SL (green crosses, Figure 3D). Thus, WT zebrafish exhibit shifts in allometric relationships during the transition from larva to juvenile (8–10 mm SL); these shifts are consistent with a systemic metamorphosis. The pattern of positive allometric growth of the head has been documented in a number of fish species,45–47 and likely reflects strong selection on early development of craniofacial feeding apparatus, respiratory, and sensory systems.
FIGURE 3.
Thyroid hormone regulates body proportions in zebrafish. A, Head length as a function of SL; B, Eye diameter as a function of SL. C, Head length/SL and D, eye diameter/SL as functions of SL. Showing both WT (green cross) and TH− (purple open circle) zebrafish, with comparison to Danionella priapus (orange square) and Danionella translucida (blue triangle) adults. Developmental trajectory is shown in solid line with purple SE for WT zebrafish and dashed line with green SE for TH− zebrafish. For comparison between graphs, gray stripes highlight period from 6 to 6.4 SL, during which TH availability is elevated. SL, standard length; TH−, hypothyroid; WT, Wild-type
2.2 |. TH inhibits head growth in the juvenile
To determine the extent to which TH is required for these allometric shifts, we measured shape and proportion changes in transgenically thyroid ablated, hypothyroid fish (TH–; Figure 1C,D). Changes in body depth were independent of TH, and shape changes along the PC1 axis were indistinguishable between TH– and WT (Figure 2A). However, we found that TH influences the relative growth of the head: in TH– fish, PC2 continues to increase along a larva-like trajectory until ~10 mm SL (purple circles, Figure 2B). The third PC axis reveals that TH– fish develop an increasingly flat dorsal profile, unlike that of any stage of development in WT (Figure 2C).
In TH– fish, heads and eyes continue to grow along relatively steeper (larva-like) trajectories (Figure 2A,B). After rapid relative growth during larval development, the relative size of the head and eye does not decline appropriately in TH –fish (Figure 2C,D). Thus, TH is required for the coordinated transition from a larval trajectory to the juvenile trajectory, and limits the relative growth of the head in juveniles.
2.3 |. TH inhibits proliferation of cranial neuromasts, but promotes formation of neuromast stitches on the body
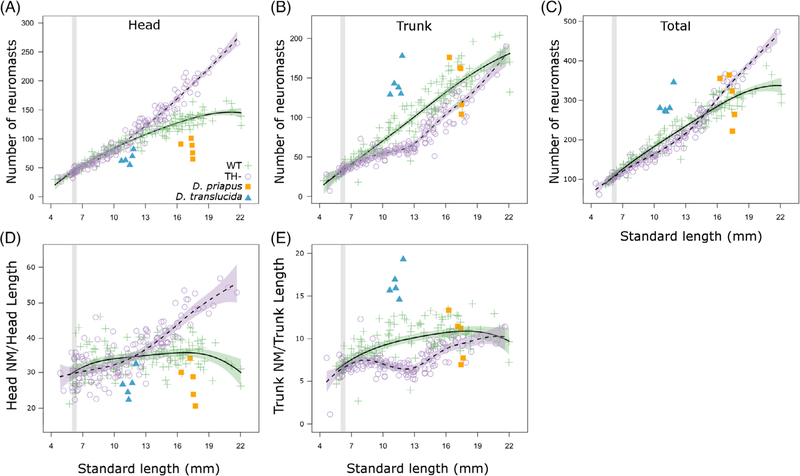
We next focused on the development of a trait that emerges via very different processes than allometric body growth. We tracked numbers of neuromasts of the lateral line system across a range of body sizes (see Figure 4). In WT zebrafish, the number of trunk neuromasts increases roughly in proportion to body size, whereas neuromasts in the head show a negative allometric relationship to body size (green crosses, Figure 5A,B). We found that TH– adults had ~25% more total neuromasts than did WT adults (Figure 5C), and that this difference was driven primarily by the increasing number of cranial neuromasts (Figure 5A). This increase in cranial neuromast number is not simply due to the fact that TH–fish have larger heads, as differences remain even when standardized by head length (Figure 5D).
FIGURE 4.
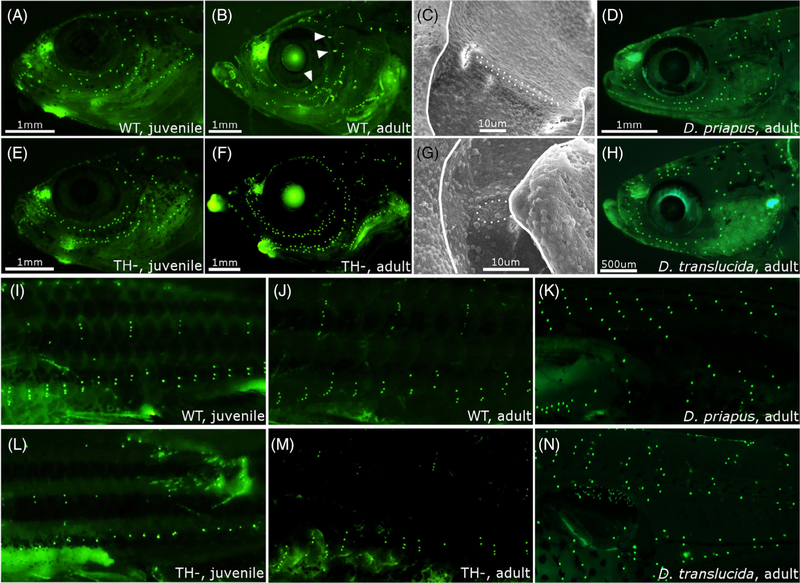
The lateral line system in zebrafish and Danionella. A and B, DiASP live staining of head neuromasts in WT juvenile (13 mm SL) and adult (18+ mm SL). Arrowhead indicates rod-shaped canal neuromasts at adult stage. C, Scanning electron micrographs of a supraorbital canal neuromast in WT adult. Dotted line outlines the neuromast; solid line outlines the bony edge of the canal. D, Head neuromasts in Danionella priapus adult. E-G, Same as B-D in TH− zebrafish. H, Facial neuromasts in Danionella translucida adult. I-N, DiASP live staining of trunk neuromasts in WT juvenile zebrafish (13 mm SL, I), WT adult (18+ mm SL, J), D. priapus adult (K), TH− juvenile (13 mm SL, L) TH− adult (18+ mm SL, M), and D. translucida adult (N). SL, standard length; TH−, hypothyroid; WT, Wild-type
FIGURE 5.
Thyroid hormone regulates lateral line development in zebrafish. A, Number of cranial neuromasts, as a function of SL, with comparison to Danionella priapus (orange square) and Danionella translucida (blue triangle) adults. For zebrafish, developmental trajectory is shown in solid line for WT and dashed line for TH−. Developmental trajectory is shown in solid line with purple SE for WT zebrafish and dashed line with green SE for TH− zebrafish. For comparison between graphs, gray stripes highlight period from 6 to 6.4 SL, during which TH availability is elevated. B-E, Same as (A) for number of trunk neuromasts, total number of neuromasts (head + trunk), cranial neuromasts divided by head length, and trunk neuromasts divided by trunk length. SL, standard length; TH−, hypothyroid; WT, Wild-type
A subset of cranial neuromasts acquire an elongated, rod-like shape in WT juveniles and eventually sink into bony canals.23 We found that although neuromasts do become enclosed in canals in TH– adults, these canal neuromasts fail to acquire the mature morphology seen in WT (Figure 4B,C vs Figure 4F–G). The transition into mature canal neuromasts may serve as a cue that inhibits neuromast proliferation; without this cue, neuromasts in TH– heads may remain highly proliferative through adulthood.
In WT zebrafish, trunk neuromasts proliferate into vertical stitches starting at ~10 mm SL48; visible in Figure 4I,J, M). In TH– fish, the trunk neuromast population grows more slowly until stitches start forming at ~13 mm SL (see Figures 4M and 5B), suggesting that TH regulates onset of stitch formation.
2.4 |. Bioavailability of TH shifts during midlarval development
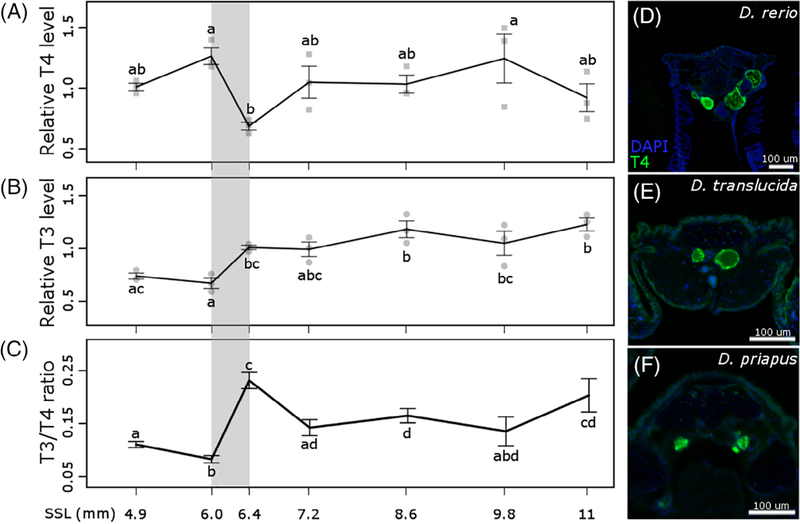
Thyroid hormone production peaks during metamorphic climax in amphibians, measured as both the prohormone thyroxine (T4, the form of TH primarily produced by the thyroid follicles, see Figure 6D) and triiodothyronine (T3, the more biologically active form that binds to nuclear TH receptors49–52). We wanted to test whether the physiological changes stimulated by TH in zebrafish corresponded with periods of elevated TH production or changes in the ratio of T3/T4. We measured T4 and T3 levels at seven stages from larval through juvenile development, staging groups of fish according to the standardized standard length staging criteria (SSL21). The relative levels of T3 and T4 remained relatively consistent from one stage to another, except as fish transitioned from 6 to 6.4 SSL. During this period, when anal and dorsal rays first appear,21 we detected a drop in T4 corresponding with an increase in T3 titer (Figure 6A–C). We conclude that there is a shift in TH bioavailability during this mid-larval period, which we have highlighted with gray bars in the graphs of Figures 2–3, and 5–7. Following this shift, T3 availability remained elevated through juvenile development (Figure 6B).
FIGURE 6.
Relative thyroid hormone content during larval development in zebrafish. A, T4, thyroxine; B, T3, triiodothyronine; C, ratio of T3 to T4. All concentrations standardized to body weight. Whiskers represent SE at each stage. Stages that are not statistically different (as determined by Tukey’s Honest Significant Differences Test, p value cut-off was set at .05) are represented with the same letter. For comparison with other figures, gray stripe shows period from 6 to 6.4 SSL, during which TH availability is elevated. D-F, Antibody staining of T4 in zebrafish, Danionella priapus and Danionella translucida adults showing functional thyroid follicles. Images show 12 μM transverse sections of the thyroid region. SSL, standardized standard length
FIGURE 7.
Danionella adults resemble larval zebrafish but not TH− zebrafish. A-C, Principle component (PC) scores of body shape plotted against standard length for both WT (green cross) and TH− (purple open circle) zebrafish, compared to Danionella priapus (orange square) and Danionella translucida (blue triangle) adults. Percent variation explained by each PC axis is shown on the upper left corner. Developmental trajectory is shown in solid line with purple SE for WT zebrafish and dashed line with green SE for TH− zebrafish. For comparison between graphs, gray stripes highlight period from 6 to 6.4 SL, during which TH availability is elevated. D-F, Deformation grids showing extreme shapes along each PC. G-I, Vector plots showing shape change along each PC axis, with arrows pointing from negative to positive PC values. SL, standard length; TH−, hypothyroid; WT, Wild-type
A previous analysis identified a similar shift in T3/T4 ratio at 10 to 14 days post fertilization (dpf), attributed to higher deiodinase activity.53 Indeed, while expression of thyroglobulin remains relatively stable from 10 to 20 dpf, deiodinase 2 expression increases 2-fold.54 However, these patterns are difficult to perfectly correlate with our measurements, as dpf (used in these previous analyses) is an unreliable proxy for development.21,55
Shifts in allometric trajectories of WT fish occur at 8 to 10 mm SL (Figures 2A,B and 3C,D). In contrast, the mid-larval shift in T3/T4 ratio occurs at a considerably smaller size (6.4 SSL) and earlier developmental stage (Figure 6), so it seems unlikely that the change in TH ratio directly stimulates the shifts. Nonetheless, the earliest differences between TH– and WT fish are detectable only after ~8 mm SL in allometric relationships (Figure 3B,D) and neuromast numbers (Figure 5B,E). Rather than stimulating a discrete period of profound physiological change (like in metamorphic amphibians), ongoing exposure to TH during late larval periods appears to gradually shift developmental trajectories. TH– zebrafish maintain inappropriately longer periods of larval growth patterns; rather than maintaining larval shapes, TH– zebrafish ultimately achieve novel adult phenotypes.
2.5 |. Adult Danionella resemble larval zebrafish
Danionella maintain numerous characteristics of larval zebrafish, and is described as paedomorphic.33,34 We tested the prediction that Danionella body shape should more closely resemble larval rather than adult zebrafish, by reanalyzing our morphometric data sets to include D translucida and Danionella priapus. Danionella adults of both species exhibited lower PC1 scores than similarly sized zebrafish (blue triangles and orange squares, Figure 7), showing immature body shape relative to similarly sized zebrafish. Both species of Danionella also showed proportionally smaller heads and eyes for their body length (blue triangles and orange squares, Figure 2). Thus, the two Danionella species indeed maintain certain morphologies similar to those of larval zebrafish, and are likely to have more isometric patterns of growth during development.
Although D. translúcida was smaller than D. priapus, the two species had similar total numbers of neuromasts (~300; Figure 5C). The size of the D. priapus neuromast population was comparable to that of similarly sized WT zebrafish, while D. translucida had more total neuromasts, with a greater relative density in the trunk (Figure 5B,C,E).
2.6 |. Danionella do not resemble hypothyroid zebrafish, and possess functional thyroid follicles
Since TH is involved in the most well-known examples of paedomorphosis,1,5,9 we tested the possibility that TH metabolism was disrupted in Danionella species. First, we asked if Danionella appeared more similar to TH– than to WT zebrafish. In terms of morphometries (Figure 7) and ratios of head and eye to SL (Figure 3), both Danionella species actually more closely resembled similarly sized WT than TH– zebrafish. Similar to TH– zebrafish, the two Danionella species did not form elongated canal neuromasts (Figure 4D,H). However, Danionella shows fewer cranial neuromasts and more trunk neuromasts than similarly sized WT zebrafish, in contrast to the patterns observed in TH– zebrafish (Figure 5). In all, the two Danionella species did not resemble TH– zebrafish. To further confirm that hypothyroidism did not underlie developmental truncation in these species, we examined the thyroid follicles, which were intact and showed T4 production comparable to that in zebrafish (Figure 6D–F).
2.7 |. Conclusions
We identified shifts in allometric trajectories as WT zebrafish transition from larva to juvenile, and some aspects of these shifts showed dependence on TH. However, unlike hypothyroid amphibians, which maintain larval morphology through adulthood, TH– zebrafish inappropriately maintain larval growth trajectories and ultimately achieve novel adult phenotypes. We conclude that TH normally coordinates multiple aspects of the transition from larval to juvenile developmental programs in zebrafish. We interpret these hormonally mediated changes to constitute a protracted, subtle metamorphosis, in contrast to the sudden and profound metamorphosis of ecologically multiphasic species. Based on its dependence on TH, we posit that this subtle metamorphosis is indeed evolutionarily homologous to the profound metamorphosis of ecologically multiphasic vertebrates.
Consistent with the idea that Danionella is paedomorphic, two Danionella species analyzed showed several similarities to larval WT zebrafish in their body proportions and their lateral line. However, Danionella bore little resemblance to TH– zebrafish, and we found that they produced T4. We conclude that, unlike in paedomorphic amphibians, disruptions to the thyroid axis do not underlie paedomorphosis in these species.
3 |. EXPERIMENTAL PROCEDURES
3.1 |. Fish rearing
Zebrafish used in this study were of the line Tg(tg:nVenus-v2a-nfnB),12 which allows conditional ablation of the thyroid follicles. Transgenic fish were treated 4 to 5 dpf with DMSO (for control euthyroid fish, WT) or DMSO + metronidazole (to ablate the thyroid follicles and produce hypothyroid fish, TH–), following McMenamin et al.12 All fish were reared at 28° C with a 12h:12h light:dark cycle and fed three times per day with marine rotifers, Artemia and pure Spirulina flakes (Pentair). This diet was chosen to minimize introduction of exogenous TH. D translucida was a gift from Adam Douglass, University of Utah; D. priapus was purchased through The Wet Spot (Portland, Oregon). Both species of Danionella were fed rotifers, Artemia and Gemma micro (Skretting).
3.2 |. Live staining of neuromasts
The fluorescent mitochondrial stain 4-(4-diethylaminostyryl)-1-methylpyridinium iodide (DiASP; AdipoGen) was used to visualize neuromasts.56 Individual fish were incubated in 0.0024% DiASP in fish system water with 0.02% tricane (Western Chemical) for 5 minutes, then transferred to 2% methylcellulose and imaged with an Olympus DP74 camera mounted on an Olympus SZX16 stereoscope with a flourescin (FITC) filter. Standard length (SL) was measured on lateral images of the fish using ImageJ.57 Neuromasts were counted manually from digital images; all counts were performed by the same individual to reduce variability.
3.3 |. Scanning electron microscopy
Wild-type and TH– adult zebrafish were fixed in 4% paraformaldehyde (Sigma) overnight at 4°C, rinsed several times with phosphate-buffered saline (PBS), and dehydrated in an ascending series of ethanol. Samples were critical point dried in 100% ethanol, coated with Au-Pd and imaged with a JEOL JCM-6000PLUS NeoScope Benchtop SEM.
3.4 |. Fixation and skeletal staining
Specimens were euthanized by an overdose of tricane, then fixed in 4% paraformaldehyde (Sigma) overnight at 4°C. Specimens were rinsed several times with PBS and dehydrated in 70% ethanol. Following,58 skeletons were stained overnight in 0.5% Alizarin red (Sigma) and 0.02% Alcian Blue (Sigma) with 60 mM MgCl2 in 70% EtOH. Stained specimens were bleached with 3% hydrogen peroxide in 1% potassium hydroxide (KOH), then were cleared by gradually transitioning through an ascending glycerol series from 25% to 80%. Prior to imaging, cleared specimens were incubated in PBS overnight, and then transferred into 2% methylcellulose for positioning and imaged as above for morphometric analysis.
3.5 |. Morphometrics
Homologous anatomical landmarks and curves that outline the body were placed manually (by a single individual) on lateral images of fish using the R package StereoMorph.59 A list of the specific landmarks can be found in the Supporting Information (Table S1). Landmark data were then analyzed with standard geometric morphometrics methods using the R package Geomorph.60
3.6 |. Head size and eye size
Head size was measured in images of cleared and stained specimens in lateral view. Head size was measured as the distance from the tip of the snout/rostral edge of premaxilla to the posterior tip of the occipital bone. Two eye measurements, the dorsal-ventral height, and the anterior-posterior length were obtained, and then averaged as the eye-size measure. Measurements were performed by a single individual to reduce variability.
3.7 |. Thyroid staining
To image thyroid follicles, adult zebrafish, D. priapus and D. translucida were fixed in 4% paraformaldehyde (Sigma), embedded in O.C.T. Compound (Fisher Scientific), and sectioned on to 12 μm. Slides were washed with 0.1% Tween in PBS (PBSt), blocked with 10% heat-inactivated goat serum in PBSt, then incubated at 4°C overnight with a rabbit T4 antibody (1:1000, Fitzgerald). Slides were then washed, incubated with a secondary antibody (goat anti-rabbit FITC diluted 1:1000, Fitzgerald), stained with DAPI (1 μg/mL) for 20 minutes, washed and imaged on an Olympus IX83 microscope equipped with a Hamamatsu ORCA Flash 4.0LT camera.
3.8 |. Quantification of thyroxine (T4) and triiodothyronine (T3)
Live WT zebrafish was anesthetized and staged following the adult normal table.21 Seven stages were chosen to capture major processes during the entire transition from larva to juvenile (see Table S2), and fish were staged by the SSL convention.21 Samples were prepared following McMenamin et al.12; briefly, staged fish were pooled, euthanized by an overdose of tricaine, blotted dry, and weighed in microcentrifuge tubes. Tissue was suspended in cold methanol with 1 mM 6-propyl-2-thiouracil (PTU; Sigma) and homogenized by sonication; homogenized samples were stored at –80°C until analysis. Samples were centrifuged, re-extracted with additional PTU-containing methanol. Supernatants were pooled and dried with a CentriVap Concentrator (Labconco) for ~5 hours, then resuspended in PBS. Samples were run on T4 and T3 ELISA kits (Diagnostic Automation Inc.) with two technical replicates and with three biological replicates for each stage. Plates were analyzed on a PerkinElmer Victor X5; mean absorbance value from three readings was used for subsequent analysis. Standard curves were generated with four-parameter logistic regression via online analysis software (www.elisaanalysis.com).
3.9 |. Statistics
All statistical analyses were performed in R (version 3.4.1). Differences in TH levels along ontogeny were first examined using ANOVA, followed by Tukey’s Honest Significant Distance Test. Developmental trajectory was estimated with the spm function in the package SemiPar using default settings.61 Developmental trajectories were considered to be distinct when the ranges of SE did not overlap between the groups. For example, in Figure 2A, the SE ranges always overlap (the green and purple bands overlap) and the models are not considered different. In Figure 2B, the SE ranges of two models diverges at ~9 mm SL.
Supplementary Material
ACKNOWLEDGMENTS
Thank you for discussion and technical support from Catherine May, Angela Mauri, Stacy Nguyen, Pranav Parikh, Mary Xu, and all the members of the McMenamin Lab. Thank you to Jacqueline Webb and another anonymous reviewer for their insightful comments. Thank you to Michael Burns for help with SEM. Thank you to Adam Douglass, David Parichy, the Boston College Statistics Department and the Boston College Animal Care staff.
Funding information
Burroughs Wellcome Fund, Grant/Award Number: 1017439; Directorate for Biological Sciences, Grant/Award Number: 1845513; Eunice Kennedy Shriver National Institute of Child Health and Human Development, Grant/Award Number: R03HD091634; National Institute of General Medical Sciences, Grant/Award Number: R00GM105874
Footnotes
SUPPORTING INFORMATION
Additional supporting information may be found online in the Supporting Information section at the end of this article.
REFERENCES
- 1.Gould SJ. Ontogeny and Phylogeny. Cambridge: The Belknap Press of Harvard University Press; 1977. [Google Scholar]
- 2.Raff R. The Shape of Life: Genes, Development and the Evolution of Animal Form. Chicago, IL: University of Chicago Press; 1996. [Google Scholar]
- 3.Smith KK. Heterochrony revisited: the evolution of developmental sequences. Biol J Linn Soc. 2001;73(2):169–186. [Google Scholar]
- 4.Shaffer HB, Voss SR. Phylogenetic and mechanistic analysis of a developmentally integrated character complex: alternate life history modes in ambystomatid salamanders. AmZool. 1996;36(1):24–35. [Google Scholar]
- 5.Johnson CK, Voss SR. Salamander paedomorphosis: linking thyroid hormone to life history and life cycle evolution. Curr Top Dev Biol. 2013;103:229–258. [DOI] [PubMed] [Google Scholar]
- 6.McMenamin SK, Hadly EA. Developmental dynamics of Ambystoma tigrinum in a changing landscape. BMC Ecol. 2010;10(1):10. [DOI] [PMC free article] [PubMed] [Google Scholar]
- 7.Goodwin D, Bradshaw JW, Wickens SM. Paedomorphosis affects agonistic visual signals of domestic dogs. Anim Behav. 1997;53(2) :297–304. [Google Scholar]
- 8.Shea BT. Paedomorphosis and neoteny in the pygmy chimpanzee. Science. 1983;222(4623):521–522. [DOI] [PubMed] [Google Scholar]
- 9.De Groef B, Grommen SV, Darras VM. Forever young: endocrinology of paedomorphosis in the Mexican axolotl (Ambystoma mexicanum). Gen Comp Endocrinol. 2018;266:194–201. [DOI] [PubMed] [Google Scholar]
- 10.Brown DD. The role of thyroid hormone in zebrafish and axolotl development. Proc Natl Acad Sci USA. 1997;94(24):13011–13016. [DOI] [PMC free article] [PubMed] [Google Scholar]
- 11.Buchholz DR. More similar than you think: frog metamorphosis as a model of human perinatal endocrinology. Dev Biol. 2015;408(2):188–195. [DOI] [PubMed] [Google Scholar]
- 12.McMenamin SK, Bain EJ, McCann AE, et al. Thyroid hormone-dependent adult pigment cell lineage and pattern in zebrafish. Science. 2014;345(6202):1358–1361. [DOI] [PMC free article] [PubMed] [Google Scholar]
- 13.Finn RN, Kapoor B. Fish Larval Physiology. Didcot: Taylor & Francis; 2008. [Google Scholar]
- 14.McMenamin SK, Parichy DM. Metamorphosis in teleosts. Curr Top Dev Biol. 2013;103:127–165. [DOI] [PMC free article] [PubMed] [Google Scholar]
- 15.Campinho MA, Silva N, Martins GG, et al. A thyroid hormone regulated asymmetric responsive centre is correlated with eye migration during flatfish metamorphosis. Sci Rep. 2018;8(1):12267. [DOI] [PMC free article] [PubMed] [Google Scholar]
- 16.Isorna E, Obregon MJ, Calvo RM, et al. Iodothyronine deiodinases and thyroid hormone receptors regulation during flatfish (Solea senegalensis) metamorphosis. J Exp Zool B Mol Dev Evol. 2009; 312(3):231–246. [DOI] [PubMed] [Google Scholar]
- 17.Xu J, Ke Z, Xia J, He F, Bao B. Change of body height is regulated by thyroid hormone during metamorphosis in flatfishes and zebrafish. Gen Comp Endocrinol. 2016;236:9–16. [DOI] [PubMed] [Google Scholar]
- 18.Holzer G, Besson M, Lambert A, et al. Fish larval recruitment to reefs is a thyroid hormone-mediated metamorphosis sensitive to the pesticide chlorpyrifos. Elife. 2017;6:e27595. [DOI] [PMC free article] [PubMed] [Google Scholar]
- 19.Holzer G, Laudet V. Thyroid hormones: a triple-edged sword for life history transitions. Curr Biol. 2015;25(8):R344–R347. [DOI] [PubMed] [Google Scholar]
- 20.Parichy DM. Evolution of danio pigment pattern development. Heredity. 2006;97(3):200–210. [DOI] [PubMed] [Google Scholar]
- 21.Parichy DM, Elizondo MR, Mills MG, Gordon TN, Engeszer RE. Normal table of postembryonic zebrafish development: staging by externally visible anatomy of the living fish. Dev Dyn. 2009;238 (12):2975–3015. [DOI] [PMC free article] [PubMed] [Google Scholar]
- 22.Parichy DM, Turner JM. Zebrafish puma mutant decouples pigment pattern and somatic metamorphosis. Dev Biol. 2003;256(2):242–257. [DOI] [PubMed] [Google Scholar]
- 23.Webb JF, Shirey JE. Postembryonic development of the cranial lateral line canals and neuromasts in zebrafish. Dev Dyn. 2003;228 (3):370–385. [DOI] [PubMed] [Google Scholar]
- 24.Keer S, Cohen K, May C, Hu Y, McMenamin S, Hernandez LP. Anatomical assessment of the adult skeleton of zebrafish reared under different thyroid hormone profiles. Anat Rec. 2019http//www.ncbi.nlm.nih.gov/pubmed/30989809. [DOI] [PMC free article] [PubMed] [Google Scholar]
- 25.Shkil F, Borisov V, Abdissa B, Smirnov S. Role of thyroid hormone in the ontogeny and morphological diversification of Barbus intermedius sensu Banister, 1973 of Lake Tana in Ethiopia. Russ J Dev Biol. 2010;41(6):369–380. [PubMed] [Google Scholar]
- 26.Shkil F, Kapitanova D, Borisov V, Abdissa B, Smirnov S. Thyroid hormone in skeletal development of cyprinids: effects and morphological consequences. J Appl Ichthyol. 2012;28(3):398–405. [Google Scholar]
- 27.Laudet V. The origins and evolution of vertebrate metamorphosis. Curr Biol. 2011;21(18):R726–R737. [DOI] [PubMed] [Google Scholar]
- 28.Albertson RC, Yan Y-L, Titus TA, et al. Molecular pedomorphism underlies craniofacial skeletal evolution in Antarctic notothenioid fishes. BMC Evol Biol. 2010;10(1):4. [DOI] [PMC free article] [PubMed] [Google Scholar]
- 29.Giovannotti M, Cerioni PN, La Mesa M, Caputo V. Molecular phylogeny of the three paedomorphic Mediterranean gobies (Perciformes: Gobiidae). J Exp Zool B Mol Dev Evol. 2007;308(6):722–729. [DOI] [PubMed] [Google Scholar]
- 30.Johnson DG, Brothers EB. Schindleria: a paedomorphic goby (Teleostei: Aobioidei). Bull Mar Sci. 1993;52(1):441–471. [Google Scholar]
- 31.Hastings PA. Evolution of morphological and behavioral ontogenies in females of a highly dimorphic clade of blennioid fishes. Evolution. 2002;56(8):1644–1654. [DOI] [PubMed] [Google Scholar]
- 32.McCluskey BM, Postlethwait JH. Phylogeny of zebrafish, a “model species,” within Danio, a “model genus”. Mol Biol Evol. 2014;32(3):635–652. [DOI] [PMC free article] [PubMed] [Google Scholar]
- 33.Britz R, Conway KW. Danionella dracula, an escape from the cypriniform Bauplan via developmental truncation? J Morphol. 2016;277(2):147–166. [DOI] [PubMed] [Google Scholar]
- 34.Britz R, Conway KW, Rüber L. Spectacular morphological novelty in a miniature cyprinid fish, Danionella dracula. Proc R Soc Lond Ser B: Biol Sci. 2009;276(1665):2179–2186. [DOI] [PMC free article] [PubMed] [Google Scholar]
- 35.Galindo D, Sweet E, DeLeon Z, et al. 2018. Thyroid hormone modulation during zebrafish development recapitulates evolved diversity in danionin jaw protrusion mechanics. bioRxiv 418483. [DOI] [PMC free article] [PubMed] [Google Scholar]
- 36.McMenamin S, Carter C, Cooper WJ. Thyroid hormone stimulates the onset of adult feeding kinematics in Zebrafish. Zebrafish. 2017;14(6):517–525. [DOI] [PMC free article] [PubMed] [Google Scholar]
- 37.Penalva A, Bedke J, Cook ESB, Barrios JP, Bertram EPL, Douglass AD. 2018. Establishment of the miniature fish species Danionella translucida as a genetically and optically tractable neuroscience model. bioRxiv: 444026. [Google Scholar]
- 38.Schulze L, Henninger J, Kadobianskyi M, et al. Transparent Danionella translucida as a genetically tractable vertebrate brain model. Nat Methods. 2018;15(11):977–983. [DOI] [PubMed] [Google Scholar]
- 39.Kadobianskyi M, Schulze L, Schuelke M, Judkewitz B. 2019. Hybrid genome assembly and annotation of Danionella translucida, a transparent fish with the smallest known vertebrate brain. bioRxiv: 539692. [DOI] [PMC free article] [PubMed] [Google Scholar]
- 40.Coombs S, Bleckmann H, Fay RR, Popper AN. The Lateral Line System. New York: Springer; 2014. [Google Scholar]
- 41.Webb JF. Lateral line morphology and development and implications for the ontogeny of flow sensing in fishes In: Bleckmann H, Mogdans J, Coombs SL, eds. Flow Sensing in Air and Water. Berlin: Springer; 2014:247–270. [Google Scholar]
- 42.Wahnschaffe U, Bartsch U, Fritzsch B. Metamorphic changes within the lateral-line system of Anura. Anat Embryol. 1987;175 (4):431–442. [DOI] [PubMed] [Google Scholar]
- 43.Gelman S, Ayali A, Kiemel T, Sanovich E, Cohen A. Metamorphosis-related changes in the lateral line system of lampreys, Petromyzon marinus. J Comp Physiol A. 2008;194(11):945–956. [DOI] [PubMed] [Google Scholar]
- 44.Harvey R, Blaxter J, Hoyt R. Development of superficial and lateral line neuromasts in larvae and juveniles of plaice (Pleuronectes platessa) and sole (Solea solea). J Mar Biol Assoc UK. 1992;72(3):651–668. [Google Scholar]
- 45.Gisbert E. Early development and allometric growth patterns in Siberian sturgeon and their ecological significance. J Fish Biol. 1999;54(4):852–862. [Google Scholar]
- 46.Gisbert E, Doroshov SI. Allometric growth in green sturgeon larvae. J Appl Ichthyol. 2006;22:202–207. [Google Scholar]
- 47.Osse J, Van den Boogaart J, Van Snik G, Van der Sluys L. Priorities during early growth of fish larvae. Aquaculture. 1997;155(1–4):249–258. [Google Scholar]
- 48.Ledent V. Postembryonic development of the posterior lateral line in zebrafish. Development. 2002;129(3):597–604. [DOI] [PubMed] [Google Scholar]
- 49.Brown DD, Cai L. Amphibian metamorphosis. Dev Biol. 2007; 306(1):20–33. [DOI] [PMC free article] [PubMed] [Google Scholar]
- 50.Kikuyama S, Kawamura K, Tanaka S, Yamamoto K. Aspects of amphibian metamorphosis: hormonal control. Int Rev Cytol. 1993; 145:105–148. [DOI] [PubMed] [Google Scholar]
- 51.Regards E, Taurog A, Nakashima T. Plasma thyroxine and triiodothyronine levels in spontaneously metamorphosing Rana catesbeiana tadpoles and in adult anuran amphibia. Endocrinology. 1978;102(3):674–684. [DOI] [PubMed] [Google Scholar]
- 52.Shi Y-B. Amphibian Metamorphosis. New York: Wiley-Liss; 2000. [Google Scholar]
- 53.Chang J, Wang M, Gui W, Zhao Y, Yu L, Zhu G. Changes in thyroid hormone levels during zebrafish development. Zoolog Sci. 2012;29(3):181–184. [DOI] [PubMed] [Google Scholar]
- 54.Vergauwen L, Cavallin JE, Ankley GT, et al. Gene transcription ontogeny of hypothalamic-pituitary-thyroid axis development in early-life stage fathead minnow and zebrafish. Gen Comp Endocrinol. 2018;266:87–100. [DOI] [PMC free article] [PubMed] [Google Scholar]
- 55.McMenamin S, Chandless M, Parichy D. Working with zebrafish at postembryonic stages. Methods Cell Biol. 2016;134:587–607. [DOI] [PMC free article] [PubMed] [Google Scholar]
- 56.Collazo A, Fraser SE, Mabee PM. A dual embryonic origin for vertebrate mechanoreceptors. Science. 1994;264(5157):426–430. [DOI] [PubMed] [Google Scholar]
- 57.Schneider CA, Rasband WS, Eliceiri KW. NIH Image to ImageJ: 25 years of image analysis. Nat Methods. 2012;9(7):671–675. [DOI] [PMC free article] [PubMed] [Google Scholar]
- 58.Walker M, Kimmel C. A two-color acid-free cartilage and bone stain for zebrafish larvae. Biotech Histochem. 2007;82(1):23–28. [DOI] [PubMed] [Google Scholar]
- 59.Olsen AM, Westneat MW. StereoMorph: an R package for the collection of 3D landmarks and curves using a stereo camera set-up. Methods Ecol Evol. 2015;6(3):351–356. [Google Scholar]
- 60.Adams DC, Otárola-Castillo E. Geomorph: an R package for the collection and analysis of geometric morphometric shape data. Methods Ecol Evol. 2013;4(4):393–399. [Google Scholar]
- 61.Carroll R, Ruppert D, Wand M. Semiparametric Regression. Cambridge: Cambridge University Press; 2003. [Google Scholar]
Associated Data
This section collects any data citations, data availability statements, or supplementary materials included in this article.


