

Abstract
Functional E‐cadherin loss, a hallmark of epithelial‐mesenchymal transition (EMT), is important for metastasis. However, the mechanism of Snail2 in hepatocellular carcinoma (HCC) EMT and metastasis remains unclear. Here, we showed that Snail2 was upregulated in primary HCC, and significantly increased during transforming growth factor‐β‐induced liver cell EMT. Snail2‐overexpressing and knockdown cell lines have been established to determine its function in EMT in HCC. H3K9 methylation was upregulated and H3K4 and H3K56 acetylation were downregulated at the E‐cadherin promoter in Snail2‐overexpressing cancer cells. Furthermore, Snail2 interacted with G9a and histone deacetylases (HDACs) to form a complex to suppress E‐cadherin transcription. Snail2 overexpression enhanced migration and invasion in HCC cells, whereas G9a and HDAC inhibition significantly reversed this effect. Moreover, Snail2 overexpression in cancer cells increased tumor metastasis and shortened survival time in mice, whereas G9a and HDAC inhibitors extended survival. Our study not only reveals a critical mechanism underlying the epigenetic regulation of EMT but also suggests novel treatment strategies for HCC.
Keywords: epithelial‐mesenchymal transition, G9a, HDAC, hepatocellular carcinoma, Snail2
Abbreviations
- EMT
epithelial‐mesenchymal transition
- HCC
hepatocellular carcinoma
- HDAC
histone deacetylase
- RCC
renal cell carcinoma
- SCC
stomach cell carcinoma
- TGF
transforming growth factor
- TSA
trichostatin A
1. INTRODUCTION
Cancer is a major public health problem worldwide and is the second‐leading cause of death.1, 2 Hepatocellular carcinoma is a type of cancer with a high mortality rate, and was the fourth‐leading cause of cancer‐associated death in 2018. Resection is still an available curative treatment option for HCC, but is hampered because of high recurrence rates and the development of metastasis. Metastasis is initiated by a process in which tumor cells disseminate and gain invasive ability, a step referred to as EMT.3
Epithelial‐mesenchymal transition is an essential phenotypic conversion that occurs during embryonic development, tissue remodeling, wound healing, and metastasis.4, 5, 6 During EMT, activated cells gain stem cell‐like features, which provide a distinct advantage for tumor progression and metastasis.7, 8 Following the completion of EMT, the expression of epithelial markers like E‐cadherin is suppressed, whereas mesenchymal markers such as N‐cadherin, vimentin, and fibronectin are upregulated.9 The loss of E‐cadherin expression is heavily involved in EMT, and E‐cadherin is therefore emerging as one regulator of the epithelial phenotype. Suppression of this protein can be mediated through the activities of EMT‐inducing transcription factors such as Twist (TWIST1), Snail (SNAI1), and Snail2 (SLUG), which are known to directly repress transcription from the E‐cadherin promoter.10, 11
Snail1 and Snail2 belong to the Snail superfamily of zinc finger transcriptional repressors that participate in developmental EMT and other processes.12 Snail1 has been reported to induce EMT in MDCK and breast cancer cells by suppressing E‐cadherin expression.13, 14, 15 Moreover, Snail1 can promote cell motility and invasive activity by regulating EMT and enhancing some features of cancer stem cells.16, 17 As a transcriptional repressor similar to Snail1, Snail2 is known to directly repress transcription from the E‐cadherin promoter and thereby promote disassembly of cell‐cell contacts.10 However, few studies have investigated the relationship between Snail and EMT in HCC, and its implications in tumor progression.
Phenotypic and cellular plasticity associated with EMT are determined by a unique gene expression pattern that can be passed on to daughter cells by epigenetic mechanisms through histone modifications.18, 19 Histone modifications, in particular methylation and acetylation, extend the information content of the underlying DNA sequence and confer unique transcriptional potential.18 The most well‐characterized modifications are the methylation of the Lys9 and Lys27 residues of histone H3 (H3K9me2/3 and H3K27me3), which represses gene expression, in addition to the acetylation of H3K4 (H3K4Ac) and H3K9 (H3K9Ac), which are associated with gene activation.20 G9a, a histone H3 lysine 9 (H3K9) methyltransferase,21, 22 has been implicated as an important oncogenic driver in multiple cancers.23, 24, 25 One previous report showed that G9a can interact with Snail1 and DNA methyltransferases to participant in Snail‐mediated E‐cadherin repression in breast cancer.26 G9a was a novel epigenetic target for the treatment of HCC.27 Moreover, G9a promotes liver cancer development by epigenetic silencing of tumor suppressor gene RARRES3.28 Histone deacetylases can facilitate transcriptional repression and the formation of heterochromatin.29 Some studies have reported that, in general, aberrant histone deacetylation modifications are related to cancer.30 It has been reported that HDAC1, 2, and 3 were highly expressed and excessively activated in prostate cancer.31 There is a growing body of evidence showing that the expression of class I HDACs was increased in ovarian carcinomas.32, 33, 34 In HCC, HDAC1 and HDAC2 were correlated with a poor histologic differentiation and a poor prognosis.35 Moreover, pterostilbene suppressed the growth and invasion of HCC and was effective in regulating the levels of the metastasis‐associated protein 1/HDAC1/NuRD complex, promoting PTEN acetylation and apoptosis in HCC.36
In the present study, we investigated the epigenetic program of EMT in HCC by focusing on the transcriptional regulation of E‐cadherin. We found that Snail2 was remarkably increased in primary HCC and highly expressed in TGF‐β‐induced EMT in liver cells. Furthermore, we found that the levels of H3K9 methylation, H3K4 acetylation, and H3K56 acetylation were changed in the promoter region of E‐cadherin. In addition, G9a, HDAC1, HDAC2, and HDAC3 acted together with Snail2 at the E‐cadherin promoter to suppress transcription. Snail2 was found to interact with G9a and HDACs, indicating that they might form a functional complex to repress E‐cadherin expression. We validated that the overexpression of Snail2 significantly enhanced migration and metastatic capacity at the cellular level and in a mouse model. Furthermore, the i.p. administration of Bix‐01294 and TSA both successfully prolonged survival in a mouse model of Snail2‐overexpression cancer. Thus, our studies indicate that Snail2 can interact with G9a and HDACs to mediate the repression of E‐cadherin, thereby promoting migration and invasion in human hepatocellular carcinoma.
2. MATERIALS AND METHODS
2.1. Tissue samples
Cancer tissues and corresponding adjacent noncancerous tissues were obtained from patients who underwent surgical treatment at the China‐Japan Union Hospital of Jilin University, China. All noncancerous samples were obtained from tissues adjacent to, but separate from, the tumors. The use of human specimens in this study was approved by the Ethics Committee at Jilin University. Written informed consent was provided by each patient. Tissue samples were immediately frozen in liquid nitrogen and stored at −80°C until use.
2.2. Cell culture and transfection
All cancer cell lines were grown in DMEM supplemented with 10% FBS, except cell line QSG‐7701, which was grown in RPMI‐1640 plus 10% FBS in a humidified atmosphere and 5% CO2, at 37°C. Cells were purchased from the Cell Bank of Type Culture Collection of the Chinese Academy of Sciences, Shanghai Institute of Cell Biology, Chinese Academy of Sciences. HepG2 cells were infected with a lentivirus expressing EGFP and Snail2 or their control lentivirus (Hanbio, Harbin, China) at an MOI of 10. MHCC‐97H cells were infected with a lentivirus expressing EGFP and Sh‐Snail2 or their control lentivirus (Hanbio) at an MOI of 20. Stable cell lines were selected using puromycin (1 mg/mL, Sigma). The shRNA (Snail2) sequences were 5′‐GATGCATATTCGGACCCACACATTA‐3′ and 5′‐GGACCACAGUGGCUCAGAATT‐3′.
2.3. Quantitative real‐time PCR
Total RNA from tissue samples was isolated with TRIzol (Invitrogen). Quantitative PCR was carried out in the CFX96 Real‐Time PCR Detection System (Bio‐Rad) using TransStart Top Green qPCR SuperMix (Transgen) according to the manufacturer's instructions. Quantitative real‐time PCR data were analyzed using the comparative Ct method, and the expression of target genes was normalized to that of β‐actin.
2.4. Western blotting and Abs
Protein samples were mixed with 4× SDS loading buffer. Samples were boiled for 5 minutes at 98°C, and proteins were separated by Biofuraw Precast Gel (Tanon) and transferred to PVDF membranes. The following primary Abs and dilutions were used: Snail2 mAb (1:100, c‐166467; Santa Cruz Biotechnology), E‐cadherin polyclonal Ab, vimentin polyclonal Ab, fibronectin polyclonal Ab, and GAPDH polyclonal Ab (1:1000, 874‐1‐AP, 15613‐1‐AP, 10366‐1‐AP, 60004‐1‐AP; Proteintech). Secondary Abs were anti‐rabbit or anti‐mouse HRP‐conjugated IgG (1:2000, SA00001‐4; Proteintech). Membranes were incubated with 1 mL ECL western blotting substrate (Promega) for 1 minute at room temperature and then exposed to X‐ray film.
2.5. Chromatin immunoprecipitation assay
Chromatin immunoprecipitation assays were carried out according to the protocol described previously.37 Cells (1 × 10⁷) grown to 80% of confluence were used for each ChIP. H3K9me2 (C15200154, 5 μg/ChIP), H3K4ac (C15410322, 5 μg/ChIP), and H3K56ac (C15410213, 5 μg/ChIP) Abs were purchased from Diagenode (Belgium). The primers for the E‐cadherin promoter were: 5′‐GCCCTTTCTGATCCCAGGTC‐3′ and 5′‐TAGCCTGGAGTTGCTAGGGT‐3′.
2.6. Luciferase assay
For luciferase assays, the Dual‐Luciferase Reporter Assay System (Promega) was used as previously described.38 Briefly, these cells were cotransfected with an E‐cadherin promoter containing luciferase construct together with a plasmid expressing Renilla luciferase (pGL3‐Bisic, Promega). Firefly luciferase activity was normalized to Renilla luciferase activity, which was a control for transfection efficiency. All experiments were undertaken 3 times in triplicate.
2.7. Wound healing assay
Wound healing assays were carried out as described previously.39, 40 Cells were seeded in 6‐well plates (1 × 10⁵ cells/well) and cultured at 37°C. After 24 hours, a pipette tip was used to create a wound in the cell monolayer. The cells were then cultured in DMEM supplemented with 2% FBS at 37°C. Inhibitors, Bix‐01294 (S8006, Selleck) and TSA (S1045, Selleck) if used, were added to the complete medium. The width of the wound was measured under a microscope (DS‐U2, Nikon) 24 hours after the scratch.
2.8. Invasion assay
Invasion assays were carried out as described previously.41, 42 Boyden chambers were coated with Matrigel (BD Biosciences). According to the manufacturer's protocol, cells (5 × 10³) were seeded on Matrigel in the upper chamber, and the bottom chamber was filled with culture medium containing 10% FBS as a chemoattractant. Inhibitors were added to the FBS‐free medium in the upper chamber. Cells that invaded through the Matrigel‐coated membrane after 24 hours were fixed with paraformaldehyde and stained with crystal violet. The fold change in invasion was calculated by dividing the number of cells in HepG2‐Snail2 and MHCC‐97H‐sh‐Snail2 by the number of cells in the control cells. All experiments were undertaken at least twice in triplicate.
2.9. Experimental liver metastasis model
Female BALB/c nude mice (6‐8 weeks old) were purchased from Charles River (Beijing, China). All animal studies were carried out in accordance with legal and institutional guidelines. The procedures were approved by the Ethical Committee for the Care and Use of Laboratory Animals at Jilin University. Mice were injected with HepG2‐Snail2 (1 × 10⁷ cells/mouse) and control cells by s.c. injection (8 mice/group). After 30 days, the mice were killed. Visible liver metastatic nodules were examined macroscopically or embedded in paraffin, sectioned, and subjected to H&E. As for the survival assay, mice were injected with HepG2‐N or HepG2‐Snail2 (5 × 10⁵ cells/mouse) injected into the tail veil (8 mice/group). Bix‐01294 (10 mg/kg) or TSA (5 mg/kg) was given i.p. 3 times a week.
2.10. Statistical analysis
The GraphPad Prism software for Windows (GraphPad Software) was used for all statistical analyses. The results are expressed as mean values ± SD. Significant differences between 2 groups were assessed using paired 2‐tailed Student's t tests. A P value <.05 was considered statistically significant.
3. RESULTS
3.1. Snail2 highly expressed in HCC
To explore the potential role of Snail2 in different carcinomas, we examined the expression level of Snail2 in paired cancerous and corresponding adjacent noncancerous tissues including RCC, SCC, and HCC (Figure 1). We found that the mRNA level of Snail2 in RCC tissues was significantly lower than that in noncancerous tissues. Similarly, the expression level of Snail2 in SCC tissues was slightly lower than in the adjacent noncancerous tissues. In contrast, Snail2 was remarkably upregulated in HCC. Thus, our results suggest that Snail2 might play different functions in diverse carcinomas and that Snail2 might be involved in the tumorigenesis and metastasis of HCC.
Figure 1.
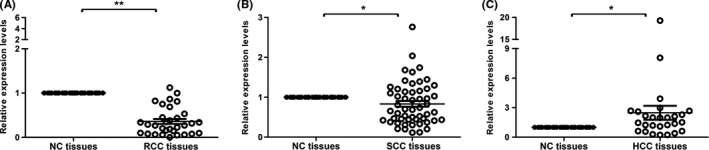
Expression levels of Snail2 in different carcinoma tissues. The expression levels of Snail2 in (A) 33 paired renal cell carcinoma (RCC) tissues and adjacent noncancerous (NC) tissues, (B) 54 paired stomach carcinoma (SCC) tissues) and NC tissues, and (C) 27 paired hepatocellular carcinoma (HCC) tissues and NC tissues were quantified by quantitative real‐time PCR. Data represent the mean ± SD; *P ≤ .05, **P ≤ 0.01
3.2. Snail2 participates in TGF‐β‐induced EMT in liver cells
We next confirmed the function of Snail2 by investigating TGF‐β‐induced EMT in the liver cell line QSG‐7701. We found that treatment with 10 ng/mL TGF‐β1 for 12 days induced QSG‐7701 cells to undergo EMT. As expected, TGF‐β treatment resulted in the acquisition of fibroblastic mesenchymal morphology in the cell line (Figure 2A), which was accompanied by the downregulation of epithelial markers including E‐cadherin and the upregulation of mesenchymal markers including N‐cadherin, vimentin, and fibronectin at the RNA level (Figure 2B) and protein level (Figure 2C) in the model cells. In addition, we also checked the expression level of Snail1 that was downregulation during EMT (Figure 2B). Our results showed that Snail2, but not Snail1, was significantly increased, along with the downregulation of E‐cadherin, in QSG‐7701, indicating that TGF‐β‐induced EMT in liver cells was associated with Snail2 expression.
Figure 2.
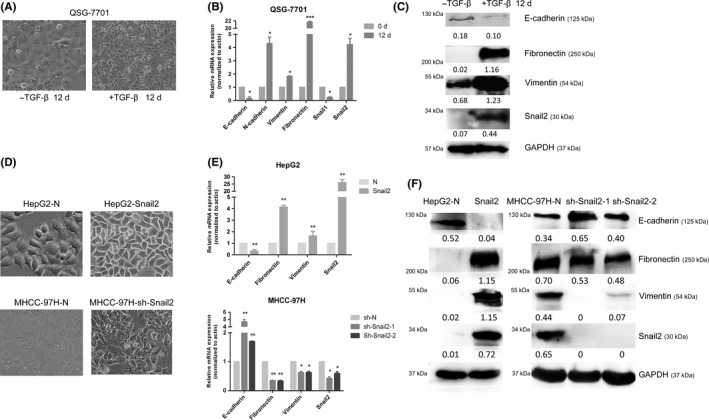
Expression profiles of epithelial and mesenchymal markers during transforming growth factor (TGF)‐β‐induced epithelial‐mesenchymal transition (EMT) in liver cells and the change of cell morphology and expression levels of EMT markers after Snail2 modulation in hepatocellular carcinoma (HCC). A, Liver cell line QSG‐7701 was treated with TGF‐β1 (10 ng/mL) for 12 days; cell morphological changes associated with EMT are shown as phase contrast images taken at 10× magnification. B, QSG‐7701 cell line was treated with TGF‐β1 (10 ng/mL) for the indicated time periods. mRNA levels of genes encoding E‐cadherin, N‐cadherin, fibronectin, vimentin, Snail1, and Snail2 in cells were analyzed by quantitative real‐time PCR and shown as “relative mRNA levels”. Data represent the mean ± SD. *P ≤ .05; **P ≤ .01; ***P ≤ .001. C, Protein levels of E‐cadherin, fibronectin, vimentin, and Snail2 in the cell line were analyzed by western blotting. D, Morphology of HepG2‐Snail2, HepG2‐N cells, MHCC‐97H‐sh‐Snail2, and MHCC‐97H‐N cells, as shown by phase contrast images taken at 20× magnification. E, mRNA levels of genes encoding an epithelial marker (E‐cadherin) and mesenchymal markers (fibronectin and vimentin) were analyzed by quantitative real‐time PCR in these cells lines. F, Protein levels of the epithelial marker (E‐cadherin) and mesenchymal marker (fibronectin) were analyzed by western blotting in these cell lines
3.3. Snail2 induces EMT in HCC cells
To validate the function of Snail2 in EMT in HCC cells, we further established stable Snail2‐overexpressing cell lines using poorly metastatic HepG2 cells (designated as HepG2‐Snail2) and also knocked down the expression level of Snail2 in the highly metastatic MHCC‐97H cells (designated as MHCC‐97H‐sh‐Snail2). We found that the HepG2‐Snail2 cell line showed a fibroblastic, mesenchymal morphology, which was not apparent in respective control cells (that had an epithelial phenotype) (Figure 2D). Snail2 knockdown in MHCC‐97H cell lines resulted in the acquisition of epithelial morphology (Figure 2D). This observation was also confirmed by quantitative PCR and western blot analyses of the expression levels of an epithelial marker (E‐cadherin) and mesenchymal markers (fibronectin and vimentin) (Figure 2E). We found that Snail2 overexpression in the HepG2 cell line significantly decreased the expression of E‐cadherin, and increased the expression of fibronectin and vimentin (Figure 2F). In contrast, silencing Snail2 in MHCC‐97H cells resulted in the upregulation of E‐cadherin and the downregulation of fibronectin and vimentin (Figure 2F). These findings supported that Snail2 could induce EMT in HCC cell lines.
3.4. Snail2 regulates E‐cadherin expression through H3K9 methylation and H3K4 and H3K56 deacetylation
Chromatin modifications, including histone methylation and deacetylation, play crucial roles in suppressing gene expression. To determine whether Snail2 can epigenetically regulate the expression of E‐cadherin, we examined levels of repressive histone modifications at the E‐cadherin promoter using ChIP assays. As one of the most important repressive modifications, the H3K9me2 euchromatic histone methylation marker was remarkably upregulated at the E‐cadherin promoter in HepG2‐Snail2 cells (Figure 3A). Furthermore, a significant reduction of H3K4ac and H3K56ac markers at the E‐cadherin promoter was detected in the HepG2‐Snail2 cell line (Figure 3A). These results suggest that Snail2 might repress the expression of E‐cadherin by mediating H3K9 methylation, as well as H3K4 and H3K56 deacetylation, in the promoter region.
Figure 3.
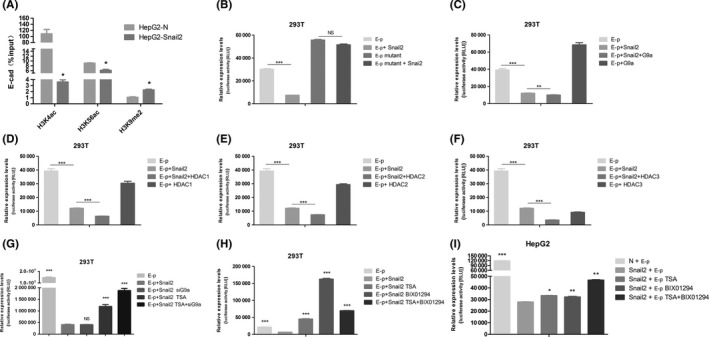
Epigenetic modifications at the promoter of E‐cadherin in Snail2‐overexpressing cell line and the function of Snail2, G9a, and histone deacetylases (HDACs) on the activity of E‐cadherin promoter. A, Levels of H3K9 dimethylation (H3K9me2), H3K4 acetylation (H3K4ac), and H3K56 acetylation (H3K56ac) at the promoter of E‐cadherin in the HepG2‐Snail2 cell lines, as well as their respective control cell lines, were assessed by ChIP. “Percentage of input” indicates the ratio of the DNA fragment of each promoter region bound by H3K9me2, H3K4ac, and H3K56ac, to the total amount of input DNA without H3K9me2‐, H3K4ac‐, and H3K56ac‐specific Ab pull‐down. *P ≤ .05; **P ≤ .01; ***P ≤ .001, based on Student's t test. All results are from 3 independent experiments. Data represent the mean ± SD. Luciferase reporter assays were carried out in 293T cells (B) co‐transfected with a plasmid harboring the E‐cadherin promoter or E‐cadherin promoter mutant and a plasmid expressing Snail2, (C) cotransfected with a plasmid expressing Snail2 or G9a and a plasmid harboring the E‐cadherin promoter, (D) cotransfected with a plasmid expressing Snail2 or HDAC1 and a plasmid harboring the E‐cadherin promoter, (E) cotransfected with a plasmid expressing Snail2 or HDAC2 and a plasmid harboring the E‐cadherin promoter, (F) cotransfected with a plasmid expressing Snail2 or HDAC3 and a plasmid harboring the E‐cadherin promoter, (G) cotransfected with a plasmid expressing Snail2 and a plasmid harboring the E‐cadherin promoter, and siRNA for G9a, and were treated with trichostatin A (TSA) (1 μmol/L), (H) cotransfected with a plasmid expressing Snail2 and a plasmid harboring the E‐cadherin promoter, and were treated with Bix‐01294 (5 μmol/L) or TSA (1 μmol/L). I, Luciferase reporter assays were carried out in HepG2‐Snail2 cells that were transfected with a plasmid harboring the E‐cadherin promoter and treated with Bix‐01294 (5 μmol/L) or TSA (1 μmol/L). Luciferase activity was assayed 24 h later and normalized to that of Renilla (pRL‐SV40), which served as an internal control. Each data point represents the mean ± SD. Experiments were undertaken twice in triplicate. E‐p, pGL3‐basic vector
3.5. G9a and HDACs are required for Snail2‐mediated repression of E‐cadherin in HCC
To further investigate the cofactors involved in Snail2‐mediated repression of E‐cadherin, a truncated E‐cadherin promoter region (−108 bp to +126 bp) was subcloned into the pGL3‐basic vector (designated as E‐p). As shown in Figure 3B, in contrast to that in control cells, cotransfecting pGL3‐basic and Snail2 significantly reduced luciferase activity from the E‐cadherin promoter in HEK293T cells. This repression was not observed if the E‐box of the E‐cadherin promoter was mutated, indicating that Snail2 can repress E‐cadherin promoter activity by interacting with the E‐box domain. In addition, the overexpression of histone H3K9 methyltransferase G9a reduced luciferase activity compared to that in Snail2‐overexpressing cells. However, we could not detect any reduction in the luciferase activity when G9a alone was overexpressed, indicating that Snail2 mediates the interaction between G9a and the E‐cadherin promoter (Figure 3C). We also found that histone deacetylases, including HDAC1, HDAC2, and HDAC3, could all remarkably suppress the activity of the E‐cadherin promoter and these repressive effects also required Snail2 (Figure 3D‐F).
Furthermore, to confirm the repressive function of G9a and HDACs on the E‐cadherin promoter, we treated Snail2‐overexpressing cells with the G9a inhibitor Bix‐01294 and the HDAC inhibitor TSA. As expected, siG9a and TSA treatment significantly rescued the Snail2‐mediated repression of E‐cadherin promoter, suggesting that the Snail2‐mediated transcriptional inhibition of E‐cadherin is facilitated by G9a and HDACs (Figure 3G). Moreover, Bix‐01294 or TSA treatment also significantly rescued the Snail2‐mediated repression of E‐cadherin promoter, suggesting that the Snail2‐mediated transcriptional inhibition of E‐cadherin is facilitated by G9a and HDACs (Figure 3H). Furthermore, we determined whether G9a and HDACs cooperate to repress E‐cadherin in HCC. In the HepG2 cell line, inhibition of G9a or HDACs alone slightly upregulated activity of the E‐cadherin promoter compared to that in Snail2‐overexpressing cells, whereas inhibition of both simultaneously remarkably rescued the Snail2‐mediated repression of E‐cadherin promoter (Figure 3I). Taken together, our results indicated that G9a and HDACs are required for Snail2‐mediated repression of E‐cadherin in HCC.
3.6. Snail2 interacts with G9a, HDAC1, HDAC2, and HDAC3 to form a functional multicomplex
The involvement of Snail2, G9a, and HDACs in the transcriptional inhibition of E‐cadherin suggests that these molecules might interact with each other. To identify the specific domain within G9a that is responsible for the interaction with Snail2, we generated 2 truncated G9a proteins and coexpressed each of them with Snail2 in HEK293T cells (Figure 4A). The results showed that the G9a deletion mutant containing ankyrin repeats and the C‐terminal SET domain (G9a‐CD) retained the ability to interact with Snail2 (Figure 4B). However, another mutant containing the N‐terminal region without these identified domains (G9a‐ND) was not able to bind Snail2. We also generated a series of Snail2 deletion mutants to examine which domain of Snail2 is responsible for its interaction with G9a. We found that a Snail2 mutant harboring only the N‐terminal region did not interact with G9a, indicating that the C‐terminus of Snail2 is necessary for G9a binding (Figure 4B). We also successfully detected the interaction between Snail2 and HDAC1/HDAC2/HDAC3 in vitro (Figure 4C). Moreover, our results indicated that G9a can also interact with HDAC1, HDAC2, and HDAC3 in vitro (Figure 4D). To further extend our findings in the HCC cell line, we undertook coimmunoprecipitation experiments in the HepG2‐Snail2 cell line and found that endogenous G9a, HDAC1, HDAC2, and HDAC3 were selectively coimmunoprecipitated using specific Abs to Snail2, revealing the existence of the Snail2‐G9a‐HDACs complex in vivo (Figure 4E). Hence, these observations together indicated that Snail2 can interact with G9a, HDAC1, and HDAC3 to form a multicomplex that participates in the transcriptional inhibition of E‐cadherin.
Figure 4.
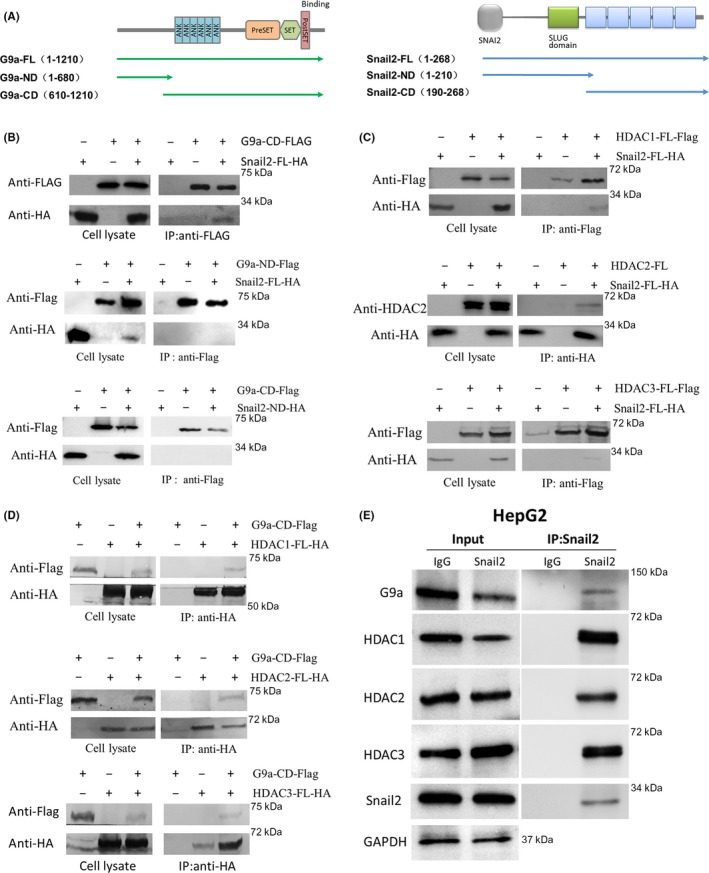
Interactions between Snail2, G9a, and histone deacetylases (HDACs). A, Schematic diagram showing the structure of G9a, Snail2, and their different deletion constructs. B, Coimmunoprecipitation assays were carried out in 293T cells transiently coexpressing plasmids encoding Flag‐tagged deletion mutants (designated CD and ND) of G9a and HA‐tagged Snail2‐FL. Extracts were immunoprecipitated with Flag Abs, and bound Snail2 was examined by western blotting. C, Coimmunoprecipitation assays carried out on cells transiently coexpressing Flag‐tagged HDAC1, HDAC2, Flag‐tagged HDAC3, and HA‐tagged Snail2. Cell extracts were immunoprecipitated separately with Flag or HA Abs, and bound Snail2 or HDAC2 were examined by western blotting. D, Coimmunoprecipitation assays in cells transiently coexpressing Flag‐tagged G9a‐CD and HA‐tagged HDACs; cell extracts were immunoprecipitated separately with HA Abs, and bound G9a‐CD was examined by western blotting. E, Coimmunoprecipitation assays carried out in HepG2‐Snail2. Cell extracts were immunoprecipitated separately with Snail2 Abs, and bound endogenous G9a and HDACs were examined by western blotting
3.7. G9a and HDACs mediate the migration‐, invasion‐, and metastasis‐promoting properties of Snail2 in HCC cells
Because G9a and HDACs are required for the Snail2‐mediated repression of E‐cadherin in HCC cells, we next investigated their cooperative functions with respect to the invasion and metastasis of HCC. Compared to those in control cells, the overexpression of Snail2 in HepG2 cells significantly increased the cell migratory ability (Figure 5A). In contrast, the downregulation of Snail2 in MHCC‐97H cells remarkably reduced the rate of migration (Figure 5B). We then treated these cell lines with the G9a inhibitor Bix‐01294 and the HDAC inhibitor TSA and further compared migration to those in untreated cells. Our results showed that G9a inhibition significantly reduced the migratory capacity of HepG2‐Snail2 and MHCC‐97H‐sh‐Snail2 cell lines (Figure 5A,B). The functional suppression of G9a and HDAC activity also markedly reduced the rate of invasion in HepG2‐Snail2 cells (Figure 5C). Thus, these data indicated that G9a and HDACs cooperate with Snail2 to enhance the migration and invasion of HCC cells in vitro.
Figure 5.
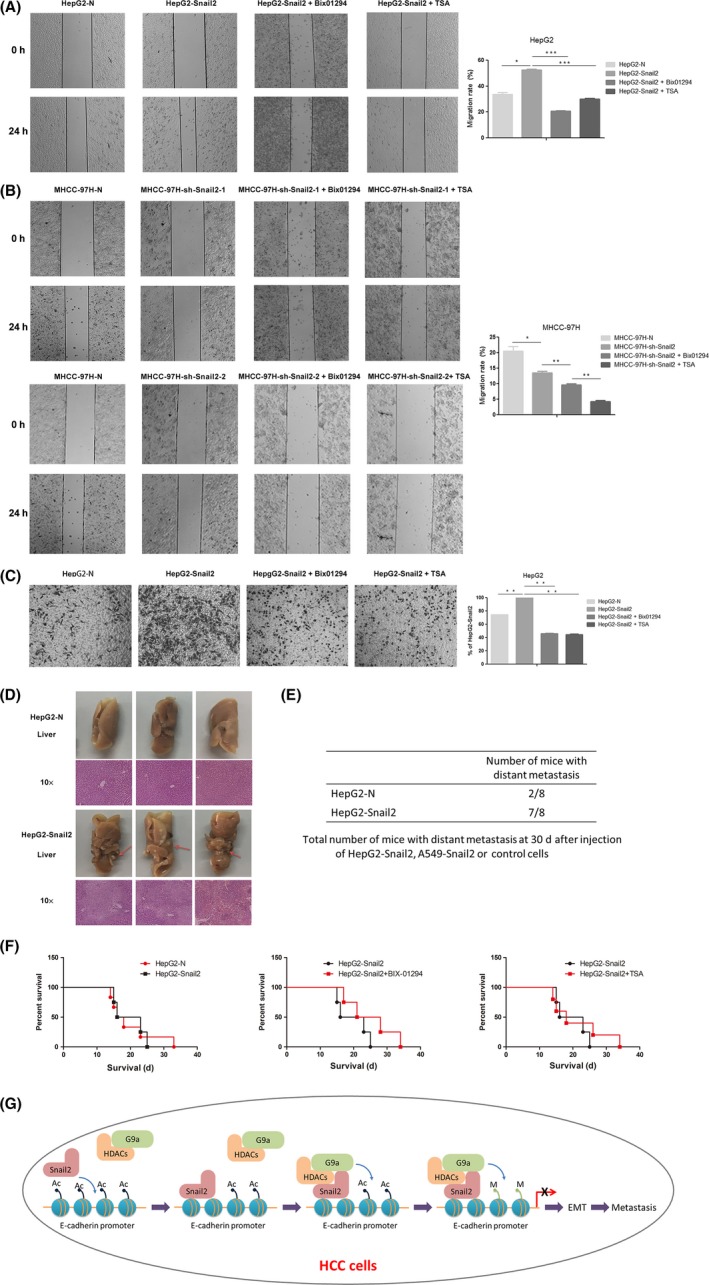
Functions of Snail2, G9a, and histone deacetylases (HDACs) facilitate migration, invasion, and metastasis. A, Migratory ability of HepG2‐N cells, HepG2‐Snail2 cells, and HepG2‐Snail2 cells treated with Bix‐01294, and HepG2‐Snail2 cells treated with trichostatin A (TSA), as analyzed by wound healing assays. B, Migratory ability of MHCC‐97H‐N cells, MHCC‐97H‐sh‐Snail2 cells, MHCC‐97H‐sh‐Snail2 cells treated with Bix‐01294, and MHCC‐97H‐sh‐Snail2 cells treated with TSA, as analyzed by wound healing assays. C, Invasiveness of HepG2‐N cells, HepG2‐Snail2 cells, HepG2‐Snail2 cells treated with Bix‐01294, and HepG2‐Snail2 cells treated with TSA, as analyzed by Transwell invasion assays. Statistical analysis of invasion is shown in the bar graph (mean ± SD from 3 independent experiments), and a representative experiment is shown in the right panel. Phase contrast images were taken at 4× magnification. D, HepG2‐Snail2 cells and control cells were subcutaneously injected into nude mice. After 30 d, mice were killed and the liver was dissected. Liver metastatic nodules were examined macroscopically or paraffin‐embedded sections were subjected to H&E. Arrows indicate liver metastases. Phase contrast images were taken at 4× magnification. E, Total number of mice with distant metastasis 30 d after injection of HepG2‐Snail2 or respective control cells. F, A total of 5 × 10⁵ HepG2‐Snail2 and control cells were injected into the tail veil of nude mice. Metastasis was suppressed by Bix‐01294 or TSA treatment 4 wk after injection. The survival time of mice was analyzed by Kaplan‐Meier survival analysis. G, A proposed working model of the role of the Snail2/G9a/HDAC complex in epithelial‐mesenchymal transition (EMT) and tumor metastasis in hepatocellular carcinoma (HCC)
Furthermore, we extended our findings to a xenograft model of metastasis, in which HCC cells are s.c. injected into mice to generate hepatic and pulmonary metastases. HepG2‐Snail2 and respective control cells were injected into nude mice to investigate the tumorigenic and metastatic potential of these cells. We noticed that mice injected with HepG2‐Snail2 cells had an increased number of liver metastases, compared to that observed in HepG2‐N‐injected mice (Figure 5D). In addition, we used an experimental metastasis model, in which tumor cells were directly injected into the tail veil of nude mice, to confirm these findings. Results showed that the overexpression of Snail2 in HCC remarkably increased distant metastasis in mice, indicating that this factor can promote HCC migration and invasion in vivo (Figure 5E). To further explore the role of G9a and HDACs in Snail2‐mediated HCC invasion and metastasis, we examined the survival time of mice treated with the G9a inhibitor Bix‐01294 and the HDAC inhibitor TSA. Although the overexpression of Snail2 in HepG2 cells only marginally affected survival time in mice (injected with cells), Bix‐01294 and TSA treatment both successfully increased survival time, compared to that observed in control mice harboring HepG2‐Snail2 tumors (Figure 5F). Together, our results confirmed that G9a and HDACs facilitate the Snail2‐mediated migration, invasion, and metastasis of HCC cells in vivo.
4. DISCUSSION
Our study provides several insights into the epigenetic program that underlies EMT and metastasis in HCC. In this study, we investigated the clinical significance of Snail2 in HCC and determined the mechanism associated with the ability of Snail2 to promote TGF‐β‐induced EMT and tumor metastasis, showing that Snail2 interacts with G9a and HDACs to repress E‐cadherin expression.
In previous studies, Snail family proteins were shown to participate in EMT in diverse carcinomas.5, 43 It has been reported that Snail1 can combine with the competitive displacement of ASCL2 and epigenetic mechanisms to rapidly silence expression of the EPHB3 tumor suppressor in colorectal carcinomas.44 In addition, Snail1 can interact with G9a to mediate E‐cadherin repression in human breast cancer.27 Furthermore, it has been shown that Snail2 promotes tumor invasion.45 JMJD3 upregulates Snail2 to promote migration and invasion in HCC.46 However, the mechanism through which Snail2 controls E‐cadherin silencing in malignant carcinomas remains undefined. In the present study, we first confirmed the importance of Snail2 in EMT in malignant tumors. We found that Snail2 is significantly upregulated in HCC tissues. Consistent with this finding, Snail2 was remarkably increased during TGF‐β‐induced EMT in liver cells. Overexpression of this factor induced EMT in cancer cells, whereas knockdown resulted in the reversion from a fibroblast‐like morphology to an epithelial phenotype in cancer cells, indicating that Snail2 is required for HCC of EMT.
Epigenetic regulation has been suggested to be involved in EMT in different carcinomas. A previous study showed that DOT1L cooperated with the c‐Myc‐p300 complex to epigenetically repress E‐cadherin transcription factors during breast cancer progression.47 In addition, UTX was found to inhibit EMT‐induced breast cancer stem cell properties, through the epigenetic repression of EMT‐associated genes, in cooperation with LSD1 and HDAC1.48 Furthermore, it has been found that G9a can interact with Snail1 and DNA methyltransferases to participate in Snail‐mediated E‐cadherin repression in breast cancer.27 In our study, we showed that Snail2 interacted with G9a and HDACs to form a multiprotein complex at the promoter of E‐cadherin. Furthermore, G9a and HDACs were found to catalyze H3K9 dimethylation and H3K56/H3K4 deacetylation at the E‐cadherin promoter, and finally trigger EMT in HCC cells. Hence, different transcriptional repressive factors associated with EMT adopt diverse mechanisms to regulate tumor metastasis. Similar transcription factors in the same protein family, such as Snail1 and Snail2, might also utilize different mechanisms to regulate the metastasis of malignant carcinomas.
We further investigated the necessity of G9a and HDACs during Snail2‐mediated migration and metastasis in cancer cells in vitro and in vivo. Overexpression of Snail2 remarkably enhanced migration, invasion, and metastasis in the HCC cell line. However, functional G9a and HDACs inhibition significantly reversed these effects. Furthermore, mice injected with Snail2‐overexpressing cancer cells showed obviously increased tumor metastasis and shortened survival. Nevertheless, G9a or HDAC inhibitor treatment successfully improved survival time in mice harboring Snail2‐overexpressing cancer cells. These data collectively suggest that Snail2 can enhance HCC metastasis and that G9a and HDACs are both crucial for the suppression of E‐cadherin in these cells, indicating that the epigenetic program might represent a therapeutic target for the treatment of aggressive and metastatic tumors.
Taken together, we propose a working model of the regulation of EMT and metastasis by the Snail2/G9a/HDAC complex in HCC (Figure 5G). First, Snail2 is highly expressed in HCC cells. Second, Snail2 recruits G9a and HDACs to form a multiprotein complex that induces H3K9 methylation and H3K56/H3K4 deacetylation at the promoter of E‐cadherin. Finally, G9a and HDACs could facilitate Snail2 to promote the migration and metastasis of liver cancer cells. In all, our study highlights the importance of G9a‐ and HDAC‐mediated epigenetic regulation during Snail2‐induced E‐cadherin repression and tumor metastasis during HCC progression. Accordingly, blocking interactions among Snail2, G9a, and HDACs or targeting this axis might form the basis of new therapeutic strategies that target metastatic HCC.
DISCLOSURE
The authors declare that they have no competing interests.
ACKNOWLEDGMENTS
This work was supported by the National Natural Science Foundation of China (Grant No. 81301803) and China Postdoctoral Science Foundation (Grant No. 2019TQ0114).
Hu Y, Zheng Y, Dai M, et al. G9a and histone deacetylases are crucial for Snail2‐mediated E‐cadherin repression and metastasis in hepatocellular carcinoma. Cancer Sci. 2019;110:3442–3452. 10.1111/cas.14173
Funding information
China Postdoctoral Science Foundation, Grant/Award Number: 2019TQ0114; National Natural Science Foundation of China, Grant/Award Number: 81301803
Contributor Information
Hui Wu, Email: topwuhui@jlu.edu.cn.
Xianghui Yu, Email: xianghui@jlu.edu.cn.
REFERENCES
- 1. Siegel RL, Miller KD, Jemal A. Cancer statistics. CA Cancer J Clin. 2018;68:7‐30. [DOI] [PubMed] [Google Scholar]
- 2. Chen W, Zheng R, Baade PD, et al. Cancer statistics in China, 2015. CA Cancer J Clin 2016;66(2):115‐132. [DOI] [PubMed] [Google Scholar]
- 3. Nguyen DX, Bos PD, Massague J. Metastasis: from dissemination to organ‐specific colonization. Nat Rev Cancer. 2009;9:274‐284. [DOI] [PubMed] [Google Scholar]
- 4. Kalluri R, Weinberg RA. The basics of epithelial‐mesenchymal transition. J Clin Invest. 2009;119(6):1420‐1428. [DOI] [PMC free article] [PubMed] [Google Scholar]
- 5. Thiery JP, Acloque H, Huang RY, Nieto MA. Epithelial‐mesenchymal transitions in development and disease. Cell. 2009;139(5):871‐890. [DOI] [PubMed] [Google Scholar]
- 6. Wu Y, Zhou BP. Snail: more than EMT. Cell Adh Migr. 2010;4(2):199‐203. [DOI] [PMC free article] [PubMed] [Google Scholar]
- 7. Mani SA, Mani SA, Guo W, et al. The epithelial‐mesenchymal transition generates cells with properties of stem cells. Cell. 2008;133(4):704‐715. [DOI] [PMC free article] [PubMed] [Google Scholar]
- 8. Polyak K, Weinberg RA. Transitions between epithelial and mesenchymal states: acquisition of malignant and stem cell traits. Nat Rev Cancer. 2009;9(4):265‐273. [DOI] [PubMed] [Google Scholar]
- 9. Peinado H, Olmeda D, Cano A. Snail, Zeb and bHLH factors in tumour progression: an alliance against the epithelial phenotype? Nat Rev Cancer. 2007;7:415‐428. [DOI] [PubMed] [Google Scholar]
- 10. Hajra KM, Chen DYS, Fearon ER. The SLUG zinc‐finger protein represses Ecadherin in breast cancer. Can Res. 2002;62(6):1613‐1618. [PubMed] [Google Scholar]
- 11. Ye Y, Xiao Y, Wang W, et al. ER alpha signaling through slug regulates E‐cadherin and EMT. Oncogene. 2010;29(10):1451‐1462. [DOI] [PubMed] [Google Scholar]
- 12. Barrallo‐Gimeno A, Nieto MA. The Snail genes as inducers of cell movement and survival: implications in development and cancer. Development. 2005;132:3151‐3161. [DOI] [PubMed] [Google Scholar]
- 13. Batlle E, Sancho E, Francí C, et al. The transcription factor snail is a repressor of E‐cadherin gene expression in epithelial tumour cells. Nat Cell Biol. 2000;2(2):84‐89. [DOI] [PubMed] [Google Scholar]
- 14. Cano A. The transcription factor snail controls epithelial‐mesenchymal transitions by repressing E‐cadherin expression. Nat Cell Biol. 2000;2(2):76‐83. [DOI] [PubMed] [Google Scholar]
- 15. Zhou BP. Dual regulation of Snail by GSK‐ 3beta‐mediated phosphorylation in control of epithelial‐ mesenchymal transition. Nat Cell Biol. 2004;6(10):931‐940. [DOI] [PubMed] [Google Scholar]
- 16. Wu D, Zhao B, Qi X. Nogo‐B receptor promotes epithelial‐mesenchymal transition in non‐small cell lung cancer cells through the Ras/ERK/Snail1 pathway. Cancer Lett. 2018;418:135‐146. [DOI] [PMC free article] [PubMed] [Google Scholar]
- 17. Maturi V, Morén A, Enroth S. Genomewide binding of transcription factor Snail1 in triple‐negative breast cancer cells. Mol Oncol. 2018;12(7):1153‐1174. [DOI] [PMC free article] [PubMed] [Google Scholar]
- 18. Campos EI, Reinberg D. Histones: annotating chromatin. Annu Rev Genet. 2009;43:559‐599. [DOI] [PubMed] [Google Scholar]
- 19. Cedar H, Bergman Y. Linking DNA methylation and histone modification: patterns and paradigms. Nat Rev Genet. 2009;10(5):295‐304. [DOI] [PubMed] [Google Scholar]
- 20. Shi Y. Histone lysine demethylases: emerging roles in development, physiology and disease. Nat Rev Genet. 2007;8(11):829‐833. [DOI] [PubMed] [Google Scholar]
- 21. Casciello F, Windloch K, Gannon F, Lee JS. Functional role of G9a histone methyltransferase in cancer. Front Immunol. 2015;6:487. [DOI] [PMC free article] [PubMed] [Google Scholar]
- 22. Shinkai Y, Tachibana M. H3K9 methyltransferase G9a and the related molecule GLP. Genes Dev. 2011;25(8):781‐788. [DOI] [PMC free article] [PubMed] [Google Scholar]
- 23. Huang J, Dorsey J, Chuikov S, et al. G9a and Glp methylate lysine 373 in the tumor suppressor p53. J Biol Chem. 2010;285(13):9636‐9641. [DOI] [PMC free article] [PubMed] [Google Scholar]
- 24. Chen MW, Hua KT, Kao HJ. H3K9 histone methyltransferase G9a promotes lung cancer invasion and metastasis by silencing the cell adhesion molecule Ep‐CAM. Cancer Res. 2010;70(20):7830‐7840. [DOI] [PubMed] [Google Scholar]
- 25. Chen MW, Hua KT, Kao HJ, et al. Enhanced expression of EHMT2 is involved in the proliferation of cancer cells through negative regulation of SIAH1. Neoplasia. 2011;13(8):676‐684. [DOI] [PMC free article] [PubMed] [Google Scholar]
- 26. Dong C, Wu Y, Yao J, et al. G9a interacts with Snail and is critical for Snail‐mediated E‐cadherin repression in human breast cancer. J Clin Invest. 2012;122(4):1469‐1486. [DOI] [PMC free article] [PubMed] [Google Scholar]
- 27. Wei L, Chiu DK, Tsang FH, et al. Histone methyltransferase G9a promotes liver cancer development by epigenetic silencing of tumor suppressor gene RARRES3. J Hepatol. 2017;67(4):758‐769. [DOI] [PubMed] [Google Scholar]
- 28. Yokoyama M, Chiba T, Zen Y, et al. Histone lysine methyltransferase G9a is a novel epigenetic target for the treatment of hepatocellular carcinoma. Oncotarget. 2017;8(13):21315‐21326. [DOI] [PMC free article] [PubMed] [Google Scholar]
- 29. Jovanovic J, Ronneberg JA, Tost J, Kristensen V. The epigenetics of breast cancer. Mol Oncol. 2010;4(3):242‐254. [DOI] [PMC free article] [PubMed] [Google Scholar]
- 30. Yue H, Dai M, Zheng Y, et al. Epigenetic suppression of E‐cadherin expression by Snail2 during the metastasis of colorectal cancer. Clin Epigenetics. 2018;10:154. [DOI] [PMC free article] [PubMed] [Google Scholar]
- 31. Weichert W, Röske A, Gekeler V, et al. Histone deacetylases 1, 2 and 3 are highly expressed in prostate cancer and HDAC2 expression is associated with shorter PSA relapse time after radical prostatectomy. Br J Cancer. 2008;98:604‐610. [DOI] [PMC free article] [PubMed] [Google Scholar]
- 32. Jin KL, Pak JH, Park JY, et al. Expression profile of histone deacetylases 1, 2 and 3 in ovarian cancer tissues. J Gynecol Oncol. 2008;19:185‐190. [DOI] [PMC free article] [PubMed] [Google Scholar]
- 33. Weichert W, Denkert C, Noske A, et al. Expression of class I histone deacetylases indicates poor prognosis in endometrioid subtypes of ovarian and endometrial carcinomas. Neoplasia. 2008;10:1021‐1027. [DOI] [PMC free article] [PubMed] [Google Scholar]
- 34. Kim A, Ueda Y, Naka T, Enomoto T. Therapeutic strategies in epithelial ovarian cancer. J Exp Clin Cancer Res. 2012;13:14. [DOI] [PMC free article] [PubMed] [Google Scholar]
- 35. Wang H, Kohashi K, Yoshizumi T, et al. Coexpression of SALL4 with HDAC1 and/or HDAC2 is associated with underexpression of PTEN and poor prognosis in patients with hepatocellular carcinoma. Hum Pathol. 2017;64:69‐75. [DOI] [PubMed] [Google Scholar]
- 36. Qian YY, Liu ZS, Yan HJ, Yuan YF, Levenson AS, Li K. Pterostilbene inhibits MTA1/HDAC1 complex leading to PTEN acetylation in hepatocellular carcinoma. Biomed Pharmacother. 2018;101:852‐859. [DOI] [PubMed] [Google Scholar]
- 37. Boyer LA, Plath K, Zeitlinger J, et al. Polycomb complexes repress developmental regulators in murine embryonic stem cells. Nature. 2006;441(7091):349‐353. [DOI] [PubMed] [Google Scholar]
- 38. Hossan T, Nagarajan S, Baumgart SJ, et al. Histone chaperone SSRP1 is essential for Wnt signaling pathway activity during osteoblast differentiation. Stem Cells. 2016;34:1369‐1376. [DOI] [PubMed] [Google Scholar]
- 39. Shimada H, Abe S, Kohno T, et al. Loss of tricellular tight junction protein LSR promotes cell invasion and migration via upregulation of TEAD1/AREG in human endometrial cancer. Sci Rep. 2017;10(7):37049. [DOI] [PMC free article] [PubMed] [Google Scholar]
- 40. Di L, Yao Q, Zhan C, et al. MicroRNA‐146a promote cell migration and invasion in human colorectal cancer via carboxypeptidase M/src‐FAK pathway. Oncotaget. 2017;8(14):22674‐22684. [DOI] [PMC free article] [PubMed] [Google Scholar]
- 41. Tiwari A, Pattnaik N. Increased FSHD region gene1 expression reduces in vitro cell migration, invasion, and angiogenesis, ex vivo supported by reduced expression in tumors. Biosci Rep. 2017;37(5), pii:BSR20171062 10.1042/BSR20171062 [DOI] [PMC free article] [PubMed] [Google Scholar]
- 42. Verma S, Pal R, Gupta SK. Decrease in invasion of HTR‐8/SVneo trophoblastic cells by interferon gamma involves cross‐communication of STAT1 and BATF2 that regulates the expression of JUN. Cell Adh Migr. 2018;20:1‐15. [DOI] [PMC free article] [PubMed] [Google Scholar]
- 43. Yang J, Weinberg RA. Epithelial‐mesenchymal transition: at the crossroads of development and tumor metastasis. Dev Cell. 2008;14(6):818‐829. [DOI] [PubMed] [Google Scholar]
- 44. Rönsch K, Jägle S, Rose K, et al. SNAIL1 combines competitive displacement of ASCL2 and epigenetic mechanisms to rapidly silence the EPHB3 tumor suppressor in colorectal cancer. Mol Oncol. 2015;9(2):335‐354. [DOI] [PMC free article] [PubMed] [Google Scholar]
- 45. Shih JY, Tsai MF, Chang TH, et al. Transcription repressor slug promotes carcinoma invasion and predicts outcome of patientswith lung adenocarcinoma. Clin Cancer Res. 2005;11(22):8070‐8078. [DOI] [PubMed] [Google Scholar]
- 46. Tang B, Qi G, Tang F, et al. Aberrant JMJD3 expression upregulates slug to promote migration, invasion, and stem cell‐like behaviors in hepatocellular carcinoma. Cancer Res. 2016;76(22):6520‐6532. [DOI] [PubMed] [Google Scholar]
- 47. Cho MH, Park JH, Choi H, et al. DOT1L cooperates with the c‐Myc‐p300 complex to epigenetically derepress CDH1 transcription factors in breast cancer progression. Nat Commun. 2015;6:7821. [DOI] [PMC free article] [PubMed] [Google Scholar]
- 48. Choi HJ, Park JH, Park M. UTX inhibits EMT‐induced breast CSC properties by epigenetic repression of EMT genes in cooperation with LSD1 and HDAC1. EMBO Rep. 2015;16(10):1288‐1298. [DOI] [PMC free article] [PubMed] [Google Scholar]