Significance
The Amazon is the largest terrestrial contributor to global atmospheric carbon fluxes, but it has been debated whether photosynthesis in the Amazonian forest increases during the dry season. We now report new evidence that there is a dry-season increase in photosynthesis in the Amazon rainforest, using observations of solar-induced chlorophyll fluorescence from the Tropospheric Monitoring Instrument (TROPOMI), which has been shown to be a promising proxy of photosynthesis. The new findings point the way toward future research that addresses the implications of Amazonian seasonality on the global carbon cycle.
Keywords: photosynthesis, productivity, MODIS, EVI, geometry
Abstract
Photosynthesis of the Amazon rainforest plays an important role in the regional and global carbon cycles, but, despite considerable in situ and space-based observations, it has been intensely debated whether there is a dry-season increase in greenness and photosynthesis of the moist tropical Amazonian forests. Solar-induced chlorophyll fluorescence (SIF), which is emitted by chlorophyll, has a strong positive linear relationship with photosynthesis at the canopy scale. Recent advancements have allowed us to observe SIF globally with Earth observation satellites. Here we show that forest SIF did not decrease in the early dry season and increased substantially in the late dry season and early part of wet season, using SIF data from the Tropospheric Monitoring Instrument (TROPOMI), which has unprecedented spatial resolution and near-daily global coverage. Using in situ CO2 eddy flux data, we also show that cloud cover rarely affects photosynthesis at TROPOMI’s midday overpass, a time when the forest canopy is most often light-saturated. The observed dry-season increases of forest SIF are not strongly affected by sun-sensor geometry, which was attributed as creating a pseudo dry-season green-up in the surface reflectance data. Our results provide strong evidence that greenness, SIF, and photosynthesis of the tropical Amazonian forest increase during the dry season.
It has been heavily debated among the remote sensing and ecological research communities whether there is a dry-season green-up and increase in photosynthesis of the moist tropical Amazon forest (1–5). The answer to this question has important implications for understanding Earth’s carbon fluxes and the impact of climate variability and climate change on those fluxes. However, a resolution to this debate has been delayed due to arguments that the geometry between the satellite sensors and the sun causes a pseudoseasonality in the reflectance data (4, 6).
Traditionally, spaceborne Earth surface reflectance data over the terrestrial biosphere have been used to calculate vegetation indices, which are useful for observing changes in canopy “greenness” and estimating chlorophyll content at large spatial scales (1, 7). However, vegetation indices do not provide direct information on the fate of sunlight absorbed by chlorophyll (absorbed photosynthetically active radiation [APARchl]), whose individual photons take one of 3 pathways: photosynthesis, heat dissipation, and chlorophyll fluorescence (8). Under favorable conditions, most APARchl is used for photosynthesis, and a small amount (≤ ∼2%) is emitted by chlorophyll as fluorescence in the red and far-red portion of the electromagnetic spectrum (∼650 nm to 800 nm), which is created by the deexcitation of absorbed photons in all living plants (9).
Recently, quantification of the emission of solar-induced chlorophyll fluorescence (SIF) has become feasible from space, providing ample new opportunities to investigate the functioning of the photosynthetic machinery from remote sensing platforms (10–12). SIF retrievals require high spectral resolution and signal-to-noise ratio, and the only satellite instruments that have met these requirements were designed for atmospheric remote sensing, such as the Greenhouse Gases Observing Satellite, Global Ozone Monitoring Experiment 2, and Orbiting Carbon Observatory 2 (13–16). Although the global SIF datasets developed from these satellite observations have provided valuable insight into vegetation dynamics on Earth’s surface, their coarse spatial and temporal resolutions have not sufficiently resolved some important questions about the spatial distribution and temporal variability of SIF and photosynthesis on Earth. SIF is not a direct measure of photosynthesis, but satellite- and in situ-observed SIF has been shown to have a strong positive linear relationship with photosynthesis at the canopy scale (13, 15, 17), implying that changes in canopy SIF indicate changes in photosynthesis in the same direction (18, 19). The Tropospheric Monitoring Instrument (TROPOMI), a spectrometer onboard the Sentinel-5 Precursor satellite launched in October 2017 by the European Space Agency, enables a step change in SIF research, providing unprecedented high spatial and temporal resolution SIF observations that can address many of these important questions (20).
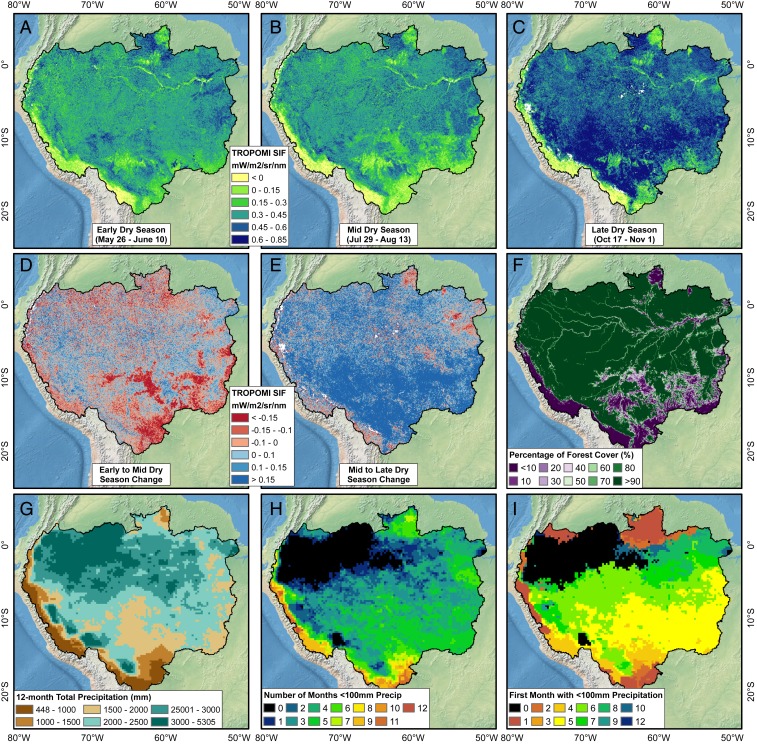
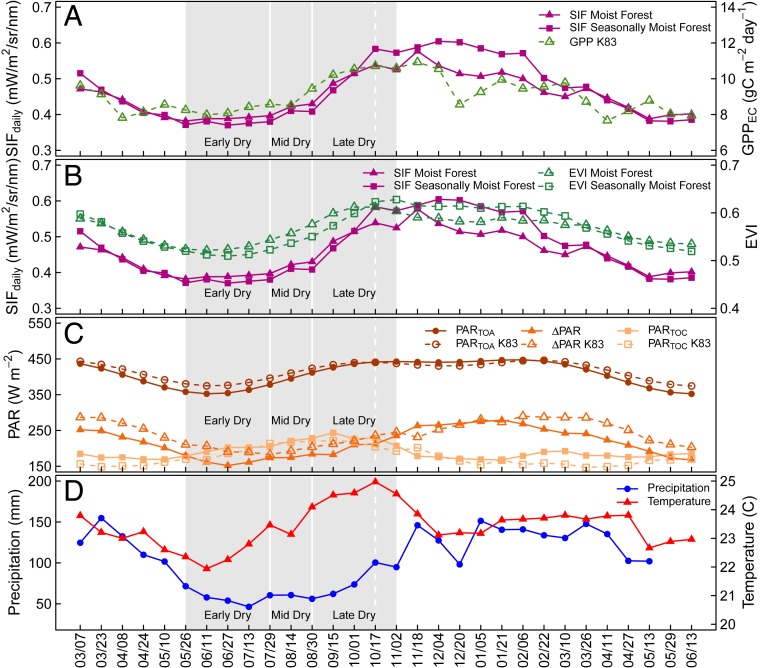
Here we report and analyze TROPOMI SIF data from March 2018 to June 2019 over the Amazon. TROPOMI’s high spatial and temporal resolution reveals previously unknown details on the spatial distribution of SIF in the Amazon (Fig. 1 A–C) and enables us to track SIF for forests and nonforests over time (Fig. 2A and SI Appendix, Figs. S1–S4). We show evidence that there is an overall dry-season increase in photosynthesis by Amazonian forests (Fig. 2A), where there was relatively little change in SIF in the early dry season (June through July), but a substantial increase in SIF in the late dry season (September through October) (Figs. 1 A–C and 2A). Middle dry-season TROPOMI SIF in Fig. 1B, a point in time when the difference between forest and nonforest SIF is greatest, mimics the percentage of forest cover in each TROPOMI grid cell shown in Fig. 1F. The Amazon River and its tributaries in the northern part of the basin are also evident in Fig. 1 A–C where surface water induces low SIF values. Wet-season SIF for seasonally moist forests (<2,000 mm mean annual precipitation [MAP]) was higher than SIF for moist forests (>2,000 mm MAP), which indicated that perhaps the productivity of seasonally moist forests was water-limited (Fig. 2). The ∼2,000-mm MAP threshold has previously been found to determine whether water is a factor limiting photosynthesis in tropical forests (21).
Fig. 1.
SIF, forest cover, and precipitation in the Amazon Basin. SIF during the (A) early, (B) middle, and (C) late dry season. (D) Middle minus early dry-season SIF. (E) Late minus middle dry-season SIF. (F) Percentage forest cover in each TROPOMI 0.05° pixel. (G) Total precipitation March 2018 to February 2019. (H) Number of months with <100 mm of precipitation. (I) First month with <100 mm precipitation.
Fig. 2.
Amazon forest SIF, photosynthesis, PAR, precipitation, and temperature. (A) TROPOMI SIF for moist and seasonally moist forest (>2,000 mm and <2,000 mm MAP), and 5-y mean GPP at the K83 moist forest flux tower site. (B) TROPOMI SIF for moist and seasonally moist forest, and BRDF-corrected EVI from MCD43A4 for moist and seasonally moist forest. (C) Basin-wide PAR at the top of the atmosphere (TOA), the top of the canopy (TOC), and the difference between the 2 (∆PAR), and 5-y means of TOA, TOC, and ∆PAR from the K83 flux tower site. (D) Basin-wide mean precipitation and temperature. Points are 16-d means. Shaded areas represent the early, middle, and late dry season. The dashed line approximates when TROPOMI’s phase angles are lowest.
For nonforest in the Amazon, SIF declined considerably in the early dry season (SI Appendix, Figs. S1 and S4), especially in the cropland region of central Bolivia and in the arc of deforestation in the Brazilian states of Acre, Rondônia, and Mato Grosso (Fig. 1D). In the late dry season, nonforest SIF continually increased. There were some hotspots where SIF decreased during the late dry season, notably in the Serra do Cachimbo Mountain region, the plains of the Brazilian state of Roraima, and the deforested areas in the vicinity of Santarém and Altamira (Fig. 1E).
In forests, the dry-season increase in SIF can be attributed to the loss of old leaves, the flushing of new leaves, and an increase in canopy chlorophyll content, which has been observed using in situ litterfall traps, tower-based time lapse photography, and satellite-based vegetation indices (1, 22, 23). For nonforest lands in the arc of deforestation, the decrease in SIF can be attributed to the harvest of crops and senescence of pasture, and the late dry-season increase in SIF is likely due to the early growth of pastures and crops such as maize, rice, sorghum, and soybean (24). At the basin scale, late dry-season SIF for moist and seasonally moist forest increased through October (Fig. 2A) despite decreased solar radiation in the canopy (PARTOC) (Fig. 2C) (25), which indicated that increased canopy chlorophyll content and photosynthesis drove dry-season increases in SIF and not PARTOC. TROPOMI SIF in the Amazon forest was remarkably consistent with in situ observations of increased dry-season photosynthesis in the moist tropical Amazon forest from the K83 CO2 eddy flux tower (Fig. 2A), which is representative of dry-season observations of photosynthesis from the other moist tropical forest eddy flux tower sites in the Amazon (23).
Two previous studies claimed that the geometry between the satellite sensors and the sun affects the surface reflectance data, and thus the green-up during the dry season as shown by vegetation indices is a data artifact inducing false seasonality (4, 6). Is it possible that the seasonality of TROPOMI SIF in the Amazon is an artifact of sun-sensor geometry? TROPOMI has a wide swath of 2,600 km with daily, near-global coverage, and the satellite has a 16-d repeat cycle, meaning that, every 17 d, the satellite’s nadir and swath footprint are nearly identical. The phase angle of each sounding, which is the angle between the axes from the sounding to the sun and to TROPOMI’s sensor, varies along the swath. Each sounding along the swath also has a different footprint size, with the smallest footprint at nadir (3.5 × 7 km) and the largest at the edges of the swath (14 × 7 km).
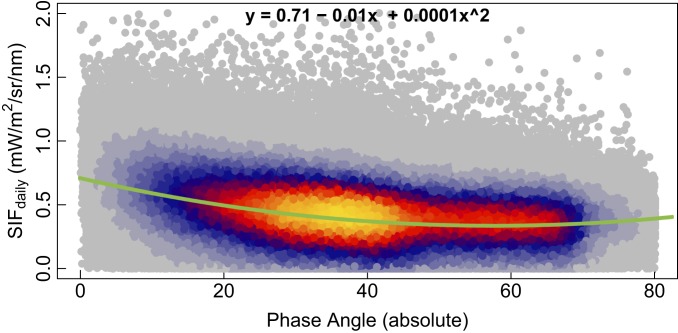
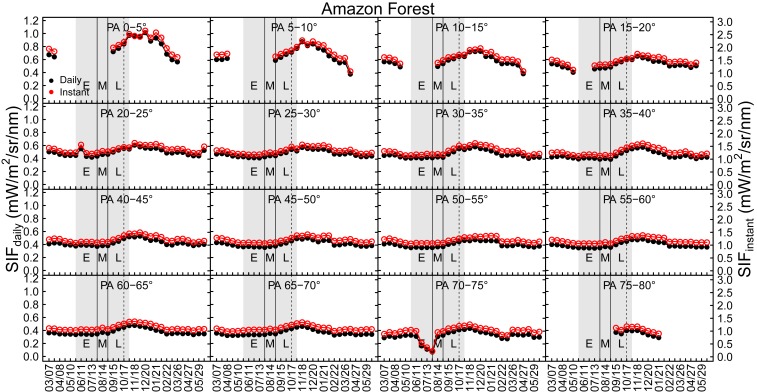
SIF retrievals are sensitive to the phase angle, with higher SIF values at low phase angles when TROPOMI observes more-directly illuminated parts of the canopy (Fig. 3) (20). TROPOMI’s viewing angle for any location is most comparable every 17 d, when the footprint of the satellite track and local solar overpass time are nearly identical because of their vicinity to the equator. Thus, we investigated whether TROPOMI SIF has seasonality when viewing angle is held relatively constant by evaluating SIF for each satellite track and found that each track has the same seasonal pattern (SI Appendix, Figs. S1–S4). Although we are not able to account for changes in solar illumination with this strategy, we can assume that the viewing geometry alone does not alter the observed seasonality. One possible explanation for the observed seasonality in TROPOMI SIF is that the decreasing zenith angle of the sun in the dry season causes TROPOMI phase angles to likewise decrease (SI Appendix, Fig. S5). However, we found that SIF increased during the dry season across all phase angles and that the increase was larger than what could be explained by phase angle alone (Fig. 4 and SI Appendix, Figs. S6–S8). Furthermore, if phase angle was driving the observed seasonality in SIF, then we would expect SIF to decrease after the phase angles of the TROPOMI soundings reached their minimum. However, SIF increased for several weeks after TROPOMI phase angles began increasing and despite increased cloud cover (Fig. 2). We also found a significant and strong relationship between TROPOMI SIF and bidirectional reflectance distribution function (BRDF)-corrected enhanced vegetation index (EVI) from Moderate Resolution Imaging Spectroradiometer (MODIS) MCD43A4 for moist and seasonally moist forest (R2 = 0.82 and 0.93, respectively), and between TROPOMI SIF for moist forest and the K83 tower site (R2 = 0.66) (SI Appendix, Fig. S9).
Fig. 3.
Relationship between phase angle and TROPOMI SIFdaily. Points are 1,000,000 random samples from all soundings (n = 22,876,383) in the Amazon Basin during 7 March 2018 to 29 June 2019.
Fig. 4.
TROPOMI SIFdaily and SIFinstant at different phase angles for the Amazon forest. Areas shaded in gray represent the early (E), middle (M), and late (L) dry seasons. The dashed line approximates when TROPOMI’s phase angles are lowest. These trends were also illustrated for moist and seasonally moist forest with greater than and less than 2,000-mm MAP and for nonforest in SI Appendix, Figs. S6–S8. Dates represent the first day of TROPOMI’s 16-d revisit cycle. Tick marks are every 16 d, and labels are every 32 d. The complete date range represented is 7 March 2018 to 29 June 2019.
The seasonality of TROPOMI SIF agrees with in situ seasonality of photosynthesis and MODIS EVI (Fig. 2 A and B), but to what extent do incoming solar radiation and cloud cover affect canopy photosynthesis and spaceborne observations of SIF in the Amazon? The amount of photosynthetically active radiation reaching the top of the canopy (PARTOC) is determined by the difference between the amount of incoming PAR at the top of the atmosphere (PARTOA) from the sun and the amount of PAR reflected into space and absorbed by clouds, trace gases, aerosols, and particulate matter (∆PAR). Thus, seasonality in PARTOA (length of day and solar angle) and ∆PAR (mostly cloud cover/thickness) determine the amount and timing of instantaneous and daily PARTOC (PARTOC = PARTOA − ∆PAR), which drives photosynthesis and serves as a phenological queue for tropical tree species (26).
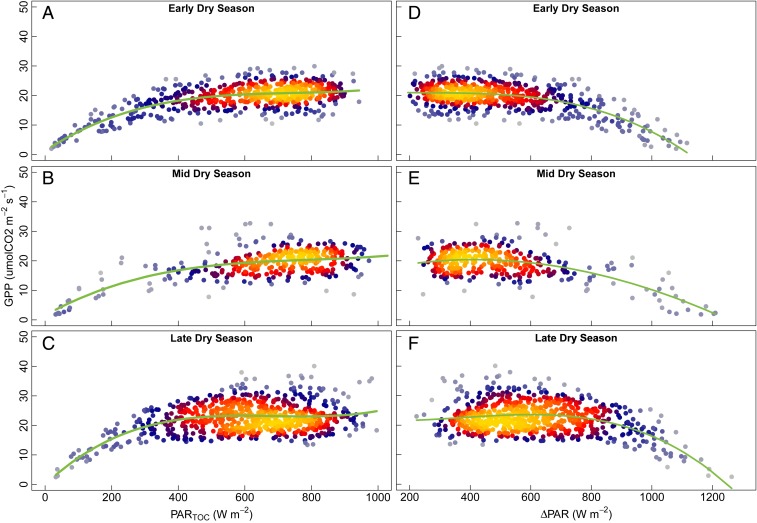
Diurnally, there is a tight relationship between PARTOC and photosynthesis in the morning and evening, as they rise and fall in tandem (27). At midday, the relationship between PARTOC and photosynthesis decouples as the canopy becomes light-saturated (SI Appendix, Fig. S10). Using in situ data, we found that, during TROPOMI’s early afternoon overpass time of 12:45 PM to 2:30 PM local solar time (LST) over the Amazon (SI Appendix, Fig. S11), photosynthesis is nearly always light-saturated (Fig. 5 A–C) and ∆PAR rarely impacts photosynthesis (Fig. 5 D–F). Dense clouds can block the emission of SIF into space, and TROPOMI soundings are prefiltered to remove soundings that are affected by high radiance levels due to cloud albedo and that have >80% cloud fraction. However, in situ data indicate that cloud cover rarely blocks enough solar irradiance at TROPOMI’s overpass time to induce light limitation of photosynthesis (Fig. 5). We cannot completely rule out that seasonal changes in cloud cover and optical thickness may affect SIF dynamics in the Amazon, but we did observe that the strongest increase in SIF occurred during the middle to late dry season despite reduced PARTOC and increased ∆PAR and cloud fraction (SI Appendix, Fig. S12), which suggests that changes in cloud properties during the dry season have an insignificant effect on SIF retrievals. The seasonality of forest SIF was most similar to PARTOA, indicating that perhaps the timing of leaf flush in the forest is photosensitive to the length of the day and/or responsive to herbivory, which are not necessarily mutually exclusive (1, 28, 29).
Fig. 5.
Dry-season light and shade response of photosynthesis in the Amazon at TROPOMI overpass times (∼12:45 PM to 2:30 PM LST) at K83 eddy tower. Light-response curves of photosynthesis and PAR at the top of the canopy (PARTOC) in (A) early dry season, (B) middle dry season, and (C) late dry season. Shade-response curves of photosynthesis and the absorption and reflection of PAR incoming from the top of the atmosphere (∆PAR) before reaching the canopy in (D) early dry season, (E) middle dry season, and (F) late dry season.
In summary, the dry-season increase of TROPOMI SIF in the Amazon mimics the dry-season increase of photosynthesis as estimated from eddy flux data (23), in situ observations by phenological cameras of seasonal canopy senescence and leaf flush (22, 30), and BRDF-corrected, reflectance-based satellite observations (3, 11, 21, 31). Our results not only help resolve the debate over whether there is a dry-season increase in photosynthesis in moist tropical Amazon forest but also indicate that changes in photosynthesis during the dry season are largely driven by land cover type and changes in the forest canopy.
Materials and Methods
TROPOMI Observations.
We used daily corrected ungridded TROPOMI SIF data for all data analysis (Fig. 1 and SI Appendix, Figs. S1–S4) and daily corrected gridded TROPOMI SIF data in 0.05° spatial resolution for visualization in Fig. 1 (20). Gridded (0.20°) and ungridded data are available at ftp://fluo.gps.caltech.edu/data/tropomi/. It is also important to note that aerosols and clouds have different effects on SIF and reflected radiance at top-of-atmosphere (decreasing SIF, increasing reflectance), and cloud shadows reduce reflectance but not necessarily photosynthesis (Fig. 5), so any reflectance-based correction may introduce an artificial seasonality in the framework of our study (20). The data fields contain, for each sounding, the cloud fraction, daily correction factor, latitude and longitude of the center of the sounding, latitude and longitude for each corner of the sounding footprint, viewing zenith angle, solar zenith angle, phase angle, instantaneous SIF and error, daily corrected SIF, and LST. Cloud fraction is calculated using the data from the Visible Infrared Imaging Radiometer Suite satellite, which is an indicator of cloud cover but not cloud optical thickness. Daily mean SIF is estimated using a function that accounts for the measurement’s solar zenith angle, time of measurement, and length of day (10, 20). Error estimate methods and additional data processing details have been previously published (20).
In Situ Eddy Flux Observations and MODIS Data.
In our analysis, we used Tier 1 FLUXNET2015 eddy flux data from the tower site K83 (BR-Sa3; Santarem Km83), located in seasonally moist tropical Amazon forest near −3.0180, −54.9714 (latitude/longitude), for the years 2000–2004 (32) (https://fluxnet.fluxdata.org/doi/FLUXNET2015/BR-Sa3). The seasonality in GPP, PARTOA, PARTOC, and PAR∆ at K83 (Fig. 2 A and B) was used in this manuscript as an example of observations from other eddy flux towers in the seasonally moist tropical Amazon forests (K34, K67, and CAX), which are in agreement and have been previously reported (23). Prior to plotting the light- and shade-response curves (Fig. 5), which are half-hourly data, we filtered the data to include only the highest-quality measured PAR (shortwave radiation incoming at the surface), thereby excluding gap-filled and estimates from the European Centre for Medium-Range Weather Forecasts (ECMWF) interim reanalysis (ERA-Interim). We also converted the local time of the eddy flux observations to LST. TROPOMI overpass times in the Amazon ranged from about 12:45 PM to 2:30 PM LST (SI Appendix, Fig. S11), so we plotted eddy covariance data whose 30-min timestamp range had midpoints between 1:00 PM and 2:15 PM LST.
We used BRDF corrected surface reflectance from the MODIS MCD43A4 data product (33) to calculate EVI. We calculated 16-d means of EVI from the daily data, which was available at 500-m spatial resolution, where EVI was calculated using bands 1 through 3,
where b1 is the red band, b2 is the near-infrared band, and b3 is the blue band (34, 35).
Land Cover, Precipitation, and PAR Datasets.
To determine forest and nonforest land cover, we used annual forest cover maps for 2008–2017 for the Amazon Basin with a spatial resolution of 500 m (36, 37). Only TROPOMI soundings that were in land cover map pixels that were consistently forest or nonforest were used in the data analysis. To prevent the inclusion of mixed water/land TROPOMI soundings from our analysis, we masked water from the TROPOMI data using the MOD44W Version 6 (38) water mask with a 7-km buffer. Implementing a similar buffer for forests to exclude TROPOMI mixed forest/nonforest soundings resulted in a near elimination of nonforest soundings due to the heterogeneity of nonforest area; thus we applied only a water mask to the TROPOMI data. Total annual and monthly precipitation (Fig. 1 G–I) was derived using the monthly, 0.25° Version 7 Tropical Rainfall Measuring Mission (TRMM) Multi-Satellite Precipitation Analysis (3B43) (39). For 16-d precipitation means (Fig. 2C), we used the TRMM Research Derived Daily Product (3B42) (40). We calculated mean 16-d temperature (Fig. 2C) and 16-d PAR values (Fig. 2B) using daily mean downward shortwave radiation at the surface (PARTOC) and the top (PARTOA) of the atmosphere, from the NCEP-DOE Reanalysis II data set (41). ∆PAR was calculated as the difference between PARTOA and PARTOC.
Supplementary Material
Acknowledgments
This study was supported by research grants through the Geostationary Carbon Cycle Observatory (GeoCarb) Mission from NASA (GeoCarb Contract 80LARC17C0001) and the US National Science Foundation Established Program to Stimulate Competitive Research (EPSCoR) program (IIA-1301789). P.K. and C.F. were funded by the Earth Science U.S. Participating Investigator (Grant NNX15AH95G).
Footnotes
The authors declare no competing interest.
This article is a PNAS Direct Submission.
This article contains supporting information online at www.pnas.org/lookup/suppl/doi:10.1073/pnas.1908157116/-/DCSupplemental.
References
- 1.Xiao X., Hagen S., Zhang Q., Keller M., Moore B. III, Detecting leaf phenology of seasonally moist tropical forests in South America with multi-temporal MODIS images. Remote Sens. Environ. 103, 465–473 (2006). [Google Scholar]
- 2.Huete A. R., et al. , Amazon rainforests green‐up with sunlight in dry season. Geophys. Res. Lett. 33, L06405 (2006). [Google Scholar]
- 3.Saleska S. R., et al. , Dry-season greening of Amazon forests. Nature 531, E4–E5 (2016). [DOI] [PubMed] [Google Scholar]
- 4.Morton D. C., et al. , Amazon forests maintain consistent canopy structure and greenness during the dry season. Nature 506, 221–224 (2014). [DOI] [PubMed] [Google Scholar]
- 5.Myneni R. B., et al. , Large seasonal swings in leaf area of Amazon rainforests. Proc. Natl. Acad. Sci. U.S.A. 104, 4820–4823 (2007). [DOI] [PMC free article] [PubMed] [Google Scholar]
- 6.Galvão L. S., et al. , On intra-annual EVI variability in the dry season of tropical forest: A case study with MODIS and hyperspectral data. Remote Sens. Environ. 115, 2350–2359 (2011). [Google Scholar]
- 7.Xiao X., et al. , Satellite-based modeling of gross primary production in a seasonally moist tropical evergreen forest. Remote Sens. Environ. 94, 105–122 (2005). [Google Scholar]
- 8.Genty B., Briantais J.-M., Baker N. R., The relationship between the quantum yield of photosynthetic electron transport and quenching of chlorophyll fluorescence. Biochim. Biophys. Acta Gen. Subj. 990, 87–92 (1989). [Google Scholar]
- 9.Baker N. R., Chlorophyll fluorescence: A probe of photosynthesis in vivo. Annu. Rev. Plant Biol. 59, 89–113 (2008). [DOI] [PubMed] [Google Scholar]
- 10.Frankenberg C., et al. , New global observations of the terrestrial carbon cycle from GOSAT: Patterns of plant fluorescence with gross primary productivity. Geophys. Res. Lett. 38, L17706 (2011). [Google Scholar]
- 11.Joiner J., Yoshida Y., Vasilkov A., Middleton E., First observations of global and seasonal terrestrial chlorophyll fluorescence from space. Biogeosciences 8, 637–651 (2011). [Google Scholar]
- 12.Frankenberg C., et al. , Prospects for chlorophyll fluorescence remote sensing from the Orbiting Carbon Observatory-2. Remote Sens. Environ. 147, 1–12 (2014). [Google Scholar]
- 13.Guanter L., et al. , Retrieval and global assessment of terrestrial chlorophyll fluorescence from GOSAT space measurements. Remote Sens. Environ. 121, 236–251 (2012). [Google Scholar]
- 14.Joiner J., Yoshida Y., Guanter L., Middleton E. M., New methods for the retrieval of chlorophyll red fluorescence from hyperspectral satellite instruments: Simulations and application to GOME-2 and SCIAMACHY. Atmos. Meas. Tech. 9, 3939–3967 (2016). [Google Scholar]
- 15.Sun Y., et al. , Overview of solar-induced chlorophyll fluorescence (SIF) from the Orbiting Carbon Observatory-2: Retrieval, cross-mission comparison, and global monitoring for GPP. Remote Sens. Environ. 209, 808–823 (2018). [Google Scholar]
- 16.Lee J.-E., et al. , Forest productivity and water stress in Amazonia: Observations from GOSAT chlorophyll fluorescence. Proc. R. Soc. B Biol. Sci. 280, 20130171 (2013). [DOI] [PMC free article] [PubMed] [Google Scholar]
- 17.Yang K., et al. , Sun-induced chlorophyll fluorescence is more strongly related to absorbed light than to photosynthesis at half-hourly resolution in a rice paddy. Remote Sens. Environ. 216, 658–673 (2018). [Google Scholar]
- 18.Porcar-Castell A., et al. , Linking chlorophyll a fluorescence to photosynthesis for remote sensing applications: Mechanisms and challenges. J. Exp. Bot. 65, 4065–4095 (2014). [DOI] [PubMed] [Google Scholar]
- 19.Verma M., et al. , Effect of environmental conditions on the relationship between solar‐induced fluorescence and gross primary productivity at an OzFlux grassland site. J. Geophys. Res. Biogeosci. 122, 716–733 (2017). [Google Scholar]
- 20.Zuromski L. M., et al. , Solar‐induced fluorescence detects interannual variation in gross primary production of coniferous forests in the Western United States. Geophys. Res. Lett. 45, 7184–7193 (2018). [Google Scholar]
- 21.Guan K., et al. , Photosynthetic seasonality of global tropical forests constrained by hydroclimate. Nat. Geosci. 8, 284–289 (2015). [Google Scholar]
- 22.Lopes A. P., et al. , Leaf flush drives dry season green-up of the Central Amazon. Remote Sens. Environ. 182, 90–98 (2016). [Google Scholar]
- 23.Restrepo-Coupe N., et al. , What drives the seasonality of photosynthesis across the Amazon Basin? A cross-site analysis of eddy flux tower measurements from the Brasil flux network. Agric. For. Meteorol. 182, 128–144 (2013). [Google Scholar]
- 24.Food and Agriculture Organization of the United Nations , GIEWS country brief Brazil. http://www.fao.org/giews/countrybrief/country/BRA/pdf_archive/BRA_Archive.pdf. Accessed 24 May 2019.
- 25.Wright J. S., et al. , Rainforest-initiated wet season onset over the southern Amazon. Proc. Natl. Acad. Sci. U.S.A. 114, 8481–8486 (2017). [DOI] [PMC free article] [PubMed] [Google Scholar]
- 26.Wright S. J., Van Schaik C. P., Light and the phenology of tropical trees. Am. Nat. 143, 192–199 (1994). [Google Scholar]
- 27.Malhi Y., et al. , Carbon dioxide transfer over a Central Amazonian rain forest. J. Geophys. Res. D Atmospheres 103, 31593–31612 (1998). [Google Scholar]
- 28.Coley P. D., Barone J., Herbivory and plant defenses in tropical forests. Annu. Rev. Ecol. Syst. 27, 305–335 (1996). [Google Scholar]
- 29.van Schaik C. P., Terborgh J. W., Wright S. J., The phenology of tropical forests: Adaptive significance and consequences for primary consumers. Annu. Rev. Ecol. Syst. 24, 353–377 (1993). [Google Scholar]
- 30.Wu J., et al. , Leaf development and demography explain photosynthetic seasonality in Amazon evergreen forests. Science 351, 972–976 (2016). [DOI] [PubMed] [Google Scholar]
- 31.Saleska S. R., Didan K., Huete A. R., da Rocha H. R., Amazon forests green-up during 2005 drought. Science 318, 612 (2007). [DOI] [PubMed] [Google Scholar]
- 32.Saleska S. R., et al. , Carbon in Amazon forests: Unexpected seasonal fluxes and disturbance-induced losses. Science 302, 1554–1557 (2003). [DOI] [PubMed] [Google Scholar]
- 33.Schaaf C., Wang Z., “MCD43A4: MODIS/Terra+ Aqua BRDF/Albedo Nadir BRDF Adjusted RefDaily L3 Global-500m V006” (NASA Earth Observing System Data and Information System Land Processes Distributed Active Archive Centers, Sioux Falls, SD, 2015).
- 34.Huete A., Liu H., Batchily K., Van Leeuwen W., A comparison of vegetation indices over a global set of TM images for EOS-MODIS. Remote Sens. Environ. 59, 440–451 (1997). [Google Scholar]
- 35.Justice C. O., et al. , The Moderate Resolution Imaging Spectroradiometer (MODIS): Land remote sensing for global change research. IEEE Trans. Geosci. Remote Sens. 36, 1228–1249 (1998). [Google Scholar]
- 36.Qin Y., et al. , Annual dynamics of forest areas in South America during 2007-2010 at 50-m spatial resolution. Remote Sens. Environ. 201, 73–87 (2017). [Google Scholar]
- 37.Qin Y., et al. , Improved estimates of forest cover and loss in the Brazilian Amazon in 2000–2017. Nat. Sustainability 2, 764–772 (2019). [Google Scholar]
- 38.Carroll M., et al. , “MOD44W: MODIS/Terra Land Water Mask Derived from MODIS and SRTM L3 Global 250m SIN Grid V006” (NASA Earth Observing System Data and Information System Land Process Distributed Active Archive Centers, Sioux Falls, SD, 2017).
- 39.Huffman G. J., Stocker E. F., Bolvin D. T., Nelkin E. J., 3B43: Multisatellite precipitation. https://pmm.nasa.gov/data-access/downloads/trmm. Accessed 24 May 2019.
- 40.Huffman G. J., Stocker E. F., Bolvin D. T., Nelkin E. J., 3B42 Research derived daily product. https://pmm.nasa.gov/data-access/downloads/trmm. Accessed 24 May 2019.
- 41.Kanamitsu M., et al. , NCEP-DOE AMIP-II Reanalysis (R-2). Bull. Am. Meteorol. Soc. 83, 1631–1644 (2002). [Google Scholar]
Associated Data
This section collects any data citations, data availability statements, or supplementary materials included in this article.


