Abstract
Single-photon-excitation-based miniaturized microscope, or miniscope, has recently emerged as a powerful tool for imaging neural ensemble activities in freely moving animals. In the meanwhile, this highly flexible and implantable technology promises great potential for studying a broad range of cells, tissues and organs. To date, however, applications have been largely limited by the properties of the imaging modality. It is therefore highly desirable for a method generally applicable for processing miniscopy images, enabling and extending the applications to diverse anatomical and functional traits, spanning various cell types in the brain and other organs. We report an image processing approach, termed BSSE, for background suppression and signal enhancement for miniscope image processing. The BSSE method provides a simple, automatic solution to the intrinsic challenges of overlapping signals, high background and artifacts in miniscopy images. We validated the method by imaging synthetic structures and various biological samples of brain, tumor, and kidney tissues. The work represents a generally applicable tool for miniscopy technology, suggesting broader applications of the miniaturized, implantable and flexible technology for biomedical research.
1. Introduction
Single-photon-excitation-based miniaturized microscope, or mini-scope, enables in vivo, wide-field calcium imaging in freely behaving animals [1–3]. Compared to conventional micro-endoscopic and electrophysiological techniques, the miniscope technology allows for longitudinal, population-scale recording of neural ensemble activities during complex behavioral, cognitive and emotional states [1,2,4–8]. The technique has thus far been successfully used to explore neural circuits in various brain regions such as cortical, subcortical and deep brain areas [5,7,9–15].
In practice, the miniscope technique mainly uses gradient-index (GRIN) rod lenses that offer several advantages compared to compound objective lenses, including low cost, light weight (<1 g), small diameters (<1 mm), long relay lengths (>1 cm), and relatively high numerical aperture (NA, >0.45). These features of the miniscope thus enable minimally invasive imaging of a significant volume of the brain with a cellular-level resolution in freely moving animals. However, broader applications have thus far been largely limited by the properties of the imaging modality. Specifically, unlike compound objectives, GRIN lenses suffer from severe optical aberrations such as distortions and spherical aberrations, mainly due to the radially-distributed parabolic (or non-aplantic) refractive index. These aberrations inherently deteriorate image quality, image resolution, contrast and effective field-of view (FOV) [16]. As a result, the deficiency becomes severely restrictive for single-photon-excitation-based, wide-field imaging in thick tissues, leading to extensively overlapping signals, high background and artifacts in miniscopy images.
Although such aberrations can be compensated using additional optical elements [16–18], these methods either require special design for different GRIN lenses or are incompatible with a miniaturized system. Computational methods have thereby been developed as an alternative, efficient strategy to separate the background and denoise and extract the signals. Unlike previous assays for processing optically-sectioned (thus high-SNR) data resulted from two-photon or light-sheet microscopy [19–22], these computational methods are designed to handle typical miniscope imaging conditions with high fluctuating background, movements, distortions, and low SNR. Specifically, current methods mainly rely on region of interest (ROI) analysis [7,11,12,23], principal-component analysis/independent component analysis (PCA/ICA) [22,24] or constrained nonnegative matrix factorization (CNMF_E) approaches [25,26].
However, all existing methods are solely developed for extracting neuronal calcium imaging signals. This is mainly due to the fact that current miniscopy applications have remained almost exclusively focused on functional brain imaging, despite the promising potential for imaging a broader range of cells, tissues and organs. It is therefore highly desirable for a method generally applicable for processing miniscopy images, extending the applications to diverse anatomical and functional studies on various cell types in the brain and other organs.
Here, we develop a computational approach, termed BSSE, allows for automatic processing, background suppression and signal enhancement of single-photon-excitation-based miniscopy images. The approach provides a simple solution to the intrinsic challenges to separate the high background and denoise the overlapping signals. We demonstrated the method using synthetic structures, in vitro brain and kidney sections in mice, and in vivo calcium imaging data. We validated the method on both the lab-built and commercially available miniscopes. We expect this new algorithm to enable miniscopes for broader applications in biomedical research.
2. Methods
2.1 System setup and characterization
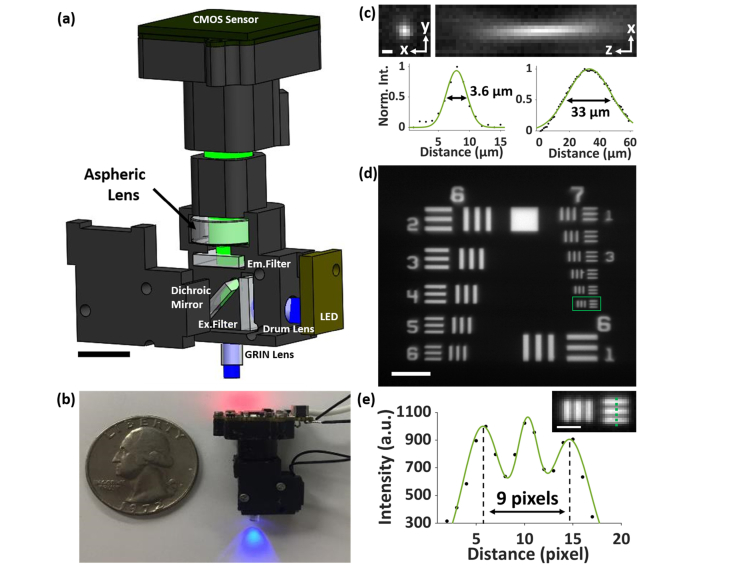
We constructed the miniaturized imaging system based on the open-source design protocols (http://miniscope.org), as shown in Figs. 1(a) and 1(b). In particular, we used an infinitely-corrected (0.25-pitch), 0.5NA GRIN lens (GT-IFRL-200-inf-50-NC, GRINTECH). The sample was illuminated with a 488-nm LED (LXML-PB01-0030, Lumileds), filtered by an excitation filter (FF01-480/40, Semrock) and collimated by a drum lens (45549, Edmund Optics). The corresponding emitted fluorescence was collected using a dichroic mirror (FF506-Di03, Semrock) and an emission filter (FF01-535/50, Semrock) and imaged by an aspherical tube lens (D-ZK3, Thorlabs) onto a CMOS sensor (MT9V032C12STM, ON Semiconductor). The use of an aspherical lens as the tube lens instead of an achromatic lens was to moderately enhance the optical sectioning capability (Appendix A and Fig. 7). The miniscope body (~5.0 ) was designed with Solidworks software and 3D-printed using a 3D printer (RS-F2-GPBK-04, FormLabs2). The system uses single, flexible coaxial cables to supply power, control hardware, and transmit image data.
Fig. 1.
System setup and characterization. (a) Solidworks design scheme. (b) Comparison of the 3D-printed miniscope with a U.S. quarter coin. The LED illuminates blue light peaked at 488 nm. The indicator on the camera sensor emits red light when turned on. (c) Representative point-spread function (PSF) of the miniscope, taken with a 200-nm fluorescent bead, exhibits FWHM values of 3.6 µm and 33 µm in the lateral and axial dimensions, respectively. (d) Image of a 1951 USAF target, with fluorescent tapes attached to the rear surface. (e) Cross-sectional profile along the solid line in the inset, which shows the zoomed-in image of the boxed region in (d). The profile resolves the caliber lines separated by a known distance of 8.8 µm over 9 pixels (physical pixel size = 6 μm), determining the ~6x magnification of the system. Scale bars: 5 mm (a), 3 μm (c), 50 μm (d), 10 μm (e).
To characterize the miniscope, we imaged water-immersed 200-nm fluorescent beads (FSDG002, Bangs Laboratories) and measured the point-spread function (PSF) of the system at varying depths, as shown in Fig. 1(c). The PSF images were Gaussian-fitted and exhibited FWHM values of ~3 µm and ~30 µm in the lateral and axial dimensions, respectively. Notably, the axial PSF is substantially extended due to the strong spherical and other aberrations in the system, which lead to severe spatial overlaps of signals while imaging thick samples. Furthermore, a negative USAF target (R1DS1N, Thorlabs), attached to fluorescent tapes and immersed in water, was used to determine the magnification (~6x) and effective pixel size (1 μm) of the system, as shown in Figs. 1(d) and 1(e).
2.2 Animal and tissue sample preparation
For brain tumor tissue, C57BL/6 mice (wild type, WT) were purchased from Jackson Laboratory. GL261 cells were stably transfected with EGFP and stereo-tactically injected into the striatum of the brain, near the ventricles [27–29].
For the kidney tissue, the transgenic mouse line with enhanced GFP (EGFP) cDNA under the control of a beta-actin promoter and cytomegalovirus enhancer was purchased from Jackson Laboratory [30].
For the brain tissue, the Macgreen transgenic mouse line with EGFP under the control of the mouse Csf1r promoter was purchased from Jackson Laboratory. The EGFP is expressed in macrophages and trophoblast cells, and specifically in microglia cells in the brain [31].
All animal procedures were approved by the Stony Brook University Institutional Animal Care and Use Committee (IACUC). Mice were bred in-house under maximum isolation conditions on a 12:12 hour light: dark cycle with food ad libitum.
For tissue preparation, mice were deeply anesthetized with 2.5% Tribromoethanol (avertin) and transcardially perfused with PBS followed by 4% PFA. Tissue was collected, post-fixed in 4% PFA overnight, and transferred to a 30% sucrose solution for dehydration and cryoprotection. Tissue was frozen in OCT (optimal cutting temperature technique), cut into 20μm-thick sections and collected on Superfrost plus microscope slides. The slides were stored at −80°C.
For imaging, distilled water was dropped onto the sample to facilitate the water-immersion GRIN lens. During the acquisition, the miniscope was fixed, and the sample was placed on a 3D stage.
2.3 Calcium imaging data
In this work, we utilized calcium imaging data generously provided by the authors of [32]. Detailed protocols were documented in [32]. Specifically, the dorsal CA1 neuronal imaging virally transfected with the calcium indicator AAV9.Syn.GCaMP6f.WPRE.SV40 (Penn Vector Core) using a synapsin promoter were obtained by a commercially available miniscope (Inscopix). Transfected mice were placed on a motorized treadmill with a 40 cm × 60 cm rectangular track (Columbus Instruments) and trained to run for increasing intervals of time in between laps. The raw imaging data and behavioral videos were generously shared by the authors of [32] at https://drive.google.com/open?id=1r4Ipk_Z6rttc4btQAIml-S0uSmv0pTPW [32]. In this work, we used the first subset of the shared raw imaging data sets (300 frames, Mouse 1 (G45) / Day 1 / recording_20151130-001.tif).
2.4 BSSE algorithm: architecture and demonstrations
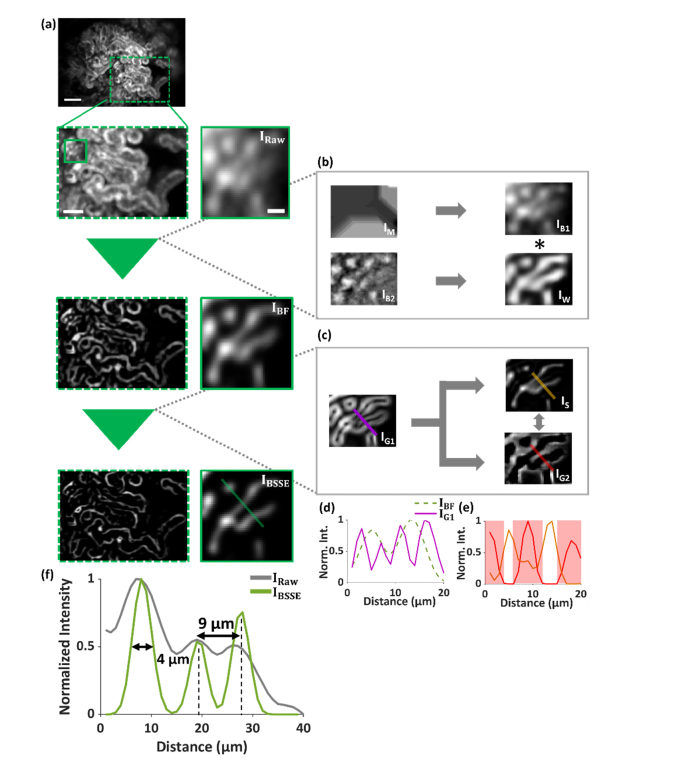
The algorithm contains two main modules to address the major challenges in miniscopyimage data, i.e. the high fluctuating background and the overlapping signals. The detailed architecture of the algorithm is described in Fig. 2 and Appendix B. In brief, first, the algorithm separates and suppresses different frequency components of the background. The predominant low-frequency background is initially rejected from the raw image using morphological image processing [33]. The resulting image was then modulated by a weight mask [34,35] to remove the frequency components primarily responsible for the fluctuating background (inhomogeneous background due to the sample or the evolution of background over time). Next, the algorithm enhances the resolution of the background-suppressed image by exploiting the gradient information of the overlapping signals [36,37]. Specifically, we considered the radial symmetry of the 2D PSF of a single emitter or a sub-diffraction-limited point source, as well as its gradient distribution, in the background-suppressed miniscopy image. The signals are initially sharpened by subtracting the weighted first derivative of the image. To ensure the signals are narrowed at a moderate and constant ratio, we selected the scale factor σ for the sharpened signal image IS = IBF – σ · IG1, where σ is determined as the ratio between the values of the simulated Gaussian PSF and its first derivative at the inflection point. To enhance the resolution between the overlapping signals, we combined the second derivative of the image to identify and segment the crossings of the overlapping regions by zero-concavity analysis. The removal of the background in the first module circumvents artifacts generated by the sensitive response of the image gradients to the fluctuating background. The outcome image of the algorithm exhibits both substantially suppressed background and enhanced signals, as shown in Fig. 2 and Appendix B. For tissue images, a post-smoothing step using a Gaussian filter is included to maintain the continuity of biological structures [33,38]. The BSSE algorithm works with the proprietary software package MATLAB R2015a and above. The source code is available from the authors and on Github (https://github.com/shujialab/BSSE).
Fig. 2.
Architecture of BSSE. The algorithm contains two main modules. The first module is used to remove the background. Specifically, the raw image IRaw is first moderately smoothed by time-averaging or Gaussian convolution (standard deviation = 1 pixel), obtaining the image I0. The algorithm then subtracts the predominant low-frequency background IM from the image I0 using morphological image processing, obtaining the image IB1 = I0 - IM. Next, a Gaussian filter (standard deviation = 1 pixel) is applied to generate the baseline low-frequency image IGauss, and the high-frequency component of the signal IB2 is obtained using the BM3D method [35] as IB2 = I0 - IGauss. IB2 is then binarized, smoothed and normalized to generate the weight mask IW. The algorithm then modulates IB1 with the weight mask IW to remove the frequency components responsible for the fluctuating background, obtaining the background-suppressed image IBF = IB1 · IW. The second module is used to enhance the signals of the image IBF. Specifically, the first-derivative image IG1 is generated and subtracted from the image IBF, obtaining the sharpened signal image IS = IBF – σ · IG1, where σ is scale factor, determined as the ratio between the values of the simulated Gaussian PSF and its first derivative at the inflection point. IS is given a threshold to zero negative pixel values. The second-derivative image IG2 of IBF is next generated to identify and segment the crossings of the overlapping signals in IS by zero-concavity analysis, obtaining the final image IBSSE. Images were taken using 1-μm fluorescent beads. Scale bar: 5 μm.
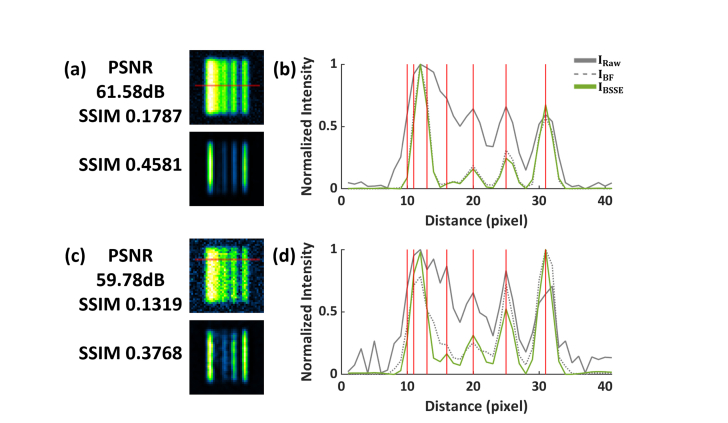
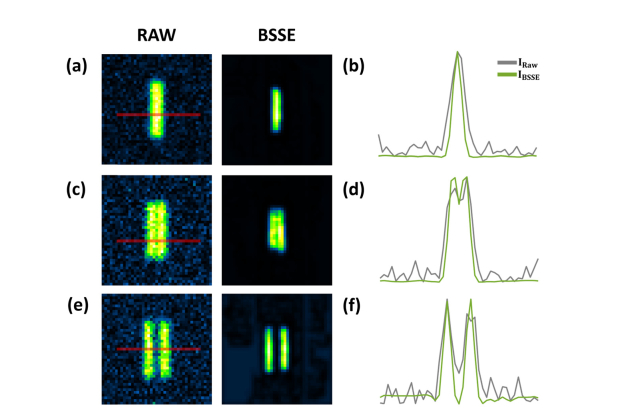
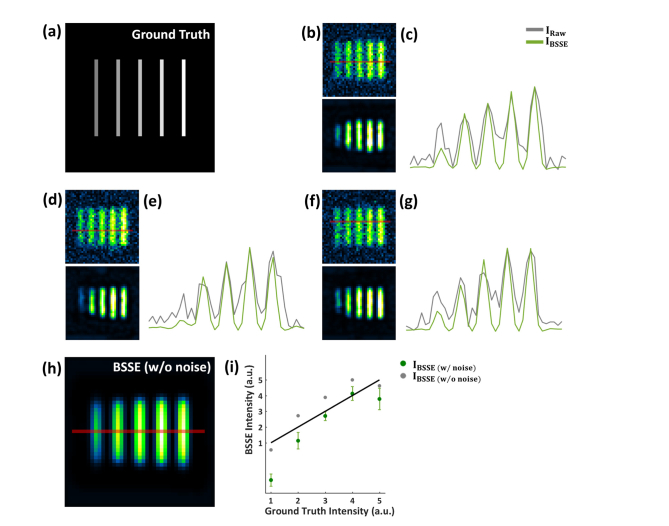
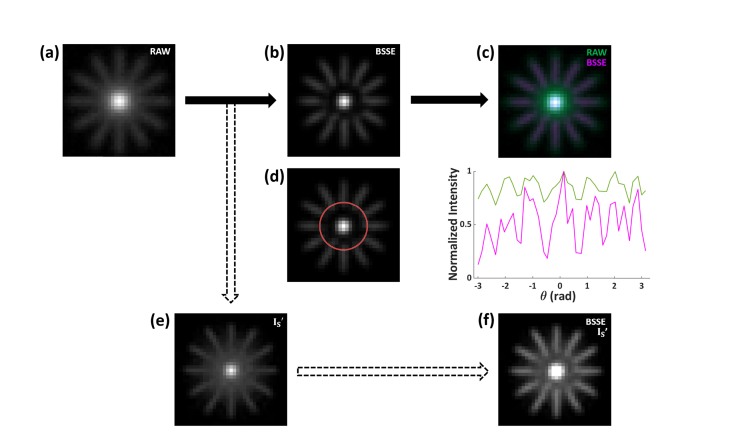
The method was first demonstrated using synthetic caliber patterns with various spacing, SNRs and intensity, as shown in Appendix C and Figs. 9-13. As seen, using BSSE, we noticed that the method can improve the image quality of the diffraction-limited images. It was also shown that the high background at varying levels was suppressed, and the close-by, low-SNR structures were enhanced and better resolved. Also, as illustrated in Appendix C, the original intensity relationship can be retained for most of the intensity levels and gradually deviates from the linear manner when it reaches noticeably strong or weak intensity regime, considering the fact that the denoising step of the method is intrinsically nonlinear. In addition, in Appendix C, we demonstrated our strategy to process highly dense structure to maintain high-resolution structures while avoiding the loss of weak signals.
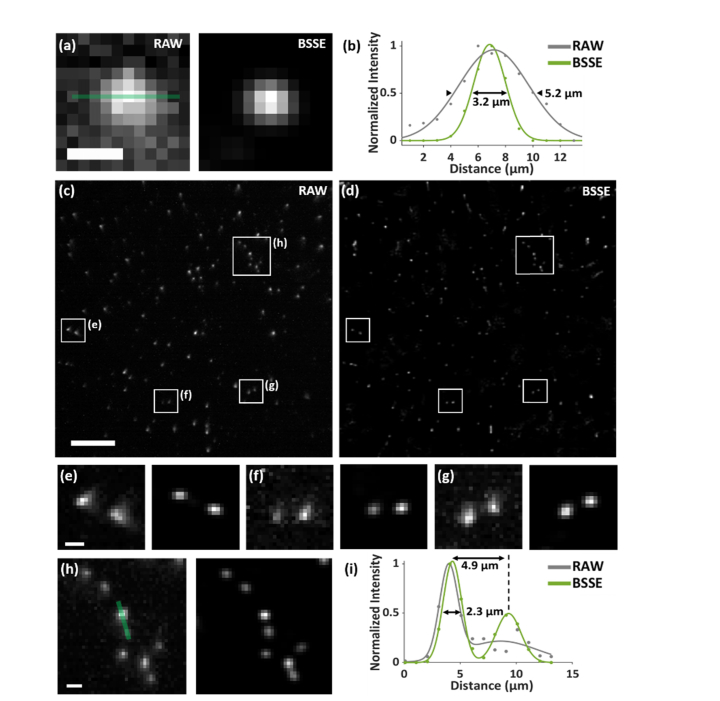
Next, we imaged and measured the profiles of fluorescent beads (FSDG, Bangs Laboratories) attached to the surface of a cover slide, as shown in Fig. 3. It is shown that the method not only suppressed the fluctuating background, but also enhanced the signals from single emitters across a FOV of ~300 µm × 300 µm, as shown in Figs. 3(a)-3(d). Because BSSE considers the gradient symmetry of the PSFs, the image degradation caused by the intrinsic aberrations in the system can also be reduced due to their lack of radial symmetry, recovering the Gaussian-like PSFs, as shown in Figs. 3(e)-3(h). It should be addressed that BSSE improves the image quality mainly through enhancing the SNR. We observed that the relatively high SNR of Fig. 3(h) can be further improved, mainly by rejecting the background, thus making the nearby dim bead resolvable as shown in the right peak of Fig. 3(i). It should be noted that here the improvement was demonstrated for the fluorescent beads located on a 2D surface, where the background is mainly resulted from any floating beads or the CMOS camera sensor. In Results, we demonstrated the method by imaging 3D, thick biological samples.
Fig. 3.
Characterization of the BSSE method. (a) Raw and BSSE-processed images of 1-µm fluorescent beads, respectively. Additional Gaussian noisy background was added to the raw image. It can be observed that the fluctuating background was substantially suppressed. (b) Gaussian fitted cross-sectional profiles along the solid line in (a) of both raw and processed images, which showed enhanced signals using BSSE. (c, d) Raw (c) and BSSE-processed (d) images of 200-nm fluorescent beads. (e-h) Zoomed-in images the corresponding boxed regions in (c, d). (i) Cross-sectional profiles with respect to the corresponding solid line in (h) in the raw and processed images, showing enhanced signals of two nearby emitters separated <5 µm. Scale bars: 5 µm (a), 50 µm (c, d), 5 µm (e-h).
3. Results
3.1 Imaging mouse brain tumor tissue
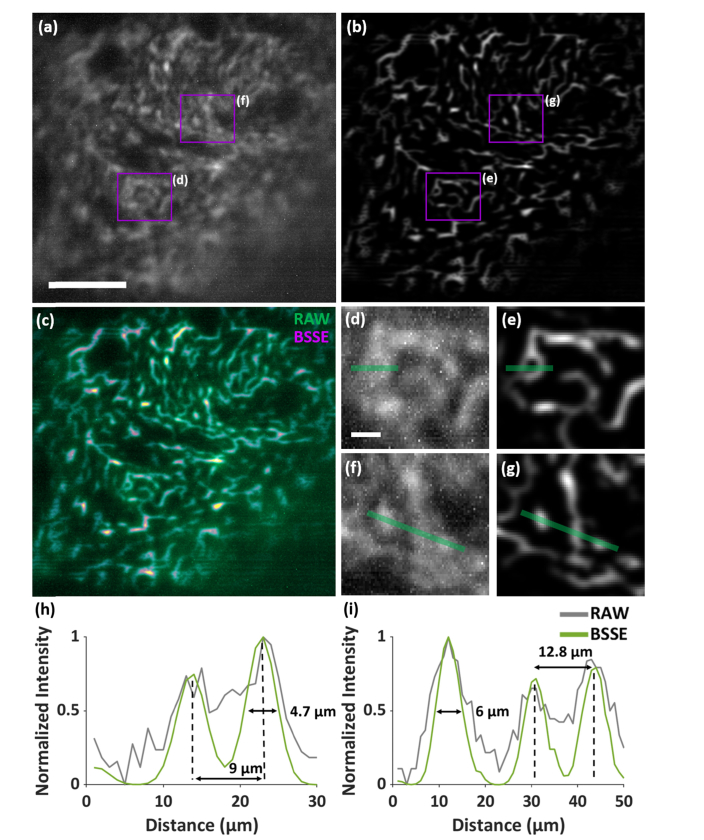
We first imaged orthotopic mouse brain tumor sections, where EGFP-expressing GL261 cells (GL261-EGFP) were stereo-tactically injected into the striatum of the brain near the ventricles. As seen in Fig. 4(a), the GL261-EGFP cells that were out-of-focus of the miniscope resulted in high background, deteriorating the in-focus signals detected. The signals were further diminished due to the stronger aberrations near the outer range of the FOV. In contrast, the use of BSSE substantially removed the background and enhanced theSNR by more than two orders of magnitude, as shown in Figs. 4(b)-4(g). The in-focus information from the previously overlapping signals can now be well sectioned and resolved, as shown in Figs. 4(h) and 4(i). By extracting the signals out of the high background and reducing the influence of aberrations, the method also effectively enlarged the FOV by >1.5 times (>300 µm × 300 µm). It should also be noted that the dynamic range of the images has been varied due to the improved SNR, so some existing dim structures become less visible, but they can be well displayed by adjusting the contrast of the BSSE-processed images. For the brain tissue images, a good correlation (>0.75) was shown between the raw and processed images by the Resolution Scaled Pearson’s coefficient (RSP), which scores the image quality with a normalized value between [-1, 1] [39].
Fig. 4.
Imaging mouse brain tumor. (a,b) Raw (a) and BSSE-processed (b) images of mouse brain tumor tissue after implantation of glioma GL261-EGFP cells. (c) Merged image of (a,b), showing the suppressed background and enhanced signals using BSSE. (d-g) Zoomed-in raw (d, f) and BSSE-processed (e,g) images of the corresponding boxed regions in (a,b). (h,i) Cross-sectional profiles along the solid lines in (d,e) and (f,g), respectively, exhibit enhanced resolution of cellular structures of the tumor tissue. RSP = 0.773. Scale bars: 100 µm (a), 15 µm (d).
3.2 Imaging transgenetic mouse tissue
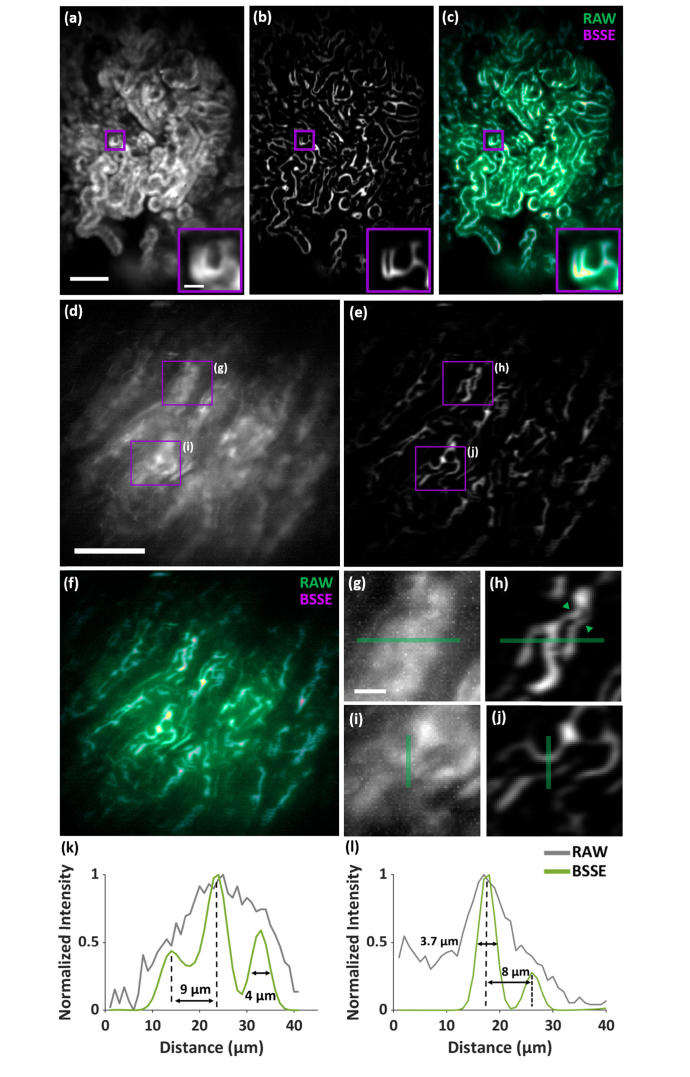
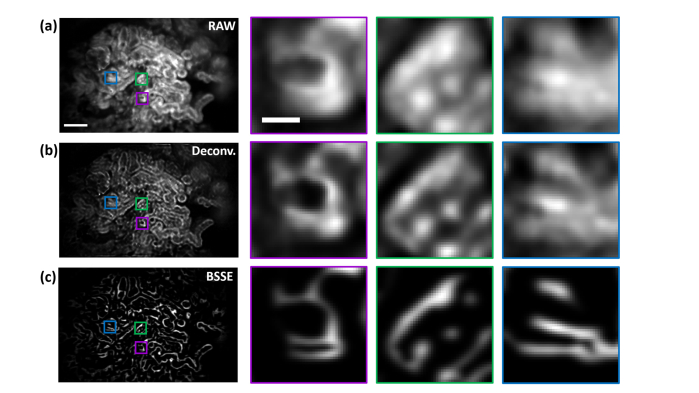
We next imaged mouse kidneys expressing EGFP driven by the beta-actin promoter using the miniscope, as shown in Fig. 5. The image of the mouse kidney cortex exhibited both highly overlapping signals and out-of-focus background from the convoluted tubules and glomerulus, as shown in Fig. 5(a). After BSSE processing, the image revealed substantially improved lining of tubular structures, as shown in Figs. 5(b) and 5(c). Furthermore, compared to the cortex, lower SNR was observed near the kidney medulla, where the kidney cells were barely visible, as shown in Fig. 5(d). The use of BSSE demonstrated improvement in this region, allowing enhanced resolution of the kidney medullar structures separated as close as ~3 µm, consistent with the measurement from the PSF, as shown in Fig. 1(c) and Figs. 5(e)-5(l). In addition, compared to deconvolution, BSSE can more effectively reduce the background and enhance the signals, as shown in Appendix D and Fig. 14.
Fig. 5.
Imaging mouse kidney tissue. (a,b) Raw (a) and BSSE-processed (b) images of the kidney cortex of beta actin-EGFP mice. (c) Merged image of (a, b), showing enhanced tubular structures with suppressed background using BSSE. RSP = 0.879. (d,e) Raw (d) and BSSE-processed (e) images of the kidney medulla of beta actin-EGFP mice. (f) Merged image of (d,e). (g-j) Zoomed-in images of the corresponding boxed regions in (d,e). (k,l) Cross-sectional profiles along the solid lines in (g, h) and (i, j), respectively, exhibiting enhanced resolution of cellular structures. The arrows in (h) indicate a well-resolved structure separated as close as 3.8 µm. RSP = 0.827. Scale bars: 100 µm (a,d), 15 µm (a inset and g).
Furthermore, healthy brains from mice in which cells express GFP under the Csf1r promoter [31] were also imaged, as shown in Appendix E and Fig. 15. Csf1r-driven GFP fluorescence primarily labels microglial cells in the brain. Using BSSE, the miniscope can detect GFP signal at the single cell level, where the nearby cellular structures as close as a few micrometers were resolved from the high background of the tissue and blood vessels after processing with BSSE.
3.3 Calcium imaging
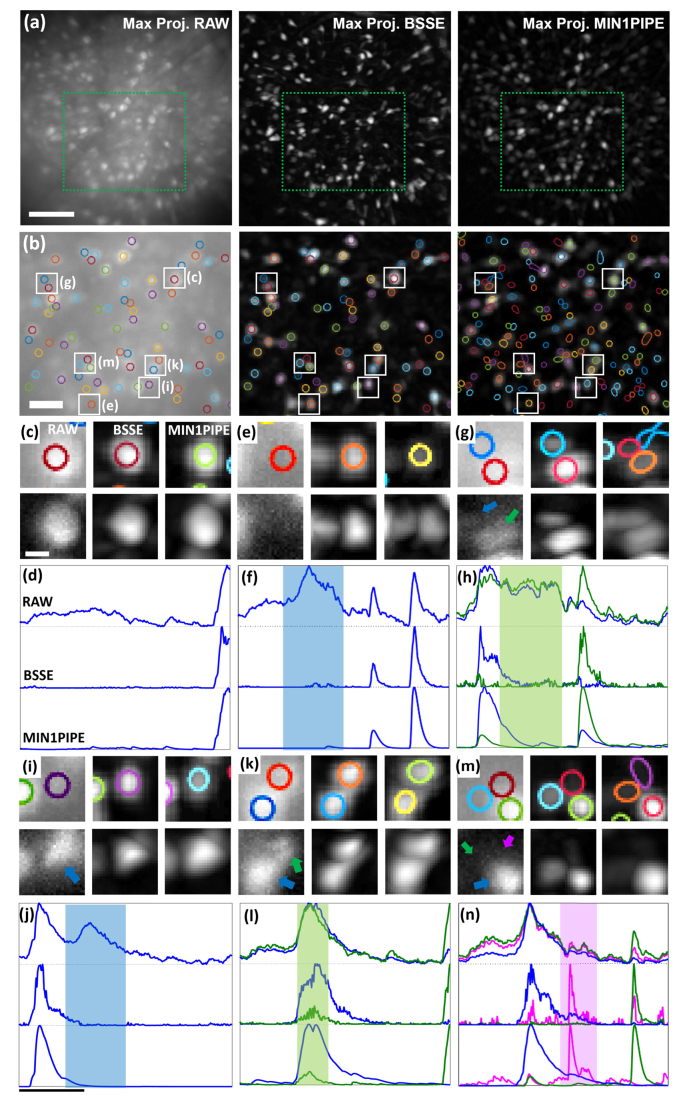
We next validated the performance of BSSE for in vivo calcium imaging of neural ensembles in freely behaving mice. The images were recorded using a commercially available single-photon based miniscope (Inscopix) at a frame rate of 20 Hz [32]. Due to the strong aberrations and background in the awake brain, the images were initially processed by BSSE using both Gaussian filtering and block-matching and 3D filtering [40] (the step IRaw to I0 in Fig. 2). As a result, the BSSE algorithm efficiently denoised the calcium transient activity of each cell and removed the strong, uneven background in the time-lapse data. With the BSSE processed image data, we were able to improve the maximum projection that allowed accurate manual identification of ROI components. In contrast, the identification became considerably restrictive using the raw images because of the highly overlapping signals and strongly fluctuating background, as shown in Fig. 6(a). Using the contours determined in the BSSE-processed image, we extracted normalized fluorescence traces ΔF/F from ROI components in both the raw and BSSE-processed images, as shown in Fig. 6(b). As seen, without processing, the raw data generated false positives or failed to identify neurons from overlapping ROIs, as shown in Figs. 6(c)-6(n). It should be mentioned that due to the intrinsic nonlinearity in the denoising process, the ΔF/F values may not be accurately preserved, though the more essential correlations or mutual information between the neurons can be correctly retained.
Fig. 6.
In vivo transient calcium imaging in freely behaving mice. (a) Left, example of the field of view of CA1 using the miniscope, displayed as the maximum temporal projection of fluorescence activity. Middle and right, the maximum projections of the frames individually processed by BSSE and MIN1PIPE, respectively. (b) The identified ROI contours superimposed on the corresponding boxed regions in (a), respectively. Left and middle, the contours were identified manually from the BSSE-processed data (a, middle). Right, the contours were identified using MIN1PIPE. (c,e,g,i,k,m) Six zoomed-in (top panel) and their contrast-adjusted (bottom panel) raw, BSSE-processed and MIN1PIPE-processed images of the corresponding ROI regions as marked in (b). (d,f,h,j,l,n) The corresponding normalized temporal fluorescence traces of six ROI examples as marked in (b). The shaded zones represent the false traces due to the cross-talk between neighboring neurons in the raw data, which were corrected by BSSE and MIN1PIPE. Scale bars: 100 µm (a), 50 µm (b), 10 µm (c), 5 sec (j).
In Fig. 6, we also confirmed our results using MIN1PIPE [26], an automatic, state-of-the-art method for processing calcium imaging data of miniscopes. MIN1PIPE contains several stand-alone modules to accurately separate spatially localized neural activity signals. For non-biased comparison, we used all suggested and optimized parameters in [26] and excluded automatic movement correction and post-extraction refinement steps for manually adding or removing neurons. Notably, the BSSE-processed calcium data provided comparable image quality that can facilitate identification with very few visually apparent false positives, as shown in Figs. 6(c)-6(n). It should be emphasized that the presentation of BSSE is not to compare with the cutting edge methods like CNMF [25] or MIN1PIPE [26]. On the other hand, we aimed to demonstrate its simplicity as a generic tool to improve wide-field miniscopy images for various tissue studies beyond functional brain imaging. The purpose of Fig. 6 is mainly to show that the method is compatible with calcium image processing, but we admit that the method has not been specialized to achieve many functions obtained with CNMF or MIN1PIPE such as accuracy and automation, though it can be readily compatible and implemented as a module in the automatized pipelines.
4. Conclusion
In summary, we demonstrated an image processing approach, termed BSSE, for single-photon-excitation-based, wide-field miniscopy images. It provides a simple, automatic solution to the challenges of overlapping signals, high background and artifacts in miniscopy images. We validated the method by imaging synthetic caliber patterns and biological samples of brain, tumor, and kidney tissues, as well as extracting neural functional signals. In addition, the method was demonstrated on both lab-built and commercial miniscopes, and the algorithmic framework can be readily integrated with many miniscopy control and processing modules, allowing for addressing a wide range of problems. Furthermore, the presented imaging results beyond neural activity suggests broader applications of the miniaturized, implantable and flexible technology.
Acknowledgments
We acknowledge the support of the NSF-CBET Biophotonics program, the SBU-SBMS program, the NSF-EFMA program, and the NIH-NIGMS MIRA program.
Appendix A: The point-spread function (PSF) of the miniscope using an achromatic lens.
Fig. 7.
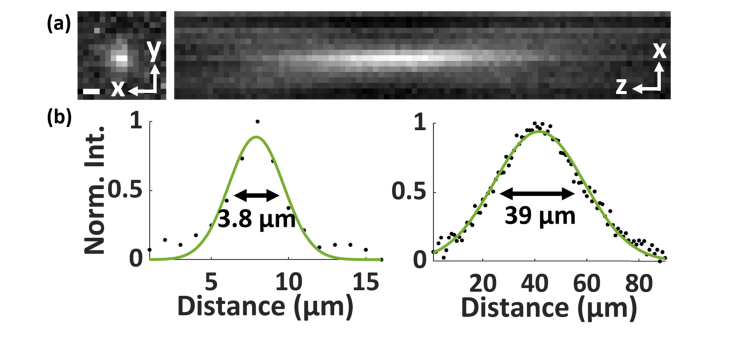
(a) The PSF of the miniscope using an achromatic lens as suggested by the open-source protocol. (b) The images were taken with a 200-nm fluorescent bead, exhibits FWHM values of 3.8 µm (left) and 39 µm (right) in the lateral and axial dimensions, respectively, showing slightly broadened PSF profiles compared to the profiles using an aspheric lens in Fig. 1. Scale bar: 3 μm.
Appendix B: Illustration of the BSSE algorithm using beta-actin EGFP mouse kidney tissue.
Fig. 8.
Illustration of the BSSE algorithm using beta-actin-EGFP mouse kidney tissue. (a-c) Architecture of the BSSE algorithm and BSSE-processed images of the kidney cortex of beta-actin-EGFP mice. As described in detail in Fig. 2, the results illustrate that the two main modules of the algorithm suppress the background (b) in the image IRaw, obtaining the image IBF, and enhance the signals (c), thus to obtain the final image IBSSE. (d) Cross-sectional profiles in the image IBF and its first-derivative image IG1 along the corresponding solid line in IG1. (e) Cross-sectional profiles along the solid color lines in IS and IG2, where IS represents the difference image between IBF and IG1, and IG2 is the second-derivative image of IBF. Concavity analysis is conducted to identify and segment the crossings of the overlapping signals (e.g. the shaded regions in (e)), obtaining the final image IBSSE. (f) Cross-sectional profiles in the images IRaw and IBSSE along the corresponding solid line in IBSSE. Scale bars: 100 µm (a, top row), 50 µm (a, left of the second row), 10 µm (a, right of the second row).
Appendix C: BSSE processing of synthetic caliber patterns.
Fig. 9.
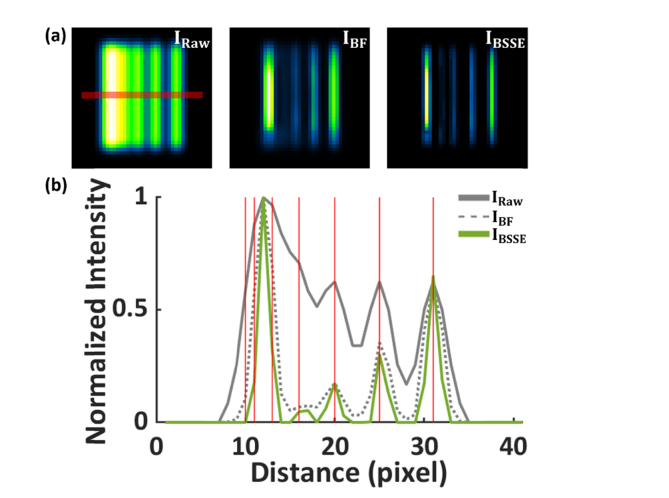
BSSE processing of synthetic caliber patterns. (a) Left to right, simulated raw image (left, IRaw), intermediate background-suppressed image (middle, IBF), and the final BSSE-processed image (right, IBSSE). (b) Intensity profiles of the images IRaw, IBF and IBSSE along the corresponding line in (a). The solid red lines in (b) denote the ground truth of the line positions of the pattern. The intervals between the two nearby lines start at 1 pixel and are constantly increased by 1 pixel from left to right. The two lines separated by 3 pixels were resolved in the image IBSSE but not in the images IRaw and IBF.
Fig. 10.
BSSE processing of the same synthetic caliber patterns as in Fig. 8 with varying SNRs. (a) Top, simulated raw image with PSNR = 61.58 dB. Bottom, the BSSE-processed image. The SSIM values compared to the ground truth are 0.1787 and 0.4581 for the raw and processed images, respectively. (b) Intensity profiles of the images along the corresponding lines in (a). (c) Top, simulated raw image with PSNR = 59.78 dB. Bottom, the BSSE-processed image. The SSIM values compared to the ground truth are 0.1319 and 0.3768 for the raw and processed images, respectively. (d) Intensity profiles of the images along the corresponding lines in (c).
Fig. 11.
BSSE processing of synthetic caliber patterns with varying distances. (a, c, e) The simulated raw (left) and BSSE-processed (right) images of two lines separated by 1 pixel (a), 2 pixels (b), and 3 pixels (c), respectively. (b, d, f) The intensity profiles of the images along the corresponding lines in (a, c, e), respectively. The results show that BSSE enhances the image quality by improving the SNR of the diffraction-limited images. A distance of 2 pixels is related to the diffraction limit in practice.
Fig. 12.
BSSE processing of synthetic caliber patterns with varying intensity. (a) Simulated underlying pattern with linearly varying intensity. (b,d,f) The simulated raw (top) and BSSE-processed (bottom) images of the pattern added with three different random noise patterns. (c, e, g) The intensity profiles of the images along the corresponding lines in (b,d,f), respectively. (h) BSSE processing of the same synthetic caliber pattern without noise. (i) Average peak intensity of BSSE-processed images (bottom panels in (b,d,f)) (green dots and error bars) and the peak intensity of the profile corresponding to the red line in (h) (gray dots). The green dots represent the mean value of BSSE-processed profiles of each row of pixels in (b,d,f) and the error bars stand for the standard deviation of these pixel values at each peak. The solid black line shows the linear relationship. Although the linear trend is largely retained, deviations from the linear relationship within the pattern can be observed for the BSSE-processed images with noisy raw data when the intensity becomes strong or weak. In contrast, the BSSE-processed image with noise-free raw data maintains acceptable linear relationship.
Fig. 13.
BSSE processing of synthetic caliber patterns. (a) Raw image of synthetic Siemens target caliber pattern with non-parallel and crossing structures. (b) BSSE-processed image. A gap can be observed near the center strong intensity region, because the algorithm processes the region as the background of the crossing region. (c) Merged image of the raw (a) and BSSE-processed (b) images. (d) Angular intensity plot of BSSE-processed image and the corresponding raw image along the red circle. BSSE shows distinct 12 caliber bars whereas raw have less resolved intensity peaks. (e) Intermediate signal-sharpened image IS’ using a halved the scale factor 0.5 × σ (see Fig. 2 caption), recovering the gap region as in (b). (f) Merged image of the original BSSE-processed (b) and adjusted intermediate image (e), showing the high-resolution structure without compromising background-like information.
Appendix D: Comparison with blind-deconvolution image processing.
Fig. 14.
Comparison with blind-deconvolution image processing. Left panel, raw (a), deconvolved (b), and BSSE-processed (c) images of the kidney cortex of beta actin-EGFP mice as in Fig. 5(a). Right panels, zoomed-in images of the corresponding color boxed regions. It can be observed that although deconvolution (10 iterations) sharpens the images, BSSE further reduces the background and enhances the signals. Scale bars: 100 µm (a, left), 15 µm (a, right).
Appendix E: Imaging and BSSE processing of Csf1r-EGFP mouse brain tissue.
Fig. 15.
Imaging and BSSE processing of Csf1r-EGFP mouse brain tissue. (a) Merged image of the raw and BSSE-processed images of Csf1r-EGFP mouse brain tissue. Csf1r-driven GFP fluorescence primarily labels microglial cells in the brain. (b) Zoomed-in raw (top) and BSSE-processed (bottom) images of the corresponding boxed region in (a). (c) Cross-sectional profiles of the raw and BSSE-processed images along the solid lines in (b). The results demonstrate enhanced cellular-level resolution of microglial structures, which otherwise would not be observed due to the strong background from the out-of-focus tissue and blood vessels (e.g. in (b)). RSP = 0.749. Scale bars: 100 µm (a), 15 µm (b).
Funding
National Institutes of Health grant R35GM124846 (to S.J.), SBMS program T32 GM127253 (to S.E.T.), National Science Foundation grants CBET1604565 and EFMA1830941 (to S.J.).
Disclosures
The authors declare that there are no conflicts of interest related to this article.
References
- 1.Ghosh K. K., Burns L. D., Cocker E. D., Nimmerjahn A., Ziv Y., Gamal A. E., Schnitzer M. J., “Miniaturized integration of a fluorescence microscope,” Nat. Methods 8(10), 871–878 (2011). 10.1038/nmeth.1694 [DOI] [PMC free article] [PubMed] [Google Scholar]
- 2.Flusberg B. A., Nimmerjahn A., Cocker E. D., Mukamel E. A., Barretto R. P. J., Ko T. H., Burns L. D., Jung J. C., Schnitzer M. J., “High-speed, miniaturized fluorescence microscopy in freely moving mice,” Nat. Methods 5(11), 935–938 (2008). 10.1038/nmeth.1256 [DOI] [PMC free article] [PubMed] [Google Scholar]
- 3.Ziv Y., Ghosh K. K., “Miniature microscopes for large-scale imaging of neuronal activity in freely behaving rodents,” Curr. Opin. Neurobiol. 32, 141–147 (2015). 10.1016/j.conb.2015.04.001 [DOI] [PubMed] [Google Scholar]
- 4.Betley J. N., Xu S., Cao Z. F. H., Gong R., Magnus C. J., Yu Y., Sternson S. M., “Neurons for hunger and thirst transmit a negative-valence teaching signal,” Nature 521(7551), 180–185 (2015). 10.1038/nature14416 [DOI] [PMC free article] [PubMed] [Google Scholar]
- 5.Carvalho Poyraz F., Holzner E., Bailey M. R., Meszaros J., Kenney L., Kheirbek M. A., Balsam P. D., Kellendonk C., “Decreasing Striatopallidal Pathway Function Enhances Motivation by Energizing the Initiation of Goal-Directed Action,” J. Neurosci. 36(22), 5988–6001 (2016). 10.1523/JNEUROSCI.0444-16.2016 [DOI] [PMC free article] [PubMed] [Google Scholar]
- 6.Douglass A. M., Kucukdereli H., Ponserre M., Markovic M., Gründemann J., Strobel C., Alcala Morales P. L., Conzelmann K. K., Lüthi A., Klein R., “Central amygdala circuits modulate food consumption through a positive-valence mechanism,” Nat. Neurosci. 20(10), 1384–1394 (2017). 10.1038/nn.4623 [DOI] [PubMed] [Google Scholar]
- 7.Pinto L., Dan Y., “Cell-Type-Specific Activity in Prefrontal Cortex during Goal-Directed Behavior,” Neuron 87(2), 437–450 (2015). 10.1016/j.neuron.2015.06.021 [DOI] [PMC free article] [PubMed] [Google Scholar]
- 8.Ziv Y., Burns L. D., Cocker E. D., Hamel E. O., Ghosh K. K., Kitch L. J., El Gamal A., Schnitzer M. J., “Long-term dynamics of CA1 hippocampal place codes,” Nat. Neurosci. 16(3), 264–266 (2013). 10.1038/nn.3329 [DOI] [PMC free article] [PubMed] [Google Scholar]
- 9.Cai D. J., Aharoni D., Shuman T., Shobe J., Biane J., Song W., Wei B., Veshkini M., La-Vu M., Lou J., Flores S. E., Kim I., Sano Y., Zhou M., Baumgaertel K., Lavi A., Kamata M., Tuszynski M., Mayford M., Golshani P., Silva A. J., “A shared neural ensemble links distinct contextual memories encoded close in time,” Nature 534(7605), 115–118 (2016). 10.1038/nature17955 [DOI] [PMC free article] [PubMed] [Google Scholar]
- 10.Jimenez J. C., Su K., Goldberg A. R., Luna V. M., Biane J. S., Ordek G., Zhou P., Ong S. K., Wright M. A., Zweifel L., Paninski L., Hen R., Kheirbek M. A., “Anxiety Cells in a Hippocampal-Hypothalamic Circuit,” Neuron 97(3), 670–683 (2018). 10.1016/j.neuron.2018.01.016 [DOI] [PMC free article] [PubMed] [Google Scholar]
- 11.Barbera G., Liang B., Zhang L., Gerfen C. R., Culurciello E., Chen R., Li Y., Lin D. T., “Spatially Compact Neural Clusters in the Dorsal Striatum Encode Locomotion Relevant Information,” Neuron 92(1), 202–213 (2016). 10.1016/j.neuron.2016.08.037 [DOI] [PMC free article] [PubMed] [Google Scholar]
- 12.Klaus A., Martins G. J., Paixao V. B., Zhou P., Paninski L., Costa R. M., “The Spatiotemporal Organization of the Striatum Encodes Action Space,” Neuron 95(5), 1171–1180 (2017). 10.1016/j.neuron.2017.08.015 [DOI] [PMC free article] [PubMed] [Google Scholar]
- 13.Cox J., Pinto L., Dan Y., “Calcium imaging of sleep-wake related neuronal activity in the dorsal pons,” Nat. Commun. 7(1), 10763 (2016). 10.1038/ncomms10763 [DOI] [PMC free article] [PubMed] [Google Scholar]
- 14.Harrison T. C., Pinto L., Brock J. R., Dan Y., “Calcium Imaging of Basal Forebrain Activity during Innate and Learned Behaviors,” Front. Neural Circuits 10, 36 (2016). 10.3389/fncir.2016.00036 [DOI] [PMC free article] [PubMed] [Google Scholar]
- 15.Yu K., Ahrens S., Zhang X., Schiff H., Ramakrishnan C., Fenno L., Deisseroth K., Zhao F., Luo M. H., Gong L., He M., Zhou P., Paninski L., Li B., “The central amygdala controls learning in the lateral amygdala,” Nat. Neurosci. 20(12), 1680–1685 (2017). 10.1038/s41593-017-0009-9 [DOI] [PMC free article] [PubMed] [Google Scholar]
- 16.Barretto R. P. J., Messerschmidt B., Schnitzer M. J., “In vivo fluorescence imaging with high-resolution microlenses,” Nat. Methods 6(7), 511–512 (2009). 10.1038/nmeth.1339 [DOI] [PMC free article] [PubMed] [Google Scholar]
- 17.Lee W. M., Yun S. H., “Adaptive aberration correction of GRIN lenses for confocal endomicroscopy,” Opt. Lett. 36(23), 4608–4610 (2011). 10.1364/OL.36.004608 [DOI] [PMC free article] [PubMed] [Google Scholar]
- 18.Murray T. A., Levene M. J., “Singlet gradient index lens for deep in vivo multiphoton microscopy,” J. Biomed. Opt. 17(2), 021106 (2012). 10.1117/1.JBO.17.2.021106 [DOI] [PubMed] [Google Scholar]
- 19.Maruyama R., Maeda K., Moroda H., Kato I., Inoue M., Miyakawa H., Aonishi T., “Detecting cells using non-negative matrix factorization on calcium imaging data,” Neural Netw. 55, 11–19 (2014). 10.1016/j.neunet.2014.03.007 [DOI] [PubMed] [Google Scholar]
- 20.Pachitariu M., Packer A. M., Pettit N., Dalgleish H., Hausser M., Sahani M., “Extracting regions of interest from biological images with convolutional sparse block coding,” NIPS, Proc. Adv. Neural Inf. Process. Syst. 1, 1745–1753 (2013). [Google Scholar]
- 21.Pnevmatikakis E. A., Soudry D., Gao Y., Machado T. A., Merel J., Pfau D., Reardon T., Mu Y., Lacefield C., Yang W., Ahrens M., Bruno R., Jessell T. M., Peterka D. S., Yuste R., Paninski L., “Simultaneous Denoising, Deconvolution, and Demixing of Calcium Imaging Data,” Neuron 89(2), 285–299 (2016). 10.1016/j.neuron.2015.11.037 [DOI] [PMC free article] [PubMed] [Google Scholar]
- 22.Reidl J., Starke J., Omer D. B., Grinvald A., Spors H., “Independent component analysis of high-resolution imaging data identifies distinct functional domains,” Neuroimage 34(1), 94–108 (2007). 10.1016/j.neuroimage.2006.08.031 [DOI] [PubMed] [Google Scholar]
- 23.Liberti W. A., III, Perkins L. N., Leman D. P., Gardner T. J., “An open source, wireless capable miniature microscope system,” J. Neural Eng. 14(4), 045001 (2017). 10.1088/1741-2552/aa6806 [DOI] [PMC free article] [PubMed] [Google Scholar]
- 24.Mukamel E. A., Nimmerjahn A., Schnitzer M. J., “Automated Analysis of Cellular Signals from Large-Scale Calcium Imaging Data,” Neuron 63(6), 747–760 (2009). 10.1016/j.neuron.2009.08.009 [DOI] [PMC free article] [PubMed] [Google Scholar]
- 25.Zhou P., Resendez S. L., Rodriguez-Romaguera J., Jimenez J. C., Neufeld S. Q., Giovannucci A., Friedrich J., Pnevmatikakis E. A., Stuber G. D., Hen R., Kheirbek M. A., Sabatini B. L., Kass R. E., Paninski L., “Efficient and accurate extraction of in vivo calcium signals from microendoscopic video data,” eLife 7, e28728 (2018). 10.7554/eLife.28728 [DOI] [PMC free article] [PubMed] [Google Scholar]
- 26.Lu J., Li C., Singh-Alvarado J., Zhou Z. C., Fröhlich F., Mooney R., Wang F., “MIN1PIPE: A Miniscope 1-Photon-Based Calcium Imaging Signal Extraction Pipeline,” Cell Reports 23(12), 3673–3684 (2018). 10.1016/j.celrep.2018.05.062 [DOI] [PMC free article] [PubMed] [Google Scholar]
- 27.Zhai H., Heppner F. L., Tsirka S. E., “Microglia/macrophages promote glioma progression,” Glia 59(3), 472–485 (2011). 10.1002/glia.21117 [DOI] [PMC free article] [PubMed] [Google Scholar]
- 28.Miyauchi J. T., Chen D., Choi M., Nissen J. C., Shroyer K. R., Djordevic S., Zachary I. C., Selwood D., Tsirka S. E., “Ablation of Neuropilin 1 from glioma-associated microglia and macrophages slows tumor progression,” Oncotarget 7(9), 9801–9814 (2016). 10.18632/oncotarget.6877 [DOI] [PMC free article] [PubMed] [Google Scholar]
- 29.Miyauchi J. T., Caponegro M. D., Chen D., Choi M. K., Li M., Tsirka S. E., “Deletion of neuropilin 1 from microglia or bone marrow–derived macrophages slows glioma progression,” Cancer Res. 78(3), 685–694 (2018). 10.1158/0008-5472.CAN-17-1435 [DOI] [PMC free article] [PubMed] [Google Scholar]
- 30.Okabe M., Ikawa M., Kominami K., Nakanishi T., Nishimune Y., “‘Green mice’ as a source of ubiquitous green cells,” FEBS Lett. 407(3), 313–319 (1997). 10.1016/S0014-5793(97)00313-X [DOI] [PubMed] [Google Scholar]
- 31.Sasmono R. T., Oceandy D., Pollard J. W., Tong W., Pavli P., Wainwright B. J., Ostrowski M. C., Himes S. R., Hume D. A., “A macrophage colony-stimulating factor receptor-green fluorescent protein transgene is expressed throughout the mononuclear phagocyte system of the mouse,” Blood 101(3), 1155–1163 (2003). 10.1182/blood-2002-02-0569 [DOI] [PubMed] [Google Scholar]
- 32.Mau W., Sullivan D. W., Kinsky N. R., Hasselmo M. E., Howard M. W., Eichenbaum H., “The Same Hippocampal CA1 Population Simultaneously Codes Temporal Information over Multiple Timescales,” Curr. Biol. 28(10), 1499–1508 (2018). 10.1016/j.cub.2018.03.051 [DOI] [PMC free article] [PubMed] [Google Scholar]
- 33.Gonzalez R. C., Woods R. E., Digital Image Processing (3rd Edition) (2007). [Google Scholar]
- 34.Otsu N., “A threshold selection method from gray level histograms,” IEEE Trans. Syst. Man Cybern. 9(1), 62–66 (1979). 10.1109/TSMC.1979.4310076 [DOI] [Google Scholar]
- 35.Dabov K., Foi A., Katkovnik V., Egiazarian K., “Image denoising with block-matching and 3D filtering,” Proc. SPIE-IS&T Electron. Imaging 6064, 606414 (2006). [Google Scholar]
- 36.Ma H., Long F., Zeng S., Huang Z. L., “Fast and precise algorithm based on maximum radial symmetry for single molecule localization,” Opt. Lett. 37(13), 2481–2483 (2012). 10.1364/OL.37.002481 [DOI] [PubMed] [Google Scholar]
- 37.Gustafsson N., Culley S., Ashdown G., Owen D. M., Pereira P. M., Henriques R., “Fast live-cell conventional fluorophore nanoscopy with ImageJ through super-resolution radial fluctuations,” Nat. Commun. 7(1), 12471 (2016). 10.1038/ncomms12471 [DOI] [PMC free article] [PubMed] [Google Scholar]
- 38.Babaud J., Witkin A. P., Baudin M., Duda R. O., “Uniqueness of the Gaussian Kernel for Scale-Space Filterng,” IEEE Trans. Pattern Anal. Mach. Intell. PAMI 8, 26–33 (1986). 10.1109/TPAMI.1986.4767749 [DOI] [PubMed] [Google Scholar]
- 39.Culley S., Albrecht D., Jacobs C., Pereira P. M., Leterrier C., Mercer J., Henriques R., “Quantitative mapping and minimization of super-resolution optical imaging artifacts,” Nat. Methods 15(4), 263–266 (2018). 10.1038/nmeth.4605 [DOI] [PMC free article] [PubMed] [Google Scholar]
- 40.K. Dabov, A. Foi, V. Katkovnik, and K. Egiazarian, “Image denoising with block-matching and 3D filtering,” Proc. SPIE 606414, Image Processing: Algorithms and Systems, Neural Networks, and Machine Learning (2006).


