Abstract
Background
Aflatoxin B1 (AFB1) exposure is a crucial factor to initiate hepatocellular carcinoma (HCC). However, comprehensive microRNA (miRNA)‐message RNA (mRNA) regulatory network regarding AFB1‐associated HCC is still lacking. This work was aimed to identify miRNA‐mRNA network in primary human hepatocytes after AFB1 exposure.
Methods
A miRNA expression dataset GSE71540 obtained from the gene expression omnibus (GEO) was used to identify differentially expressed miRNAs (DEMs) after AFB1 exposure using GEO2R. Target genes of these DEMs were identified using TargetScan V_7.2, miRDB, PITA, miRanda, and miRTarBase. Gene ontology (GO) annotation and Kyoto Encyclopedia of Genes and Genomes (KEGG) enrichment analyses were performed at Database for Annotation, Visualization and Integrated Discovery (DAVID). miRNA‐mRNA regulatory network was established by analyzing three enriched KEGG pathways significantly correlated with HCC onset and then visualized at CytoScape.
Results
In this work, nine upregulated and nine downregulated DEMs were identified. Functional enrichment analyses showed that these predicted target genes were significantly associated with cancer development. Analysis of three enriched pathways related to the onset of HCC identified 13 and nine target genes for upregulated DEMs and downregulated DEMs, respectively. Subsequently, the miRNA‐mRNA regulatory networks were constructed.
Conclusions
In conclusion, miRNA‐mRNA regulatory network was established, which will help to understand the mechanism underlying the AFB1‐induced onset of HCC.
Keywords: aflatoxin B1, hepatocellular carcinoma, miRNA/mRNA regulatory network
1. INTRODUCTION
Liver cancer ranks the fourth place of all newly identified cancer cases but the third place of cancer‐related deaths in China (Chen et al., 2016). Hepatocellular carcinoma (HCC) alone is reported to represent about 75%–85% of all liver cancer cases (Bray et al., 2018). Exposure to aflatoxin B1 (AFB1) is considered as a trigger for the initiation of HCC (Llovet et al., 2016). However, genes alteration in primary human hepatocytes after AFB1 exposure remains to be elucidated.
Aflatoxin B1 is believed to be transformed to AFB1‐8,9‐epoxide by a specific P450 enzyme and then interact with cellular proteins or DNA to increase the risk of developing into HCC (Groopman, Kensler, & Wild, 2008). It has also been recognized that AFB1 exposure will cause persistent epigenetic changes (Ferreira et al., 2019; Rieswijk et al., 2016). For example, the mutation of P53 (191170), a well‐characterized tumor suppressor gene, is often found in tissues or cells encountered with AFB1, which will lead to the loss function of P53 (Shen & Ong, 1996). Moreover, it was found that exposure of AFB1 will cause aberrant methylation status in genes including RUNT RELATED TRANSCRIPTION FACTOR 3 (600210), LONG INTERSPERSED NUCLEAR ELEMENT 1 (151626), and so on to initiate carcinogenesis (Wang et al., 2017). In addition, specifically altered microRNA (miRNA) including MIR‐4651 and MIR‐34a (611172) have been observed in AFB1‐induced hepatotoxicity (Wu et al., 2017; Zhu et al., 2015). However, genes altered after AFB1 exposure in human hepatocytes remain to be elucidated.
MicroRNAs are endogenous noncoding RNAs with the length of 18–25 nucleotides, which can directly regulate gene expression through 3’‐untranslated region binding (Bartel, 2009). It has been reported that miRNAs are crucial modulators for various cellular behaviors including cell growth, invasion, apoptosis, and so on (Gandellini, Doldi, & Zaffaroni, 2017; Jafri, Al‐Qahtani & Shay, 2017). Studies focusing on the investigations of abnormally expressed miRNAs in human cancers revealed that miRNA has crucial roles in tumorigenesis (Gandellini et al., 2017; Jafri et al., 2017).
Here, we are interested to investigate abnormally expressed miRNAs after AFB1 exposure with the aim to understand key miRNAs that can trigger HCC carcinogenesis. Therefore, in this study, we investigated dysregulated miRNAs in human hepatocytes treated with AFB1. Finally, novel miRNA‐message RNA (mRNA) regulatory networks associated with HCC onset were constructed.
2. MATERIALS AND METHODS
2.1. Microarray dataset
GSE71540, obtained from Gene Expression Omnibus (https://www.ncbi.nlm.nih.gov/geo/query/acc.cgi?acc=GSE71540), is a miRNA expression profile dataset submitted by Linda Rieswijk. This dataset contained data from primary human hepatocytes subjected to 1 µM of AFB1 for 5 days followed by a 3 days wash‐out period or not.
2.2. Identification of differentially expressed miRNAs
GEO2R, an algorithm based on R language limma package, was employed to analyze differentially expressed miRNAs (DEMs) in this dataset. Cut‐off criteria were set as p < .05 and |log2 fold‐change| ≥ 1.5. Volcano plot was established using the plug‐in tool at SangerBox (http://sangerbox.com) to help us identify the overlapping genes. Heatmap was also built by plug‐in tool at SangerBox (http://sangerbox.com) to give a direct presentation of the expression status of genes in different samples.
2.3. Identification of target genes for DEMs
Targets of these identified DEMs were predicted at five miRNA target prediction websites including TargetScan V_7.2 (http://www.targetscan.org/vert_72/, Agarwal, Bell, Nam, & Bartel, 2015), miRDB (http://www.mirdb.org/miRDB/index.html, Liu & Wang, 2019), PITA (https://genie.weizmann.ac.il/pubs/mir07/mir07_data.html, Kertesz, Iovino, Unnerstall, Gaul, & Segal, 2007), miRanda (http://www.microrna.org/microrna/home.do, Betel, Wilson, Gabow, Marks, & Sander, 2008), and miRTarBase (http://mirtarbase.mbc.nctu.edu.tw/php/index.php, Chou et al., 2018). Target predicted by at least three algorithms were selected for the following studies.
2.4. Functional analyses
Database for Annotation, Visualization and Integrated Discovery (DAVID; https://david.ncifcrf.gov, Jiao et al., 2012) was employed to perform gene ontology (GO) including cellular component (CC), molecular function (MF), and biological process (BP) analysis and Kyoto Encyclopedia of Genes and Genomes (KEGG) analysis with the purpose of understanding the biological functions of these genes. Parameter p < .01 was used as threshold.
2.5. Gene expression level validation
The expression level of DEMs and their target was validated at StarBase (Li, Liu, Zhou, Qu, & Yang, 2014).
2.6. miRNA‐mRNA regulatory network construction
miRNA‐mRNA regulatory network related to the onset of HCC was visualized using CytoScape V_3.6.0 software (Shannon et al., 2003).
3. RESULTS
3.1. Identification of DEMs
As presented in Figure 1, nine upregulated and nine downregulated DEMs were identified in primary human hepatocytes with AFB1 exposure compared to those without. Moreover, heatmap of identified DEMs was presented in Figure 2. We showed that the samples with or without AFB1 treatment were clearly divided into two groups, suggesting the reliability to analyze DEMs in the following experiments.
Figure 1.
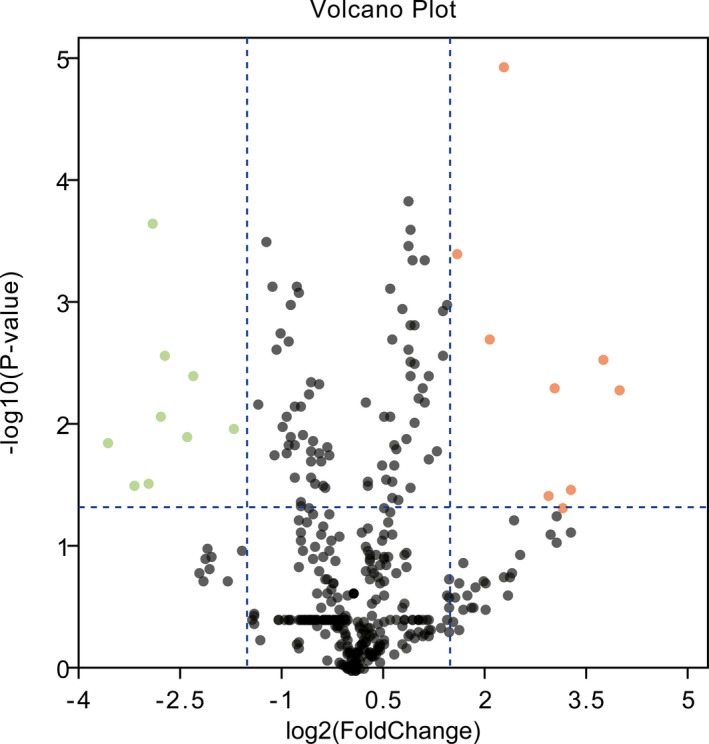
Volcano Plot of differentially expressed miRNAs. Abscissa axis indicates log2 (Fold Change). Vertical axis indicates −log10 (p value). Green represents downregulated miRNAs. Red represents upregulated miRNAs. Black indicates no significantly differentially expressed miRNAs. miRNAs, microRNAs
Figure 2.
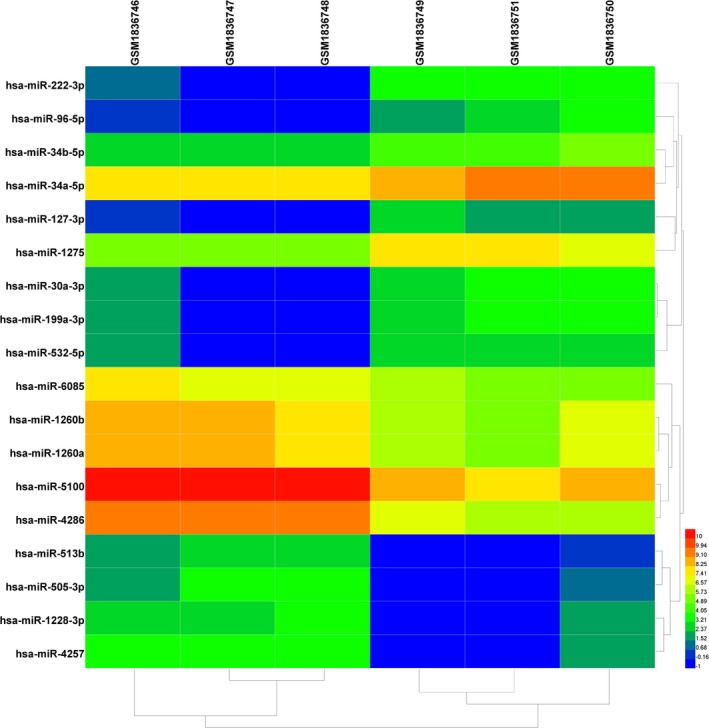
Heat map of differentially expressed miRNAs. Changes in p < .05 and |log2 fold‐change| ≥ 1.5 are illustrated by a heat map. miRNAs, microRNAs
3.2. Target genes of DEMs
Five miRNA target prediction algorithms were employed to analyze potential targets of these identified DEMs. Targets predicted by at least 3 algorithms were selected for followingly analyses. Tables 1 and 2 displayed the targets that contained the most and second‐most binding sites for upregulated and downregulated DEMs, respectively.
Table 1.
Targets contain the most and second‐most binding site for upregulated DEMs
| Target | miRNA list |
|---|---|
| KMT2A | hsa‐miR‐222‐3p, hsa‐miR‐96‐5p, hsa‐miR‐30a‐3p, hsa‐miR‐199a‐3p |
| ANKRD52 | hsa‐miR‐222‐3p, hsa‐miR‐96‐5p, hsa‐miR‐199a‐3p |
| NAP1L1 | hsa‐miR‐222‐3p, hsa‐miR‐30a‐3p, hsa‐miR‐199a‐3p |
| NAA25 | hsa‐miR‐222‐3p, hsa‐miR‐30a‐3p, hsa‐miR‐199a‐3p |
| RFX7 | hsa‐miR‐222‐3p, hsa‐miR‐30a‐3p, hsa‐miR‐199a‐3p |
| CTDSPL2 | hsa‐miR‐222‐3p, hsa‐miR‐30a‐3p, hsa‐miR‐532‐5p |
| PPP3R1 | hsa‐miR‐222‐3p, hsa‐miR‐96‐5p, hsa‐miR‐30a‐3p |
| REV1 | hsa‐miR‐222‐3p, hsa‐miR‐96‐5p, hsa‐miR‐30a‐3p |
| BRWD1 | hsa‐miR‐222‐3p, hsa‐miR‐96‐5p, hsa‐miR‐30a‐3p |
| ARF4 | hsa‐miR‐222‐3p, hsa‐miR‐96‐5p, hsa‐miR‐30a‐3p |
| FOXP1 | hsa‐miR‐222‐3p, hsa‐miR‐34b‐5p, hsa‐miR‐34a‐5p |
| SNX4 | hsa‐miR‐222‐3p, hsa‐miR‐96‐5p, hsa‐miR‐34a‐5p |
| MITF | hsa‐miR‐222‐3p, hsa‐miR‐96‐5p, hsa‐miR‐34b‐5p |
| RNF4 | hsa‐miR‐222‐3p, hsa‐miR‐34b‐5p, hsa‐miR‐34a‐5p |
| PURA | hsa‐miR‐222‐3p, hsa‐miR‐199a‐3p, hsa‐miR‐532‐5p |
| UBE2J1 | hsa‐miR‐222‐3p, hsa‐miR‐30a‐3p, hsa‐miR‐199a‐3p |
| QKI | hsa‐miR‐222‐3p, hsa‐miR‐30a‐3p, hsa‐miR‐199a‐3p |
| CAMK2N1 | hsa‐miR‐96‐5p, hsa‐miR‐30a‐3p, hsa‐miR‐532‐5p |
| RARG | hsa‐miR‐96‐5p, hsa‐miR‐30a‐3p, hsa‐miR‐34a‐5p |
| ZDHHC17 | hsa‐miR‐96‐5p, hsa‐miR‐30a‐3p, hsa‐miR‐34a‐5p |
| ARPP19 | hsa‐miR‐96‐5p, hsa‐miR‐532‐5p, hsa‐miR‐1275 |
| VAT1 | hsa‐miR‐96‐5p, hsa‐miR‐30a‐3p, hsa‐miR‐34a‐5p |
| MAPRE1 | hsa‐miR‐96‐5p, hsa‐miR‐30a‐3p, hsa‐miR‐199a‐3p |
| FAM49B | hsa‐miR‐96‐5p, hsa‐miR‐199a‐3p, hsa‐miR‐34b‐5p |
| ARID4B | hsa‐miR‐30a‐3p, hsa‐miR‐34b‐5p, hsa‐miR‐34a‐5p |
| SH3PXD2A | hsa‐miR‐30a‐3p, hsa‐miR‐532‐5p, hsa‐miR‐1275 |
| TAOK1 | hsa‐miR‐30a‐3p, hsa‐miR‐199a‐3p, hsa‐miR‐1275 |
| NOTCH1 | hsa‐miR‐30a‐3p, hsa‐miR‐34b‐5p, hsa‐miR‐34a‐5p |
Abbreviation: DEMs, differentially expressed microRNAs.
Table 2.
Targets contain the most and second‐most binding site for downregulated DEMs
| Target | miRNA list |
|---|---|
| TNRC6B | hsa‐miR‐1260b, hsa‐miR‐513b, hsa‐miR‐4286, hsa‐miR‐1228‐3p, hsa‐miR‐4257 |
| ZFHX4 | hsa‐miR‐6085, hsa‐miR‐513b, hsa‐miR‐1228‐3p, hsa‐miR‐4257 |
| POU2F1 | hsa‐miR‐1260b, hsa‐miR‐4286, hsa‐miR‐1228‐3p, hsa‐miR‐4257 |
| TFDP2 | hsa‐miR‐1260b, hsa‐miR‐5100, hsa‐miR‐4286, hsa‐miR‐1260a |
| FAM122B | hsa‐miR‐1260b, hsa‐miR‐513b, hsa‐miR‐4286, hsa‐miR‐505‐3p |
| NUFIP2 | hsa‐miR‐1260b, hsa‐miR‐5100, hsa‐miR‐1228‐3p, hsa‐miR‐1260a |
| FAM222B | hsa‐miR‐6085, hsa‐miR‐5100, hsa‐miR‐4286, hsa‐miR‐1228‐3p |
| TBL1XR1 | hsa‐miR‐5100, hsa‐miR‐513b, hsa‐miR‐4286, hsa‐miR‐4257 |
| CELF1 | hsa‐miR‐513b, hsa‐miR‐4286, hsa‐miR‐505‐3p, hsa‐miR‐4257 |
Abbreviation: DEMs, differentially expressed microRNAs.
3.3. Functional analyses of the upregulated or downregulated DEMs
Gene ontology analysis including BP, CC and MF terms for the targets of upregulated or downregulated DEMs were performed to understand the roles of these DEMs. As displayed in Tables 3 and 4, our results revealed that these DEMs have crucial roles in regulating gene expression and cell behaviors. KEGG pathway enrichment analysis in Figure 3a,b revealed that the most enriched pathways were related to cancer development.
Table 3.
GO analysis of targets of the upregulated DEMs
| Category | ID | Description | Count | p value |
|---|---|---|---|---|
| Biological process | GO:0045944 | Positive regulation of transcription from RNA polymerase II promoter | 174 | 5.08E‐22 |
| GO:0000122 | Negative regulation of transcription from RNA polymerase II promoter | 121 | 1.66E‐13 | |
| GO:0045893 | Positive regulation of transcription, DNA‐templated | 94 | 1.00E‐12 | |
| GO:0006366 | Transcription from RNA polymerase II promoter | 91 | 1.22E‐11 | |
| GO:0045892 | Negative regulation of transcription, DNA‐templated | 80 | 2.79E‐08 | |
| Molecular function | GO:0005515 | Protein binding | 934 | 3.94E‐29 |
| GO:0003700 | Transcription factor activity, sequence‐specific DNA binding | 142 | 1.69E‐11 | |
| GO:0001077 | Transcriptional activator activity, RNA polymerase II core promoter proximal region sequence‐specific binding | 49 | 6.02E‐09 | |
| GO:0000978 | RNA polymerase II core promoter proximal region sequence‐specific DNA binding | 64 | 8.19E‐09 | |
| GO:0043565 | Sequence‐specific DNA binding | 81 | 5.53E‐08 | |
| Cellular component | GO:0005654 | Nucleoplasm | 351 | 1.12E‐19 |
| GO:0005737 | Cytoplasm | 563 | 1.53E‐16 | |
| GO:0005634 | Nucleus | 579 | 1.72E‐16 | |
| GO:0005829 | Cytosol | 372 | 1.52E‐12 | |
| GO:0016020 | Membrane | 266 | 2.97E‐12 |
Abbreviations: DEMs, differentially expressed microRNAs; GO, gene ontology.
Table 4.
GO analysis of targets of the downregulated DEMs
| Category | ID | Description | Count | p value |
|---|---|---|---|---|
| Biological process | GO:0050789 | Regulation of biological process | 1751 | 3.20E‐14 |
| GO:0032502 | Developmental process | 971 | 2.54E‐12 | |
| GO:0065007 | Biological regulation | 1823 | 4.59E‐12 | |
| GO:0008152 | Metabolic process | 1739 | 1.54E‐09 | |
| GO:0009987 | Cellular process | 2,326 | 2.36E‐08 | |
| Molecular function | GO:0003700 | Transcription factor activity, sequence‐specific DNA binding | 211 | 2.91E‐10 |
| GO:0005515 | Protein binding | 1,418 | 1.46E‐09 | |
| GO:0003677 | DNA binding | 329 | 2.10E‐09 | |
| GO:0046872 | Metal ion binding | 371 | 5.25E‐06 | |
| GO:0,004,674 | Protein serine/threonine kinase activity | 87 | 9.51E‐06 | |
| Cellular component | GO:0005654 | Nucleoplasm | 513 | 2.50E‐10 |
| GO:0005634 | Nucleus | 912 | 2.98E‐09 | |
| GO:0005737 | Cytoplasm | 861 | 6.78E‐07 | |
| GO:0030054 | Cell junction | 102 | 6.97E‐06 | |
| GO:0045202 | Synapse | 47 | 6.87E‐05 |
Abbreviations: DEMs, differentially expressed microRNAs; GO, gene ontology.
Figure 3.
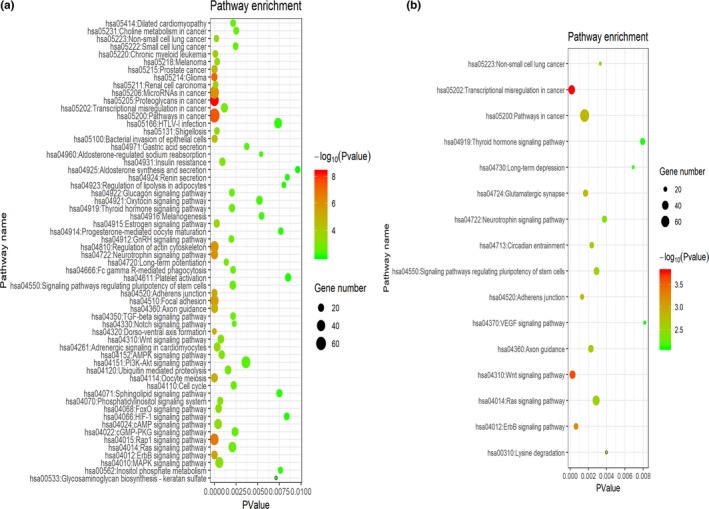
Bubble chart of KEGG pathway enrichment analyses for (a) Upregulated DEMs and (b) downregulated DEMs. Different bubble color represents p value. Red indicates strong significance. Bubble size indicates gene numbers enriched in pathway. DEMs, differentially expressed microRNAs; KEGG, Kyoto Encyclopedia of Genes and Genomes
3.4. Validation of DEMs expression in HCC using StarBase
Next, we validated the expression of the DEMs identified in HCC. As presented in Figure 4, the expression pattern of hsa‐MIR‐505‐3p, hsa‐MIR‐1228‐3p, hsa‐MIR‐4286, and hsa‐MIR‐5100 of the nine downregulated DEMs was similar to the GEO dataset. For the nine upregulated DEMs, we found that all of them exhibited a similar expression trend in HCC as compared with the GEO dataset (Figure 5).
Figure 4.
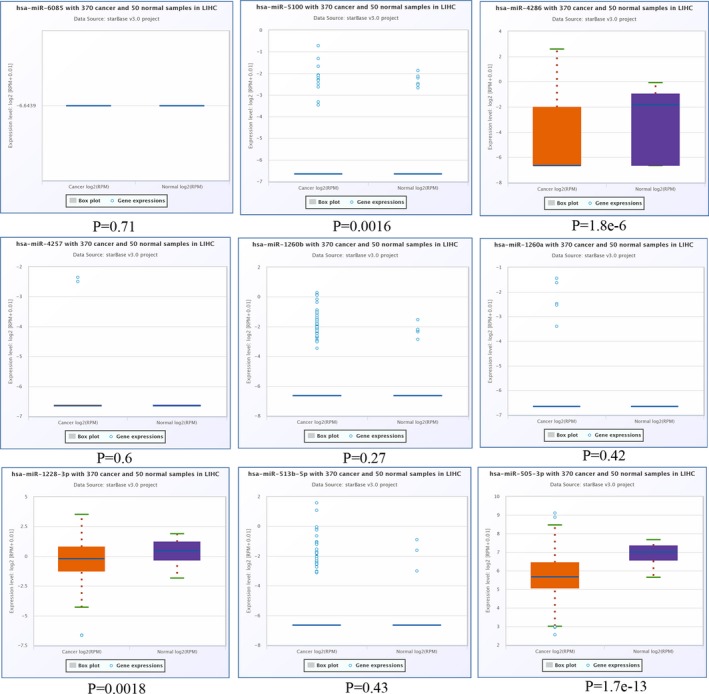
Validation of the expression pattern of downregulated DEMs in StarBase. DEMs, differentially expressed microRNAs
Figure 5.
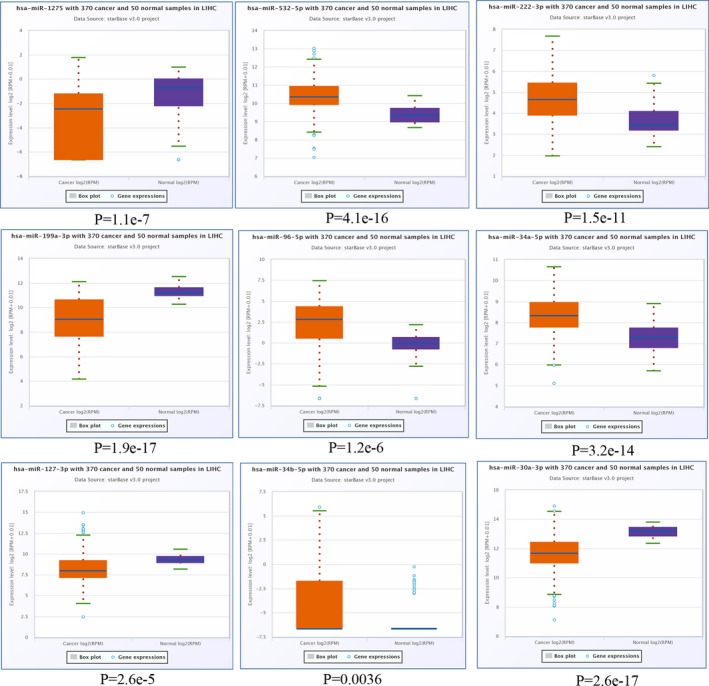
Validation of the expression pattern of upregulated DEMs in StarBase. DEMs, differentially expressed microRNAs
3.5. Regulatory network analysis
We were interested to identify miRNA‐mRNA networks after AFB1 exposure. Hence, three KEGG pathways related to cancer initiation were selected after pathway enrichment analyses. Three KEGG pathways including miRNAs in cancer, Pathways in cancer, and PI3K‐Akt signaling pathway for upregulated DEMs were selected and 13 overlapping genes were identified for following analyses (Figure 6a). The expression of these 13 genes in HCC was validated in StarBase, and 10 of them were found to be abnormally expressed (Figure 6b). Similarly, the pathways including Pathways in cancer, Ras signaling pathway, and VEGF signaling pathway for downregulated DEMs were analyzed with nine genes identified as shown in Figure 7a. Also, we confirmed the expression of these 9 genes in HCC using Starbase. We found 6 (MAPK1 (176948), NRAS (164790), PIK3R3 (606076), PLCG1 (172420), PRKCA (176960), and PRKCB (176970)) of them were indeed elevated expresion in HCC (Figure 7b). Based on these results, we further established the miRNA‐mRNA regulatory network for upregulated DEMs (Figure 8a) and downregulated DEMs (Figure 8b). As shown in Figure 8a, hsa‐MIR‐96‐5p (611606) targeted the largest number of genes in the network. Meanwhile, we found only one downregulated miRNA, hsa‐MIR‐4286 in Figure 8b.
Figure 6.
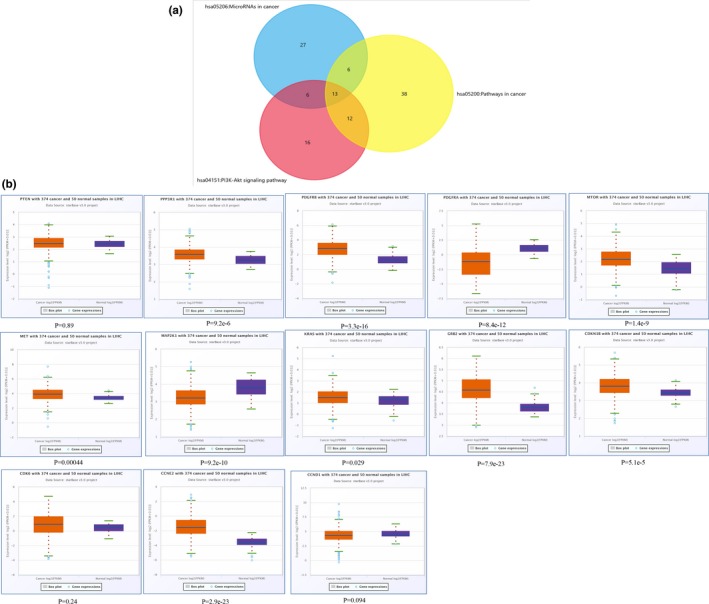
Identification of genes related to HCC progression for upregulated DEMs. (a) Venn diagram indicated intersection of three pathways associated with onset of HCC for the target genes of upregulated DEMs. (b) Validation of the overlapping gene of these three pathways using StarBase. DEMs, differentially expressed microRNAs; HCC, hepatocellular carcinoma
Figure 7.
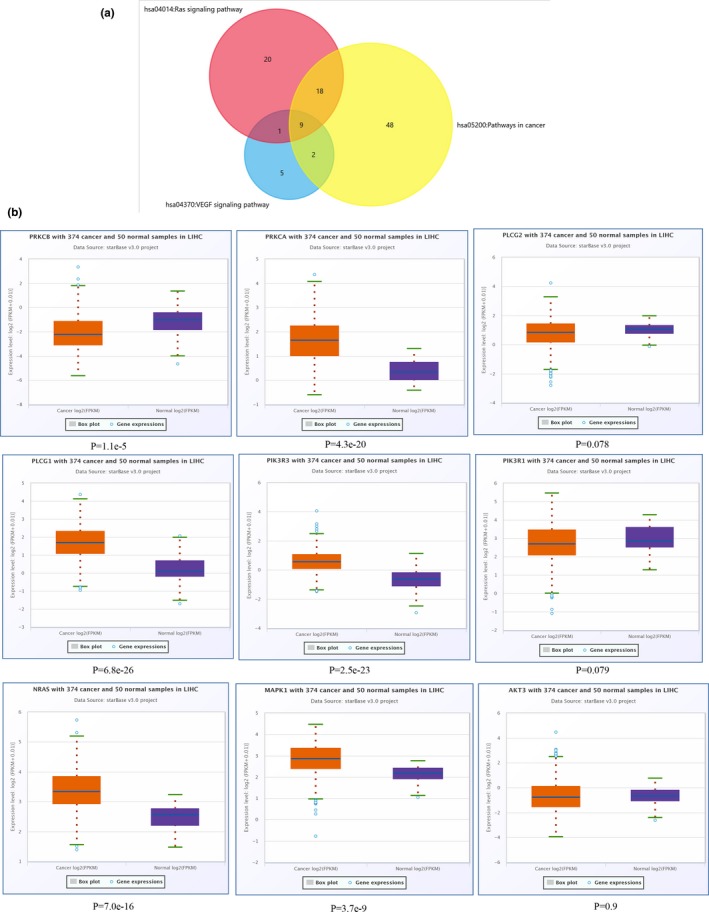
Identification of genes related to HCC progression for downregulated DEMs. (a) Venn diagram indicated intersection of three pathways associated with onset of HCC for the target genes of downregulated DEMs. (b) Validation of the overlapping gene of these three pathways using StarBase. DEMs: differentially expressed microRNAs; HCC, hepatocellular carcinoma
Figure 8.
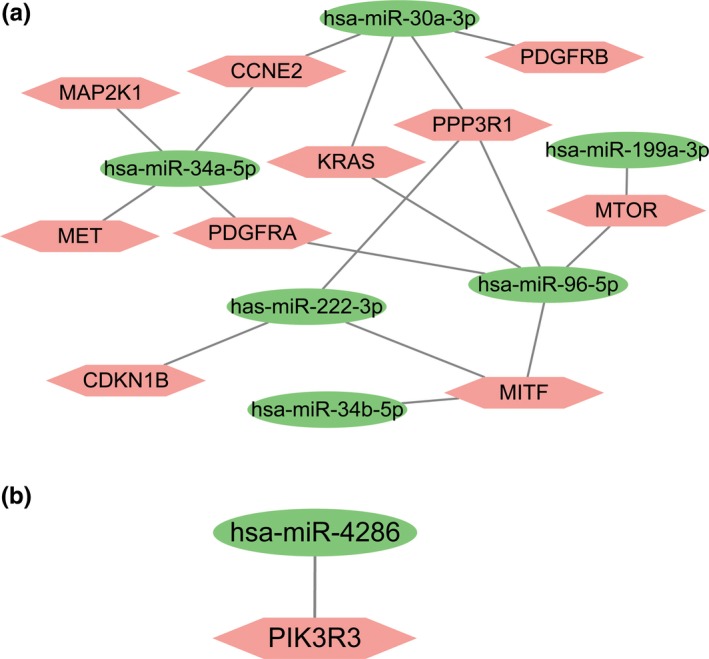
miRNA‐mRNA regulatory network regarding AFB1‐induced onset of HCC. (a) Upregulated DEMs and (b) downregulated DEMs. AFB1, Aflatoxin B1; DEMs, differentially expressed microRNAs; HCC, hepatocellular carcinoma; miRNA, microRNA; mRNA, message RNA
4. DISCUSSION
Aflatoxin B1 is a highly toxic reagent produced by Aspergillus flavus and the exposure to AFB1 is reported to account for the initiation of approximately 4%–28% of all HCC cases (Liu & Wu, 2010). Therefore, detection of early fingerprints after AFB1 exposure may help us to prevent the cell development into HCC (Fedeles, Chawanthayatham, Croy, Wogan, & Essigmann, 2017). It was well‐recognized that miRNAs can regulate almose all cellular processes. Therefore, we hypothesized that miRNAs expression may also be altered in AFB1 treated cells. Importantly, studies comprehensively investigating the connection between miRNAs and AFB1 treatment are still lacking.
In this study, a miRNA expression profile dataset that contains data from primary human hepatocytes treated with AFB1 for 5 days and then subjected to 3 days wash‐out period was used to investigate the changed miRNAs after AFB1 withdraw. A total of 18 DEMs including nine upregulated DEMs and nine downregulated DEMs were identified. After targets prediction for these identified DEMs, we analyzed the biological functions using GO annotation and KEGG pathway enrichment methods. We found that the pathways of these genes involved were significantly associated with human cancer progression, which indicated that AFB1 exposure will indeed activate the development of cancers. On the basis of these analyses results, we constructed the miRNA‐mRNA regulatory network to help us understand the mechanisms related to HCC onset after AFB1 exposure. hsa‐miR‐96‐5p in the upregulated DEMs associated miRNA‐mRNA network has the largest target numbers. hsa‐miR‐34a was previously reported to correlate with liver tumorigenesis after AFB1 exposure (Zhu et al., 2015). Furthermore, hsa‐miR‐96‐5p, hsa‐MIR‐30a‐5p (612326), hsa‐MIR‐199a‐3p (610719), and hsa‐MIR‐222‐3p (300569) were previously reported to be associated with HCC progression (Callegari et al., 2018; de Conti et al., 2017; Iwai et al., 2018; Zhang, Liu, Zhang, & Liu, 2017). However, the role of hsa‐MIR‐34b‐5p (611374) in HCC has not been reported to date and therefore our study implied that hsa‐MIR‐34b‐5p may be related to HCC onset. For the regulatory network constructed by downregulated DEMs, we have noted that the role of hsa‐MIR‐4286 was not reported to be associated with HCC previously. Therefore, it deserves to be investigated in the future.
This work established miRNA‐mRNA regulatory networks related to the HCC onset by comprehensive bioinformatic analyses. The limitation in this work was that the predicted miRNA‐mRNA link was not experimentally validated, which need further investigations. Hence, future investigations on in vitro cell lines or in vivo animal models are required to validate the prediction results.
In summary, our in‐silico analyses results indicated miRNA‐mRNA connections contributing to the HCC onset after AFB1 exposure. We hope that our results can accelerate the process of tackling the AFB1‐induced onset of HCC.
CONFLICT OF INTEREST
The authors declare that they have no conflict of interest.
Zhang Z, Tang D, Wang B, Wang Z, Liu M. Analysis of miRNA‐mRNA regulatory network revealed key genes induced by aflatoxin B1 exposure in primary human hepatocytes. Mol Genet Genomic Med. 2019;7:e971 10.1002/mgg3.971
Ziyang Zhang and Dongyang Tang have contributed equally to this work.
REFERENCES
- Agarwal, V. , Bell, G. W. , Nam, J. W. , & Bartel, D. P. (2015). Predicting effective microRNA target sites in mammalian mRNAs. eLife, 4, e05005 10.7554/eLife.05005 [DOI] [PMC free article] [PubMed] [Google Scholar]
- Bartel, D. P. (2009). MicroRNAs: Target recognition and regulatory functions. Cell, 136(2), 215–233. 10.1016/j.cell.2009.01.002 [DOI] [PMC free article] [PubMed] [Google Scholar]
- Betel, D. , Wilson, M. , Gabow, A. , Marks, D. S. , & Sander, C. (2008). The microRNA.org resource: Targets and expression. Nucleic Acids Research, 36, D149–D153. [DOI] [PMC free article] [PubMed] [Google Scholar]
- Bray, F. , Ferlay, J. , Soerjomataram, I. , Siegel, R. L. , Torre, L. A. , & Jemal, A. (2018). Global cancer statistics 2018: GLOBOCAN estimates of incidence and mortality worldwide for 36 cancers in 185 countries. CA: A Cancer Journal for Clinicians, 68(6), 394–424. 10.3322/caac.21492 [DOI] [PubMed] [Google Scholar]
- Callegari, E. , D'Abundo, L. , Guerriero, P. , Simioni, C. , Elamin, B. K. , Russo, M. , … Negrini, M. (2018) miR‐199a‐3p modulates MTOR and PAK4 pathways and inhibits tumor growth in a hepatocellular carcinoma transgenic mouse model. Molecular Therapy—Nucleic Acids, 11, 485–493. 10.1016/j.omtn.2018.04.002 [DOI] [PMC free article] [PubMed] [Google Scholar]
- Chen, W. , Zheng, R. , Baade, P. D. , Zhang, S. , Zeng, H. , Bray, F. ,… He, J. (2016) Cancer statistics in China, 2015. CA: A Cancer Journal for Clinicians, 66(2), 115–132. 10.3322/caac.21338 [DOI] [PubMed] [Google Scholar]
- Chou, C.‐H. , Shrestha, S. , Yang, C.‐D. , Chang, N.‐W. , Lin, Y.‐L. , Liao, K.‐W. , … Huang, H.‐D. (2018). miRTarBase update 2018: A resource for experimentally validated microRNA‐target interactions. Nucleic Acids Research, 46(D1), D296–D302. 10.1093/nar/gkx1067 [DOI] [PMC free article] [PubMed] [Google Scholar]
- de Conti, A. , Ortega, J. F. , Tryndyak, V. , Dreval, K. , Moreno, F. S. , Rusyn, I. , … Pogribny, I. P. (2017). MicroRNA deregulation in nonalcoholic steatohepatitis‐associated liver carcinogenesis. Oncotarget, 8(51), 88517–88528. 10.18632/oncotarget.19774 [DOI] [PMC free article] [PubMed] [Google Scholar]
- Fedeles, B. I. , Chawanthayatham, S. , Croy, R. G. , Wogan, G. N. , & Essigmann, J. M. (2017). Early detection of the aflatoxin B1 mutational fingerprint: A diagnostic tool for liver cancer. Mol Cell Oncol, 4(4), e1329693 10.1080/23723556.2017.1329693 [DOI] [PMC free article] [PubMed] [Google Scholar]
- Ferreira, R. G. , Cardoso, M. V. , de Souza Furtado, K. M. , Espíndola, K. M. M. , Amorim, R. P. , & Monteiro, M. C. (2019). Epigenetic alterations caused by aflatoxin b1: A public health risk in the induction of hepatocellular carcinoma. Translational Research, 204, 51–71. 10.1016/j.trsl.2018.09.001 [DOI] [PubMed] [Google Scholar]
- Gandellini, P. , Doldi, V. , & Zaffaroni, N. (2017). MicroRNAs as players and signals in the metastatic cascade: Implications for the development of novel anti‐metastatic therapies. Seminars in Cancer Biology, 44, 132–140. 10.1016/j.semcancer.2017.03.005 [DOI] [PubMed] [Google Scholar]
- Groopman, J. D. , Kensler, T. W. , & Wild, C. P. (2008). Protective interventions to prevent aflatoxin‐induced carcinogenesis in developing countries. Annual Review of Public Health, 29, 187–203. 10.1146/annurev.publhealth.29.020907.090859 [DOI] [PubMed] [Google Scholar]
- Iwai, N. , Yasui, K. , Tomie, A. , Gen, Y. , Terasaki, K. , Kitaichi, T. , … Itoh, Y. (2018). Oncogenic miR‐96‐5p inhibits apoptosis by targeting the caspase‐9 gene in hepatocellular carcinoma. International Journal of Oncology, 53(1), 237–245. 10.3892/ijo.2018.4369 [DOI] [PubMed] [Google Scholar]
- Jafri, M. A. , Al‐Qahtani, M. H. , & Shay, J. W. (2017). Role of miRNAs in human cancer metastasis: Implications for therapeutic intervention. Seminars in Cancer Biology, 44, 117–131. 10.1016/j.semcancer.2017.02.004 [DOI] [PubMed] [Google Scholar]
- Jiao, X. , Sherman, B. T. , Huang, D. W. , Stephens, R. , Baseler, M. W. , Lane, H. C. , & Lempicki, R. A. (2012). DAVID‐WS: A stateful web service to facilitate gene/protein list analysis. Bioinformatics, 28(13), 1805–1806. 10.1093/bioinformatics/bts251 [DOI] [PMC free article] [PubMed] [Google Scholar]
- Kertesz, M. , Iovino, N. , Unnerstall, U. , Gaul, U. , & Segal, E. (2007). The role of site accessibility in microRNA target recognition. Nature Genetics, 39(10), 1278–1284. 10.1038/ng2135 [DOI] [PubMed] [Google Scholar]
- Li, J. H. , Liu, S. , Zhou, H. , Qu, L. H. , & Yang, J. H. (2014). starBase v2.0: Decoding miRNA‐ceRNA, miRNA‐ncRNA and protein‐RNA interaction networks from large‐scale CLIP‐Seq data. Nucleic Acids Research, 42, D92–D97. 10.1093/nar/gkt1248 [DOI] [PMC free article] [PubMed] [Google Scholar]
- Liu, W. J. , & Wang, X. W. (2019). Prediction of functional microRNA targets by integrative modeling of microRNA binding and target expression data. Genome Biology, 20(1), 18 10.1186/s13059-019-1629-z [DOI] [PMC free article] [PubMed] [Google Scholar]
- Liu, Y. , & Wu, F. (2010). Global burden of aflatoxin‐induced hepatocellular carcinoma: A risk assessment. Environmental Health Perspectives, 118(6), 818–824. 10.1289/ehp.0901388 [DOI] [PMC free article] [PubMed] [Google Scholar]
- Llovet, J. M. , Zucman‐Rossi, J. , Pikarsky, E. , Sangro, B. , Schwartz, M. , Sherman, M. , & Gores, G. (2016). Hepatocellular carcinoma. Nature Reviews Disease Primers, 2, 16018 10.1038/nrdp.2016.18 [DOI] [PubMed] [Google Scholar]
- Rieswijk, L. , Claessen, S. M. H. , Bekers, O. , van Herwijnen, M. , Theunissen, D. H. J. , Jennen, D. G. J. , … van Breda, S. G. J. (2016). Aflatoxin B1 induces persistent epigenomic effects in primary human hepatocytes associated with hepatocellular carcinoma. Toxicology, 350–352, 31–39. 10.1016/j.tox.2016.05.002 [DOI] [PubMed] [Google Scholar]
- Shannon, P. , Markiel, A. , Ozier, O. , Baliga, N. S. , Wang, J. T. , Ramage, D. , … Ideker, T. (2003). Cytoscape: A software environment for integrated models of biomolecular interaction networks. Genome Research, 13(11), 2498–2504. 10.1101/gr.1239303 [DOI] [PMC free article] [PubMed] [Google Scholar]
- Shen, H. M. , & Ong, C. N. (1996). Mutations of the p53 tumor suppressor gene and ras oncogenes in aflatoxin hepatocarcinogenesis. Mutation Research, 366(1), 23–44. 10.1016/S0165-1110(96)90005-6 [DOI] [PubMed] [Google Scholar]
- Wang, S. , He, Z. , Li, D. , Zhang, B. O. , Li, M. , Li, W. , … Chen, L. (2017). Aberrant methylation of RUNX3 is present in Aflatoxin B1‐induced transformation of the L02R cell line. Toxicology, 385, 1–9. 10.1016/j.tox.2017.04.011 [DOI] [PubMed] [Google Scholar]
- Wu, X.‐M. , Xi, Z.‐F. , Liao, P. , Huang, H.‐D. , Huang, X.‐Y. , Wang, C. , … Long, X.‐D. (2017). Diagnostic and prognostic potential of serum microRNA‐4651 for patients with hepatocellular carcinoma related to aflatoxin B1. Oncotarget, 8(46), 81235–81249. 10.18632/oncotarget.16027 [DOI] [PMC free article] [PubMed] [Google Scholar]
- Zhang, S. , Liu, Q. , Zhang, Q. , & Liu, L. (2017). MicroRNA‐30a‐5p suppresses proliferation, invasion and tumor growth of hepatocellular cancer cells via targeting FOXA1. Oncology Letters, 14(4), 5018–5026. 10.3892/ol.2017.6745 [DOI] [PMC free article] [PubMed] [Google Scholar] [Retracted]
- Zhu, L. , Gao, J. , Huang, K. , Luo, Y. , Zhang, B. , & Xu, W. (2015). miR‐34a screened by miRNA profiling negatively regulates Wnt/β‐catenin signaling pathway in Aflatoxin B1 induced hepatotoxicity. Scientific Reports, 5, 16732 10.1038/srep16732 [DOI] [PMC free article] [PubMed] [Google Scholar]


