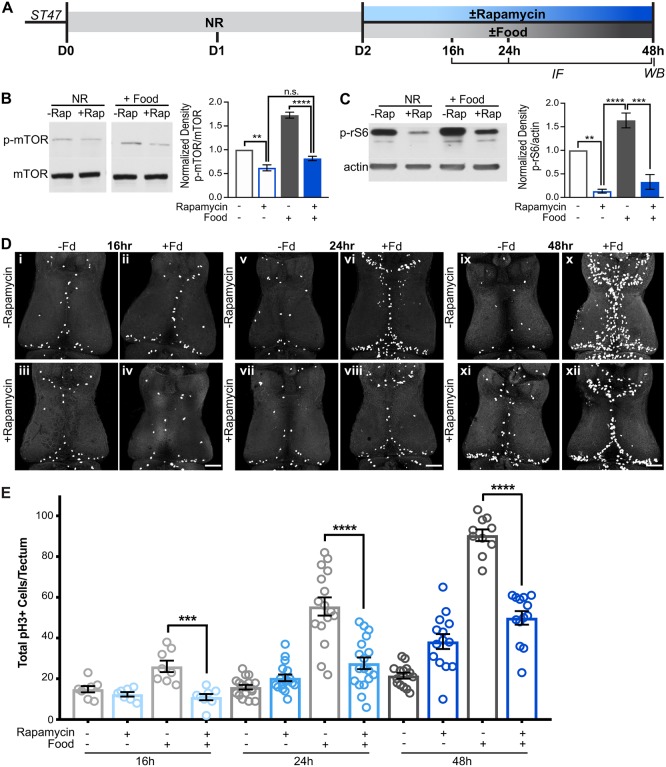
Fig. 3.
Nutrient-induced proliferation requires mTOR signaling. (A) Experimental timeline. Animals were nutrient restricted for 2 days after Stage 47 and then food was re-introduced concomitant with the mTOR-blocking drug rapamycin or DMSO vehicle for up to an additional 2 days. Brains were processed for pH3 immunolabeling 16 h, 24 h and 48 h after feeding, or for western blots 48 h after feeding as indicated. (B) Western blot analysis shows that feeding increased phospho-mTOR (p-mTOR) and that increase in p-mTOR was blocked by rapamycin. (C) Western blot analysis shows that feeding increased phospho-ribosomal protein S6 (p-rS6) and that increase was blocked by rapamycin. (D) Whole-mount confocal images of pH3 immunolabeling in the optic tectum 16 h, 24 h and 48 h after feeding, with or without rapamycin treatment. Fd, food. (E) Quantification of total pH3+ cells per tectum 16 h, 24 h and 48 h after feeding, with or without rapamycin showing that rapamycin blocks the feeding-induced increase in proliferation at all time points tests. Data for each condition are shown as individual data points and mean±s.e.m. are shown as black bars. Blue symbols signify rapamycin treatment and gray symbols are controls. For western blots, n=5 brains per treatment per time point, a minimum of 3 biological replicates was used for each quantification shown. For cell counts, n=8-18 animals per group per time point for a total of 150 animals across 12 groups from multiple independent clutches; see Table S1. **P<0.01, ***P<0.001, ****P<0.0001, n.s., not significant. Scale bars: 100 μm.

