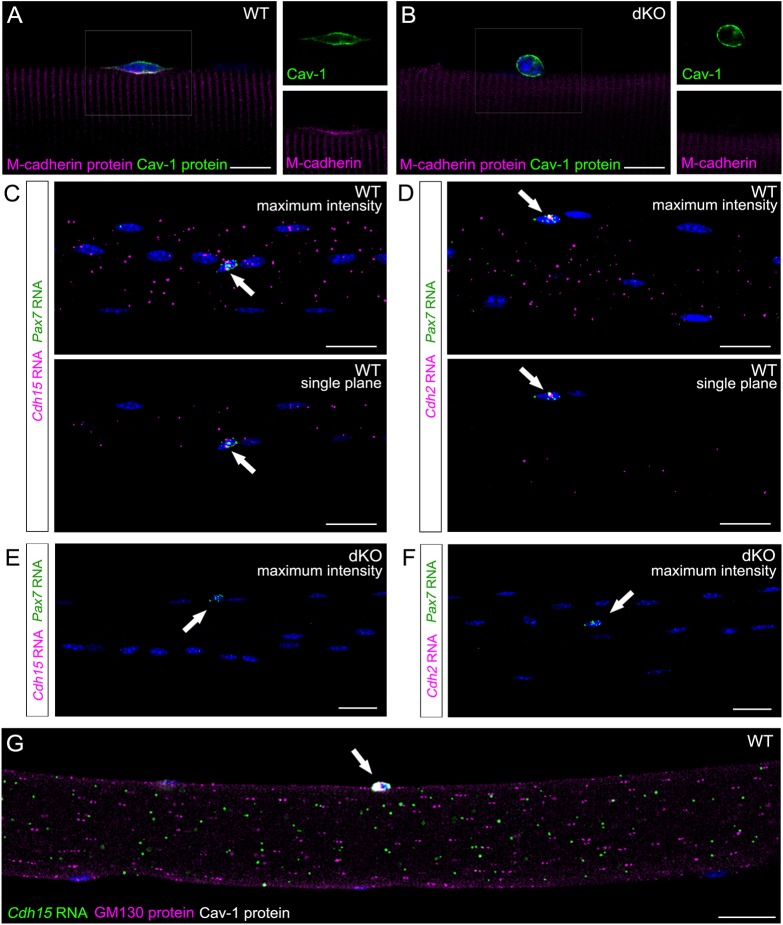
Fig. 3.
Niche cadherin transcripts are distributed evenly throughout the length and depth of myofibers. (A,B) IF of myofibers from wild-type (WT; A) or MyoDicre;Cdh2f/f;Cdh15−/− (dKO; B) mice stained for M-cadherin (magenta) and Cav1 (green). Note that M-cadherin signal at the apical membrane of the SC is specifically lost in dKO fibers. Insets (right) show magnification of boxed area. (C,D) MF-RNAscope of myofibers probed for Pax7 (green) and Cdh15 (C) or Cdh2 (D) RNAs (magenta). Top images show maximum intensity projections (40× magnification). Bottom images show single confocal planes. Arrows indicate Pax7+ SCs. (E,F) MF-RNAscope of dKO myofibers probed for Pax7 (green) and Cdh15 (E) or Cdh2 (F) RNAs (magenta). Images are maximum intensity projections. Arrows indicate Pax7+ SCs. (G) MF-RNAscope/IF of myofibers probed for Cdh15 RNA (green) and stained for GM130 (magenta) and Cav1 (white) proteins. Image is a single confocal plane in the middle of the myofiber. Arrow indicates a Cav1+ SC. Nuclei are identified with DAPI (blue). Scale bars: 10 µm in A,B; 25 µm in C-G.

