

Abstract
The regenerative activity of adult stem cells carries a risk of cancer, particularly in highly renewable tissues. Members of the family of inhibitor of apoptosis proteins (IAPs) inhibit caspases and cell death, and are often deregulated in adult cancers; however, their roles in normal adult tissue homeostasis are unclear. Here, we show that regulation of the number of enterocyte‐committed progenitor (enteroblast) cells in the adult Drosophila involves a caspase‐mediated physiological apoptosis, which adaptively eliminates excess enteroblast cells produced by intestinal stem cells (ISCs) and, when blocked, can also lead to tumorigenesis. Importantly, we found that Diap1 is expressed by enteroblast cells and that loss and gain of Diap1 led to changes in enteroblast numbers. We also found that antagonistic interplay between Notch and EGFR signalling governs enteroblast life/death decisions via the Klumpfuss/WT1 and Lozenge/RUNX transcription regulators, which also regulate enteroblast differentiation and cell fate plasticity. These data provide new insights into how caspases drive adult tissue renewal and protect against the formation of tumours.
Keywords: caspase, intestinal enteroblast, Klumpfuss/WT1, Lozenge/RUNX, physiological apoptosis
Subject Categories: Autophagy & Cell Death, Development & Differentiation, Regenerative Medicine
Introduction
The Drosophila intestinal epithelium is completely renewed several times during its 40–50 days of adult life in a process that takes 1–3 weeks under normal homeostatic self‐renewal (Ohlstein & Spradling, 2007; Jiang et al, 2009; Antonello et al, 2015). However, after overt damage, it is renewed in just 2–3 days (Ohlstein & Spradling, 2007; Buchon et al, 2009; Jiang et al, 2009). The wide range of physiological turnover time reflects the stochastic damage of absorptive enterocytes (ECs)—the main cells in the intestinal epithelium (Biteau et al, 2011; Jiang & Edgar, 2011)—by exposure to pathogens and toxins present in food and chemicals and physical stress. The intestine also contains secretory enteroendocrine (EE) cells, which constitute only 10% of the intestinal population and renew themselves at a slower rate than ECs (de Navascués et al, 2012; Sallé et al, 2017; Parasram et al, 2018). Intestinal cell turnover is sustained by a small population of ISCs scattered throughout the epithelium that, as observed in other high‐turnover epithelia in mammals (Simons & Clevers, 2011), divide regularly and produce, with each division, one cell that differentiates and one that remains undifferentiated. The renewed ISCs will divide in the same way to produce a new cell stem and a cell committed towards the same lineage as the previous division or into the other intestinal cell type (e.g. Micchelli & Perrimon, 2006; Ohlstein & Spradling, 2006, 2007; Jiang et al, 2009; Beehler‐Evans & Micchelli, 2015; Chen et al, 2018); or it may divide symmetrically to expand the number of ISCs (O'Brien et al, 2011; de Navascués et al, 2012). However, in the highly renewing intestine, stem cells must operate rapidly and efficiently by providing enough new cells to replenish daily tissue demand. Moreover, since multipotent ISCs have different options in terms of cell lineage, an important unanswered question is how individual stem cells rapidly and adaptively produce the distinct tissue cell types at the right number to sustain tissue homeostasis in the short‐ and long‐term.
In Drosophila, the intestine contains only two types of differentiated cells, the ECs and the enteroendocrine cells (ee). The commitment of enteroblasts (EBs) to produce ECs is relatively simple and requires the Delta (Dl)‐Notch (N) signalling activation between the daughter cell that remains a stem cell and the daughter cell that becomes the committed progenitor cell (Ohlstein & Spradling, 2007; Perdigoto et al, 2011). Transient activation of the achaete‐scute transcription factor in the ISCs results in the production of EE progenitor cells that can divide further to renew the stem cell and produce pairs of EE cells (Chen et al, 2018). The EE population is complex and the different cell subtypes are not fully characterized but two classes (class I and II) of EE cells have been described based on the combination of neuropeptide hormones the EE cell expressed (Beehler‐Evans & Micchelli, 2015). Both class I and II of EE cells can be derived from a common stem cell lineage, and the class II cell lineage specification depends on the Notch‐Suppressor of Hairless [Su(H)] signalling (Beehler‐Evans & Micchelli, 2015). The mechanism that ensures the commitment EBs with activated N and Su(H) signalling towards the EC lineage is not fully understood, and specific tools to label and manipulate the EC‐committed EBs have not been characterized thus far.
The homeostatic renewal of the Drosophila adult intestine shares many features of more complex animals, and yet, the reduced cell types and the lack of transient amplifying cells allow for a simplified analysis of ISC‐production dynamics during homeostasis (Jiang & Edgar, 2012). A typical Drosophila ISC divides slowly but continually and produces EBs that can remain incompletely differentiated for long periods in the absence of a local demand for cell renewal (Antonello et al, 2015). The existence of such a pool of EBs in homeostatic intestines was first suggested in studies of infection challenge (Buchon et al, 2009) but only formally established by multicolour tracing methods (Antonello et al, 2015). After infection or genetic induction of EC death (Buchon et al, 2009; Jiang et al, 2009), the ISC proliferation rate increases to cope with the increased demand for new cells. The mitotic index can increase from 3 to 5 mitoses per midgut to more than 100 mitoses per gut; however, the ISC proliferation rate peaks only 24–48 h postchallenge (Buchon et al, 2009; Jiang et al, 2009). During the time interval between challenge and the increase in ISC proliferation, it has been shown that the “pre‐existing” EB pool serves as the intestine's first defence (Buchon et al, 2009; Antonello et al, 2015). A fundamental question is how the stem cell population performs in times of low intestinal demand or how it returns to homeostasis following regeneration of a massive injury since maintaining an “unnecessary” population of immature EBs may increase work load and metabolic demand and thus lead to poorer organ performance or risk of tissue hyperplasia (Zhai et al, 2015).
Developing organs often employ a strategy of overproduction followed by culling of the excess cells via programmed cell death (PCD) to ensure correct organ size and shape (Fuchs & Steller, 2011). Although it is counterintuitive that adult stem cells overproduce (i.e. divide superfluously), the importance of apoptosis in maintaining the dynamic numbers and several cell fate specification decisions in the mammalian haematopoietic system has long been defined (reviewed in Oguro & Iwama, 2007), although how haematopoietic stem cells make life and death decisions and the molecular mechanisms involved are incompletely understood. Here, we discovered that ISCs divide in excess of physiological demand and cull excess enteroblast cells via a PCD similar to that which operates during morphogenesis. Execution of cell death involves a conserved axis including Dl‐N signalling, the pro‐apoptotic transcription factor Klumpfuss/WT and the RUNX homologue Lozenge. This is counteracted by environmental survival signals acting via epidermal growth factor receptor (EGFR) in enteroblast cells, impinging in part on the regulation of the caspase inhibitor Diap1. The gain of genes involved in PCD and the loss of genes involved in survival resulted in a reduction in EB numbers and abrogation of intestinal renewal, whereas blocking caspase genes via a Gal4 line inserted in the klu gene, which we show drive expression specifically in the EC‐committed enteroblasts, revealed that more than half of the EC‐committed progenitor cells produced by the ISCs might be eliminated by PCD in the physiological intestine in conditions of low demand. Furthermore, selective elimination of apoptosis in progenitor cells is sufficient for tumorigenesis to occur. These data provide new insights into the mechanisms of adult tissue homeostasis, opening up new avenues for future investigation of apoptosis and intestinal cancer.
Results
Intestinal stem cells do not adjust their division to slowing intestinal cell replacement
To test whether ISC division adapts to situations of low demand, we developed a “Low” demand protocol to minimize the need for intestinal cell replacement (Fig 1A). The key feature of this protocol is that it minimizes the chances of pathogens accumulating in food, which is the leading cause of EC damage (Apidianakis & Rahme, 2010), by frequently transferring flies to fresh food vials (i.e. 3‐ to 4‐day‐old flies were transferred to fresh food vials every 48 h; Fig 1A). To correctly map the fate of progenitor cells, we used the ReDDM (“Repressible Dual Differential Marker”: Antonello et al, 2015) tracing method, which allows for the unambiguous tracing of stem and progenitor cells and the differentiated progeny. Whereas new ECs are detected as RFP‐only cells by the ReDDM‐tracing method (Fig 1B), ISCs and/or EBs are detected as double GFP–RFP‐labelled cells when using the esg‐Gal4.
Figure 1. Inhibition of apoptosis in ISCs and enteroblasts and intestinal expression of Diap1.

-
AScheme for tracing intestinal progenitor cell number regulation in midgut with low intestinal renewal (“Low”) using the lineage‐tracing ReDDM system. The strategy relies on minimizing exposure of flies to contaminated food by transferring flies to fresh food vials every 2 days (“Low”) as compared with normal culturing conditions in which flies are typically transferred to fresh food vial every week. This “Low” demand strategy effectively minimized intestinal renewal.
-
BScheme of the ReDDM‐tracing method (Antonello et al, 2015). This system uses two fluorescent transgenes with short‐term (membrane CD8::GFP, green) and long‐term (nuclear RFP::H2B, red) stability and the Gal80 repressor (tubα1‐Gal80 ts) for temporal control of UAS‐driven transgenes. Using esg‐Gal4, the reporter transgenes are seen in the ISCs and EBs (detected as double‐labelled cells). Newly renewed ECs or EEs are traced by the nuclear RFP owing to the protein stability of RFP::H2B.
-
CQuantification of renewed ECs (RFP‐only labelled cells), left graph, and number of ISC and EB cells (double RFP+ GFP+ cells), right graph, in posterior midguts after 7, 14 or 21 days of tracing in normal (“Variable”: gut scored n = 9, 8, 4) and low demand (“Low”: n = 6, 4, 7) culturing conditions. Asterisks denote significances from one‐way ANOVA with Bonferroni's multiple comparison test (**P = 0.0016; ****P < 0.0001).
-
DQuantification of mitosis (phospho‐histone H3 (PH3)+ cells) in low demand midguts at the indicated time points. **P = 0.0015; n.s. not significant from one‐way ANOVA test.
-
ERepresentative adult midgut from control esg ReDDM at day 14 after temperature shift in variable demand. ECs renewed are marked positively by persistent RFP labelling (red‐only cells).
-
F, GFew ECs had been renewed in “Low” midguts after 14 (F) and 21 (G) days of tracing.
-
H–JAge‐synchronized posterior midguts of control (esg ReDDM >, H) and p35 overexpression in stem and progenitor cells (esg ReDDM >p35, p35 I and J) at 7 days after temperature shift. Arrows in (H, I) point to newly differentiated ECs. In (J), tumour mass is found in the anterior midgut.
-
KQuantification of mitosis PH3+ cells in posterior midgut (pmg) (control: gut scored n = 13 and esg>p35, p35: n = 22]). Student's t‐test (****P < 0.0001).
-
LDiap1 is monitored by the GFP.4.3 (green) reporter (Zhang et al, 2008; Djiane et al, 2013). Diap1‐GFP is detected in a subset of adult midgut esg + cells that are negative for the mitotic marker PH3 (red, inset) and for EE marker Prospero (Pros, grey in inset). Diap1‐GFP is not detected in mature EC (large nuclei cells, DAPI in blue).
-
M–ODiap1‐GFP (green) co‐localized almost 100% with the EB marker GBE‐Su(H)‐lacZ (red, M and O). Arrow points to a rare Diap1‐GFP‐negative GBE‐Su(H)‐lacZ‐positive cell.
After a temperature shift to inactivate Gal80 (tub‐Gal80 ts), control flies were transferred to fresh vials every week as previously reported (Jiang et al, 2009; Antonello et al, 2015). As expected from unpredictable fluctuating demands, there was increased renewal of ECs and substantial variation among individual midguts (Fig 1C, empty red bars). This widely used standard culturing condition will be referred to as “Variable” demand. In contrast to these culturing conditions (i.e. new food vial every week) where the intestinal epithelium had renewed completely after 3 weeks (Fig 1C and as previously reported in Antonello et al, 2015; Jiang et al, 2009), few ECs had renewed at 7, 14 and even 21 days after tracer induction in “Low” demand conditions (esg ReDDM‐midgut; Fig 1C, solid histogram). Despite the slow epithelial cell turnover in “Low” demand conditions, ISCs continued dividing at a similar rate, producing a similar number of EBs compared to midguts reared in standard culturing conditions (Fig 1C, green histogram). PH3+ counts showed that ISCs in “Low” demand maintained a constant proliferation rate (2–5 mitoses/midgut) at days 7, 14 and 21 and compared to the guts of flies in “Variable” demand (Fig 1D). Representative images of guts reared in the standard condition (referred to as “Variable”) and a “Low” gut after 2 weeks of tracing are shown in Fig 1E–G. After 3 weeks of tracing, “Low” midguts still had fewer renewed ECs (RFP‐only cells) than the “Variable” gut at day 14 (compared Fig 1G and E). No accumulation of EBs was observed in “Low” midguts after 3 weeks of continued ISC division (Fig 1G). This could not be attributed to terminal differentiation because the ReDDM‐tracing method detected very few RFP‐labelled ECs (Fig 1G and quantification in Fig 1C). This observation prompted us to subsequently investigate whether stem cell production might be regulated by a PCD, in addition to proliferation control.
Blocking apoptosis selectively in ISCs and enteroblasts led to accumulation of undifferentiated progenitor cells and tumour masses
We first drove the expression of the baculovirus caspase inhibitor p35 in ISCs and EBs of age‐synchronized cohorts of adult flies using the esg ReDDM lineage‐tracing ReDDM system, and compared with the control, found a significant accumulation of esg‐positive (esg+ve) cells after 7 days (esg ReDDM >p35; Fig 1I and H) and the occasional presence of tumour‐like masses (Fig 1J). This increase could not be attributed to increased ISC mitosis caused by p35 overexpression (Fig 1K). This revealed that ISCs divide in excess to demand uncovering a hitherto unsuspected role of caspases in the control of stem and/or progenitor cell number. We used the caspase sensor Apoliner, which allows the detection of an even rarer number of apoptotic cells because it marks early steps of apoptosis in which the cell still appears morphologically normal (Bardet et al, 2008). To distinguish PCD in progenitor cells from apoptosis‐induced aged or damaged ECs and EE cells, we drove Apoliner specifically in ISC and EBs using esg‐Gal4, and in this way, we identified caspase activity to cells with EB morphology (Appendix Fig S1A and B, Antonello et al, 2015). This is also consistent with a recent report using an initiator caspase sensor (Baena et al, 2018) and unlike earlier caspase‐based sensors that detected exclusively activated caspases in enterocytes (Tang et al, 2015; Ding et al, 2016). These observations hinted at a role for caspases in regulating ISC and/or EB cell numbers. This notion is further reinforced by our functional studies, lineage tracing analysis of a Dronc sensor and analysis of apoptotic progenitor cells using cleaved caspase‐3 staining and TUNEL (Terminal Deoxynucleotidyl Transferase (TdT)‐mediated dUTP Nick‐End Labelling; see Appendix Fig S1C and D and below).
Endogenous Diap1 expression and requirement in enteroblasts
The Diap1 protein (Vasudevan & Don Ryoo, 2015) is crucial for inhibition of caspases (Meier et al, 2000). We observed that the Diap1‐GFP4.3 enhancer construct that contains intronic regulatory elements of the diap1/thread gene (Zhang et al, 2008; Djiane et al, 2013) is selectively transcribed in EB cells (Fig 1L–O) as seen by co‐staining with the commonly used EB‐specific marker Gbe‐Su(H)‐lacZ and ISC markers (Furriols & Bray, 2000; Micchelli & Perrimon, 2006; Zacharioudaki & Bray, 2014). Diap1‐GFP4.3 + cells were negative for the mitotic marker PH3 and the EE marker Prospero (insets in Fig 1L) and were co‐stained with GBE‐Su(H)‐lacZ (Fig 1M; single channel images in Fig 1N and O). We also examined expression of Diap1 using a lacZ enhancer trap in the Diap1/thread gene (Ryoo et al, 2002) (Appendix Fig S1E–H and J–L). Diap1‐lacZ signal (Appendix Fig S1E and F) was weakly detected in ISCs, as labelled with anti‐Dl (green, Appendix Fig S1G and quantification in M). In contrast, Diap1‐lacZ signal was strong in EBs as labelled with NRE‐mCherry (Housden et al, 2012) (Appendix Fig S1F and H: quantification in Appendix Fig S1M), indicating that the enhancer elements in the Diap1‐GFP4.3 construct contain bona fide regulatory elements for EB expression in the adult intestine. Indeed, Diap1 protein could be detected in the intestine overlapping with the EB marker NRE‐GFP (Appendix Fig S1I), and Diap1‐GFP were all co‐stained with Diap1‐lacZ (Appendix Fig S1J and K). Diap1‐lacZ was also detected at varying levels in some terminally differentiated ECs (Appendix Fig S1K and L) but one cannot rule out that this reflects the perdurance of the stable βgalactosidase protein as seen before with other progenitor‐specific lacZ reporters (Jiang et al, 2009). Thus, Diap1‐GFP reporter represents a new tool for labelling EBs.
The pro‐apoptotic proteins Reaper (Rpr), Head involution defective (Hid) and Grim regulate most apoptotic deaths by counteracting the caspase inhibitor Diap1 (Hirata et al, 1995; Meier et al, 2000; Holley et al, 2002) (scheme, Fig 2A). A Drice‐based caspase sensor reporter construct has recently shown that the initiator caspase Dronc is widely activated in the adult intestine (Baena et al, 2018). Using the initiator caspase Dronc sensor that is fused to the transcriptional activator QF (act‐DBS‐S‐QF) in combination with QUAS‐Flipase (FLP) and the act>FRT‐stop>FRT>lacZ cassette, the cells that activated Dronc and their descendants can be traced over time (Baena et al, 2018). Lineage tracing of the intestinal cells that had activated the Dronc are visualized by the presence of βGal labelling (Fig 2B). We found that “Variable” reared guts showed βGal in mature EC cells (large nuclei, DAPI), progenitor cells (small nuclei, Dl‐negative cells) and rarely or very low in ISCs (Dl‐positive cells; inset in Fig 2B). The lineage tracing activated Dronc cells is consistent with the hypothesis that caspase‐mediated apoptosis of EB cells being an integral part of the adult intestinal homeostasis. The fact that many mature EC cells derived from cells that activated Dronc caspase also suggests that EB life/death decisions may depend on the balance between pro‐ and anti‐apoptotic inputs. This is supported by the observations that EB cells also express Diap1 expression. Thus, we next examined the effect of overexpressing the baculovirus caspase inhibitor p35 using the commonly used EB‐specific driver GBE‐Su(H)‐Gal4 (Furriols & Bray, 2000) (Fig 2C), which drive expression in N‐specified EB cells. We observed accumulation of clusters of GBE‐Su(H)>GFP + cells (Fig 2D), but the phenotype was more variable than that using esg‐Gal4. Some GBE‐Su(H)>p35, p35 cells show a large size, suggesting also a defect, or a delay, in terminal differentiation (Fig 2D).
Figure 2. Physiological caspase‐dependent apoptosis of enteroblast cells in the adult midgut.

-
ASchematic representation of the apoptotic pathway in Drosophila.
-
BLineage tracing using the initiator caspase sensor act‐DBS‐S‐QF (14 days of tracing) combined with QUAS‐FLP and act>FRT>lacZ is visualized by βgalactosidase (βGal, green). ISCs are labelled by anti‐Dl (red, insets). Red arrowhead points to the ISC. Gut is counterstained with DAPI (blue) and DAPI (grey, in the inset).
-
C, DControl GBE‐Su(H) ReDDM> and (D) GBE‐Su(H) ReDDM >p35, p35 midguts after 7 days of tracing.
-
E–E″Adult midgut klu>mCD8::GFP, GBE‐Su(H)‐lacZ stained for β‐Gal (red) and GFP (green). DAPI counterstaining in blue (E’ and E’’). The arrows point to examples of klu‐negative Su(H)‐lacZ‐positive cells. The green label (asterisk, E) is in the overlying muscle.
-
F–JAdult midguts of (F) control klu ReDDM> (G) klu ReDDM>Debcl‐RNAi, (H) klu ReDDM>Drice‐RNAi, (I) klu ReDDM>Diap1‐RNAi, (J) klu ReDDM>Diap1 midguts after 7 days of tracing. The arrows point to examples of PH3+ labelled ISCs.
-
KQuantification of klu + cells in the indicated midguts at day 7 in low demand (Low) or standard (Variable) culturing conditions (n = 7, 5, 9, 7).
-
LIntestinal cell turnover measured by quantification of the number of newly renewed ECs (RFP‐only cells: gut scored n = 9, 13, 9, 13).
-
MQuantification of apoptotic progenitor cells (esg +) measured as GFP+ TUNEL+ cells (n = 9, 9, 9, 9).
-
NQuantification of klu + cells and renewed ECs in klu ReDDM>Diap1 posterior midguts (n = 8) relative to “Low” control in (K and L), respectively.
Because the GBE‐Su(H)‐Gal4 (Furriols & Bray, 2000) also drives expression in class II enteroendocrine progenitors (Beehler‐Evans & Micchelli, 2015). Su(H)‐derived EE progenitor cells can divide and can regenerate the stem cells (Chen et al, 2018). Therefore, to understand the homeostatic control of enterocyte (EC)‐committed EB cell number by apoptosis, we searched for Gal4 lines that would be specific for those EBs. We found that a Gal4 enhancer trap in the klu gene, encoding the Drosophila Wilms’ Tumour 1 homologue (Klein & Campos‐Ortega, 1997), was selectively expressed in this EB population (Fig 2E). This notion is derived from two observations. First, by co‐staining midgut carrying UAS‐GFP and klu‐Gal4 (klu>GFP) and the GBE‐Su(H)‐lacZ (Fig 1E) we found that most (81.65% ± 4.66: Mean ± SEM), in n = 4 guts) EBs (e.g. cells positive for GBE‐Su(H) marker) were also positive for klu>GFP +. Around ~15% (14.22% ± 2.504) of Su(H)‐positive cells were klu‐negative (Fig 1E′–E″). These EB cells had small nuclei and a round shape, suggesting they represent EE‐committed EBs (Beehler‐Evans & Micchelli, 2015). Alternatively, these klu‐negative and GBE‐Su(H)‐positive cells could represent newborn EBs. In such case, the lack of klu + signal could be due to a delay in activation of the binary expression system (klu‐Gal4 UAS‐mCD8::GFP) as compared to the direct expression of GBE‐Su(H)‐lacZ or due to delayed activation of klu gene in N‐induced EBs. We detected a few instances of klu + (klu>GFP +)‐positive cells that were negative for GBE‐Su(H)‐lacZ marker (~4.1% ± 2.504), which could be false‐negative lacZ cells or EB cells that are no longer connected with the ISC and therefore do not maintain Su(H) activity. Second, by performing lineage tracing of the klu‐Gal4 (klu +) cells using ReDDM system, we found that after two (Appendix Fig S1N) and 3 weeks (Appendix Fig S1O) of the temperature shift 100% of klu +‐derived cells were of the EC fate and none or very rarely (< 0.2% in 35 midguts) were mature EE cells (summary in Appendix Fig S1P). This indicates that klu‐Gal4 labels EC‐committed EBs and that klu‐negative Su(H)‐positive EBs are probably EE‐committed EBs. This notion has been independently validated by Korzelius et al (2019).
We thus used the klu‐Gal4 combined with ReDDM system (klu ReDDM >, Fig 2F) to assay the effect of endogenous caspase genes in adult midguts by EC‐committed EB‐selective RNA interference (RNAi)‐based silencing of Debcl (Death executioner Bcl‐2, Fig 2G), Drice (Death‐related ICE‐like caspase, Fig 2H), Dark (Death‐associated APAF1‐related killer, Fig EV1B) and Dredd (Death‐related ced‐3/Nedd2‐like caspase, Fig EV1C) in “Low” demand culturing conditions. At day 7, after RNAi transgene induction and tracing, we observed accumulation of EBs and quantification of Debcl‐RNAi (Fig 2K) revealed a more than twofold increase in klu + cells, which cannot be accounted for by defects in intestinal cell renewal since new ECs (single RFP+ cells) were present in a similar or higher number than in controls (confocal images in midguts in Fig 2F–H and quantification in L).
Figure EV1. Role of caspases Dark, Dredd, Dronc and Drice in enteroblasts (related to Fig 2).

-
A–ERepresentative confocal images of posterior midguts (pmg) of control (A and D) and Dark‐RNAi (B), Dredd‐RNAi (C) and unprocessed Dronc (UAS‐Dronc.s) overexpression at day 7 after temperature shift using klu ReDDM. Mitosis is monitored by PH3 staining (grey dots). Scale bar, 100 μm. Arrowheads point to examples of activated caspase‐positive progenitor (klu +) cells.
-
FQuantification of the number of double GFP+, cleaved caspase‐3 + cells in pmg in the indicated genotypes. Control guts klu ReDDM > (n = 17), klu ReDDM >Dronc.s (n = 14) and klu ReDDM >Dark‐RNAi (n = 12).
-
GQuantitative RT–PCR assays of the efficacy of the indicated RNAi transgenes using hsp70‐Gal4 stimulation (1‐h heat shock at 37°C) (n = 10 larvae per genotype, three technical replicates). Error bars denote mean ± standard deviation (SD). P value (***P < 0,001; ****P < 0.0001)
-
HLeft histogram, number of cells per clone in control (n = 90 clones scored, in 10 guts) and Drice 17 (n = 117, in 10 guts) using MARCM system. Right histogram, mitosis (PH3+ cells) in guts carrying neutral (+) and Drice 17 MARCM clones. Representative confocal images of MARCM clones of the indicated genotype are shown above the histograms.
Silencing of Diap1 via RNAi (Fig 2I) and its overexpression (Fig 2J) using klu ReDDM or the overexpression of its target the caspase Dronc (Meier et al, 2000) (Fig EV1E and quantification in F) led to the elimination of many klu + cells (Fig 2I) or the accumulation of klu + cells (Fig 2J). Analysis of efficacy of the RNAi transgenes used as measured by qPCR is presented in Fig EV1G.
To further corroborate a role of caspases in regulating EB cell numbers, clonal size of cells mutant for Drice was analysed using MARCM method (Fig EV1H). This analysis revealed that Drice 17 mutant clones contained significantly more cells than control WT clones without exhibiting a statistically significant increase in the number of mitosis (Fig EV1H). Together, these data suggest that the homeostatic control of EB cell numbers is regulated by a caspase‐dependent process in adult guts. Given the extensive activation of caspase in the adult midgut during normal cell renewal (Fig 2B) and the fact that activated caspases can perform non‐apoptotic roles (Baena et al, 2018; citations therein), we examined the presence of apoptotic progenitor cells under conditions of RNAi transgene expression using the TUNEL assay, which detects extensive DNA degradation (late stages of apoptosis). Because the TUNEL method led to a strong decay of fluorescent reporters, we could only identify progenitors marked by GFP using esg‐Gal4 combined with GFP antibodies (see Appendix Fig S1C and D) but not using klu‐Gal4 or Su(H)‐Gal4.
While silencing of the caspases Debcl and Drice using esg‐Gal4 reduced the number of apoptotic esg‐positive (esg +) cells, silencing Diap1 or expression of Dronc was accompanied by a significant increase in the number of apoptotic esg + cells assayed by the TUNEL method (Fig 2M) and anti‐cleaved caspase‐3 labelling (Fig EV1F). Conversely, enteroblast‐specific overexpression of Diap1 leads to increased number of progenitor cells (klu + cells) and renewal (Fig 2N). The presence of esg + apoptotic cells along with changes in EB numbers supports the notion that homeostatic ISCs overproduce progenitor cells in relation to demand and that a significant number of those progeny, the EC‐committed EBs, are eliminated by apoptosis in low demand situations. We also found that midgut with silenced Debcl, but not those with silenced Drice, is associated with more mitotic ISCs (Fig EV2A), suggesting that the higher accumulation of klu + cells in Debcl‐RNAi midguts as compared to Drice midguts (Fig 2G and H) may in part be attributed to increased non‐autonomous ISC proliferation. This suggests that surviving EB cells may feedback on the mother ISC.
Figure EV2. Lz and Klu signals in the apoptotic control of enteroblast culling and fate diversification (related to Fig 3).

-
A, A′Quantification of the number of PH3+ cells in posterior midguts after 7 days of tracing with or without apoptosis in EBs (A). Number of midgut scored for the indicated genotypes are n = 15, 4, 5, 6, 4, 14, 9, 10, 5, 4, 11, 9, 13, 14. (A′) Quantification of the number of new ECs (RFP+‐labelled cells) in the indicated posterior midguts (n = 18, 14, 5, 6, 8, 10, 9, 5, 4, 12, 9, 13, 14). The box and whisker plots showing min to max, and the line in the middle of the box denotes the median. **P < 0.01; ***P < 0.001; ****P < 0.0001, one‐way ANOVA with Bonferroni correction.
-
BRepresentative homeostatic midgut labelled with the RFP sensor of JNK activity (red) and Diap1‐GFP (green) and Dlg‐1 (grey) to outline EC membranes.
-
CA magnification of a part of the image showing JNK‐DsRed and Diap1‐GFP. JNK activity is not detected in progenitor cells. Note JNK+ cells are mature ECs as visualized by the Dlg1 marker.
-
D, EGene expression levels addressed by qPCR for the indicated target genes upon N‐ and EGFR manipulations in age‐synchronized adult midguts after 7 days of the temperature shift to inactivate Gal80 (n = 10 guts per each biological replicate, and done three biological replicates, plus three technical replicates. The error bars denote mean ± SD. P value (*P ≤ 0.05; ***P ≤ 0.001; ****P < 0.0001), two‐tailed Student's t‐test.
-
FAdult homeostatic midgut staining with anti‐Lz (a‐Lz) antibody (pink nuclei, arrowhead).
-
G, HMidguts of control lz ReDDM (G) and with p35 overexpression (H). Note that lz + progenitor cells generated differentiated progeny (red cells in H) only when apoptosis was blocked.
-
I, I′Overexpression of lz in ISCs and EBs by esg ReDDM caused precocious differentiation (red‐only cells). Differentiated ECs are labelled by the epithelial marker Dlg‐1 (blue). Note the small size of the new ECs, denoting precocious terminal differentiation.
-
JOverexpression of EGFR act by esg ReDDM.
-
Klz overexpression simultaneously with EGFR act can suppress EB accumulation driven.
It has been demonstrated that damaging ECs increases ISC proliferation but that this increase does not occur immediately (Buchon et al, 2009). Importantly, other authors found that endogenous levels of diap1 mRNA are increased immediately after damaging ECs and before the number of ISC mitoses is increased (Shaw et al, 2010). We hypothesized that when ECs are damaged and thus more rapidly renewed in the intestine, the occurrence of EB deaths may diminish, given that the risk of EB accumulation is also lower. Such a mechanism allows to quickly dispose of a pool of progenitor cells for a rapid turnover of the damaged EC cells. This hypothesis suggests that PCD in the adult midgut EBs is a dynamic and tuneable process, which is expected to be regulated by mechanisms that also regulate cell differentiation.
Enteroblast life/death decision is governed by opposing Notch and EGFR activity
The PCD is an essential process occurring during development to cull excess or unneeded cells (Baehrecke, 2002; Protzer et al, 2008; Mollereau et al, 2012). Moreover, overproduction of progenitor cells appears to be a general mechanism to ensure that correct organ size is attained (Mollereau et al, 2012). However, PCD is rarely investigated as a mechanism to control the progenitor cell numbers in adult epithelial tissues. Yet, spontaneous apoptosis has long been observed in the murine and human intestine (Potten, 1992) although spontaneous deaths were attributed to faulty or aged ISCs or progenitor cells. More recently, manipulation of the apoptosis genes has been shown to cause an increase in hair follicle stem and/or progenitor cell number in the murine skin (Fuchs et al, 2013). Modulation of progenitor cell numbers by PCD has been reported in the adult haematopoietic system (Domen & Weissman, 1999; Oguro & Iwama, 2007). To better understand the process of PCD in the EC‐committed EBs, we examined whether caspase‐induced cell death in old or damaged EC cells, which makes use of the cell death‐ and stress‐responsive Jun N‐terminal Kinase (JNK) cascade and is typically associated with a compensatory proliferation to stimulate cell replacement (Biteau et al, 2008; Chen, 2012), is also employed by the PCD we observed in the EBs. We used the Diap1‐GFP reporter, which serves as a marker of EBs, in tandem with the JNK activity‐sensitive reporter TRE‐dsRED (Chatterjee & Bohmann, 2012) and did not find any evidence of dsRED+ in EB (Diap1‐GFP+) cells (Fig EV2B and C). Indeed, this would be anticipated because JNK‐mediated cell death is typically associated with induction of compensatory proliferation to stimulate the renewal of the damaged cells and maintain homeostasis (Raff, 1996). However, the purpose of culling excess but healthy cells is to reduce their number, and at least during development, this type of apoptosis typically occurs without compensatory proliferation.
The regulation of cell numbers by apoptosis often involves the same signalling pathways that regulate proliferation and differentiation in developing organs. As such, the N and EGFR pathways are prime candidates because they often act antagonistically to promote cell life/death decisions during development (Dominguez et al, 1998; Protzer et al, 2008). Both N (Micchelli & Perrimon, 2006; Ohlstein & Spradling, 2007; Perdigoto et al, 2011) and EGFR (Biteau & Jasper, 2011; Jiang et al, 2011; Zhai et al, 2015) play critical roles in stem cell renewal, EB specification, differentiation and lineage commitment in adult gut homeostasis and regeneration (Biteau & Jasper, 2011; Perdigoto et al, 2011; Jiang & Edgar, 2012; Kapuria et al, 2012), but their role in EB death/survival has not been explored. We investigated the effect of cell‐autonomous manipulations of N and EGFR signalling in EBs using klu ReDDM (Fig 3A–E). Changes in EB number were determined by quantifying klu + cells using lineage‐tracing ReDDM (Fig 3F), and complemented by assessing cell death within the progenitor cell compartment detected by GFP+ TUNEL+ cells using esg ReDDM (Fig 3G). EC renewal (quantified as RFP+‐only cells) and non‐autonomous effects on stem cells mitosis (PH3+ cells) were also assessed in the klu ReDDM guts with altered N and EGFR activity (Fig EV3A and A′).
Figure 3. Enteroblast life and death decision is governed by opposing Notch and EGFR activity.

-
A–EConfocal images of representative midguts of the indicated genotypes using klu ReDDM for tracing and age‐ and EB‐specific transgene expression at day 7 after temperature shift. ISC mitosis was monitored by using PH3 labelling (white) in all guts. (B–E) Accumulation and loss of klu + cells by loss (B and E) and gain (C and D) of N and EGFR signalling. In (C), the accumulation of EC‐committed EBs (klu+ cells) in midguts with constitutively activated EGFR (klu ReDDM> EGFR act) is accompanied with a non‐autonomous increase in ISC mitosis. Inset in (C) shows labelling with Dl (blue), revealing symmetric ISC mitoses as reported previously (Jiang & Edgar, 2009).
-
FQuantification of the number of klu + (EBs) in the indicated midguts (n = 21, 14, 5, 6, 8, 6, 4, 10, 12, 9, 13, 14).
-
GQuantification of apoptotic esg + (TUNEL+ GFP+) cells in the indicated midguts (n = 28, 4, 7, 7, 16, 8, 8, 7, 10, 7, 20, 24). Quantification of PH3+ and EC renewals is in Fig EV2A.
-
H–MConfocal images of representative midguts of the indicated genotypes as in (A–E). (H and I) Rescue of the loss of EBs induced by gain of Notch (H‐RNAi) or the loss of EGFR (EGFR DN) by expressing Debcl‐RNAi. (J and K) Impact of gain of expression (J) and loss by RNAi expression (K) of lz using klu ReDDM (see Fig EV2A for PH3+ quantification). White arrowheads point to examples of mitosis labelled by PH3+. (L and M) Impact of gain of expression (L) or loss by RNAi expression (M) of klu (M) using klu ReDDM.
-
N–RImages of representative midguts of esg ReDDM at day 7 after temperature shift of the indicated genotypes. PH3 labelling (white) detected rare mitoses in the mutant genotypes.
Figure EV3. Silencing Klu/WT1 causes reversion of some enterocyte‐committed enteroblasts to enteroendocrine fate (related to Fig 3).

-
A–CControl klu ReDDM midgut and (B and C) klu ReDDM>klu‐RNAi midgut after 7 days of temperature shift. In wild‐type midguts, klu‐derived cells take on the EC fate and are negative for EE marker Pros (blue). Silencing klu via RNAi converse some klu‐derived cells towards the EE fate (RFP+ Pros+ cells, in B and C). The gut in (C) is counterstained for DAPI (Blue) and Pros is in grey. White arrow (in inset) points to an example of an old EE (Pros+). Red arrows point to examples of klu‐derived renewed EE cells with large nuclei, suggesting that maturing polyploid EB reverted to an EE fate when klu gene was silenced. Scale bar, 25 μm.
-
DQuantification of the renewed EEs in the guts of the indicated genotype (gut scored: control, n = 7; klu>klu‐RNAi, n = 10).
Both EB‐selective overexpression of the dominant negative form of N (Fig 3B) and of a constitutively active allele of EGFR (Fig 3C) led to EB accumulation compared to the control (Fig 3A). Endogenous over‐activated N signalling by RNAi silencing of Hairless (H) (Fig 3D), the main antagonist of N (Bray, 2016), or by expression of a constitutively active N intracellular domain (data not shown) and expression of a dominant negative form of EGFR (Fig 3E), decreased EB number, as assessed by a reduced number of klu + cells (Fig 3F) and increased number of esg + TUNEL+ cells (Fig 3G). Consistently, the loss of EBs caused by gain of N signalling or by EGFR inactivation in EBs was rescued by concomitant inhibition of apoptosis via Debcl‐RNAi expression, also allowing for the new formation of ECs (Fig 3H and I). Previous work has established that activation of EGFR in EBs by EGF‐like ligands produced by different intestinal cells in response to damage acts as a paracrine non‐autonomous signalling mechanism, stimulating ISC proliferation (Jiang & Edgar, 2009; Biteau & Jasper, 2011; Zhai et al, 2015; Chen et al, 2016). In agreement with this, we observed that activation of EGFR in EBs using klu ReDDM promoted survival and non‐autonomously stimulated ISCs division (grey/white label and see extra ISC). ISCs are labelled by Dl marker (inset, Fig 3C)—quantification of mitosis and EC renewal are shown in Fig EV2A. This observation indicated that the massive accumulation of klu + cells in the midguts with constitutive activation of the EGFR pathway in EBs arose by both the suppressed EB death (autonomous effect) and increased ISC divisions (non‐autonomous effect). Three ligands, spitz, keren and vein, have been shown to activate EGFR in the adult intestine (Jiang & Edgar, 2012). Using qPCR, we found that manipulation of N and EGFR activity specifically in EBs led to significant changes in the expression of the three EGF‐ligands (Fig EV2D). We also examined endogenous Diap1 and klu expression levels (Fig EV2E) and found that expression of both genes was significantly changed in midguts with EGFR manipulation and, to a lesser extent, in the midguts with loss of Notch signalling driven by klu‐Gal4, perhaps due to the fact that klu gene is a transcriptional target of N signalling. These analyses also revealed an unexpected requirement for EGFR signalling in regulating endogenous klu expression (Fig EV2E). Thus, in addition to their documented role in stimulating ISC proliferation and EB differentiation (Jiang & Edgar, 2009; Biteau & Jasper, 2011; Zhai et al, 2015), our data illustrate that the activity levels of N and EGFR are also crucial to drive or suppress PCD in EBs. Consistently, we found that gain and loss of N and EGFR were accompanied by increased or reduced apoptotic esg + GFP + as assessed by the TUNEL+ method (Fig 3G), and that these gains and losses are likely attributable to EB life/death decisions (see below).
Dl is the only N ligand acting in adult intestinal homeostasis and regeneration (Ohlstein & Spradling, 2007). ISCs express Dl, which in turn suppresses stemness in the neighbouring daughter cell and drives N‐mediated progenitor cell commitment towards the EC lineage or class II EE cell lineage. Our data suggest that Dl‐mediated activation of N also regulates PCD in EBs. Thus, N and EGFR signalling may counterbalance EB life/death decisions in the adult midgut along with their crucial role in stem cell self‐renewal, proliferation, differentiation and lineage commitment. This model implies that within the same cell, input by N and EGFR may influence alternative cell fates or states, including cell death, maintenance of undifferentiated EB state and terminal differentiation. We hypothesize that EBs not receiving sufficient survival signals (e.g. EGFRlow) will be driven to PCD via the pro‐apoptotic input by Dl‐N signalling, while EBs with low N activation or receiving high anti‐apoptotic input (EGFRhigh) will survive and differentiate or accumulate in the gut in the absence of differentiating input. This view suggests that death/life/differentiation may represent a continuum rather than discreet cell fates. This suggests that the individual EB state may change dynamically, while the population of EB remains relatively stable.
The Lozenge and Klumpfuss pro‐apoptotic factors regulate the undifferentiated cell culling, cell fate diversification and differentiation rate
Klu/WT is a mediator of PCD during development (Rusconi et al, 2004), and we have found that a Gal4 inserted into the klu gene is expressed in EC‐committed EBs. The RUNX homologue Lozenge (Lz/RUNX) along with Klu/WT1 performs a conserved PCD function (Protzer et al, 2008). Therefore, we investigated the role of these two transcriptional regulators in the adult intestine. Using antibodies against the lz/RUNX protein and lz‐Gal4 reporter revealed that the occurrence of lz + cells in a physiological midgut was extremely low (only 1–2 Lz+ per posterior midgut; Fig EV2F). Tracing the fate of lz + cells using lz ReDDM showed that they are likely EB “committed” to die as they did not yield differentiated ECs (Fig EV2G). Consistent with this idea, blocking apoptosis via p35 expression (lz ReDDM >p35: Fig EV2H) increased the number of cells derived from lz + progenitors, supporting that lz expression may mark EB terminally fated to die. Forcing expression of lz in ISCs and EBs using esg ReDDM led to a significant increase in apoptotic esg + cells compared to those obtained by manipulation of N and EGFR (TUNEL+ esg +, Fig 3G). Additionally, esg ReDDM >lz midgut also showed precocious terminal differentiation, reflected as small sized ECs (Figs 3J and EV2I). This suggests that Lz/RUNX is downstream of Klu as no enteroendocrine (Pros+) cells appear to be traced after lz overexpression. When lz was depleted via RNAi using klu ReDDM during 7 days, we observed a significant increase in EB number (Fig 3K) and decreased TUNEL+ esg + cells (Fig 3G). Quantification of EC turnover showed that EB loss was not due to terminal differentiation (Fig EV2A′) and quantification of PH3+ labelling also showed that lz‐RNAi in EBs in addition to modulate apoptosis it also non‐autonomously increases ISC mitosis to a moderate extent (Fig EV2A). This observation is consistent with prior work in the developing fly retina (Behan et al, 2002; Siddall et al, 2003; Wildonger, 2005), showing that Lz promotes apoptosis through downregulation of EGFR signalling and thus loss of lz leads to increased EGFR activity (see below). Overexpression (klu ReDDM >klu; Fig 3L) and depletion of klu (and klu ReDDM >klu‐RNAi; Fig 3M) also changed EB (klu +) cell numbers, and when expressed by esg‐Gal4, it also influenced esg + cell death decision as detected by the TUNEL (Fig 3G).
Because mitosis was slightly increased in guts with silenced lz‐RNAi and Debcl‐RNAi in EBs, we next attempted to separate the effects of proliferation and that of apoptosis/survival by blocking the feedback loop mediated by EGFR. We thus expressed the EGFR DN transgene using esg‐Gal4 to inhibit EGFR in both stem and EB cells. As previously reported, expression of EGFR DN by esg‐Gal4 led to widespread loss of esg + cells and impaired renewal capacity (e.g. Buchon et al, 2009; Jiang & Edgar, 2009) (Fig 3N and O). Strikingly, blocking apoptosis by silencing Debcl via RNAi rescued significantly the esg + cell loss and the EC renewal defect caused by EGFRDN (Fig 3P) without rescuing mitosis (quantification in Fig EV2A). Expression of lz‐RNAi transgene using esg ReDDM partially rescued esg + cell loss by EGFRDN (Fig 3Q), confirming that Lz regulates death/differentiation decisions independent of, or in addition to the cell non‐autonomous regulation of ISC proliferation. Lz‐RNAi expression also suppressed accumulation of EBs triggered by klu overexpression (Fig 3R). Conversely, lz overexpression (Fig EV2I) could rescue the accumulation of esg + cells caused by EGFRact (Fig EV2J and K). These analyses established that the pro‐apoptotic transcriptional regulator Klu acts upstream of Lz, and Lz acts upstream of the caspase inhibitor p35 (Fig EV2H). Collectively, these findings support a N‐Klu‐Lz and EGFR regulatory network in the regulation of physiological apoptosis during intestinal homeostasis (Fig 4A) in which Lz would be required for the irreversible commitment to death downstream of N‐Klu and EGFR, and possibly other factors yet to be defined in the adult Drosophila midgut. In EBs with sufficient survival signals, ectopic lz expression triggered precocious terminal differentiation. This supports the Lz as a regulator of terminal differentiation.
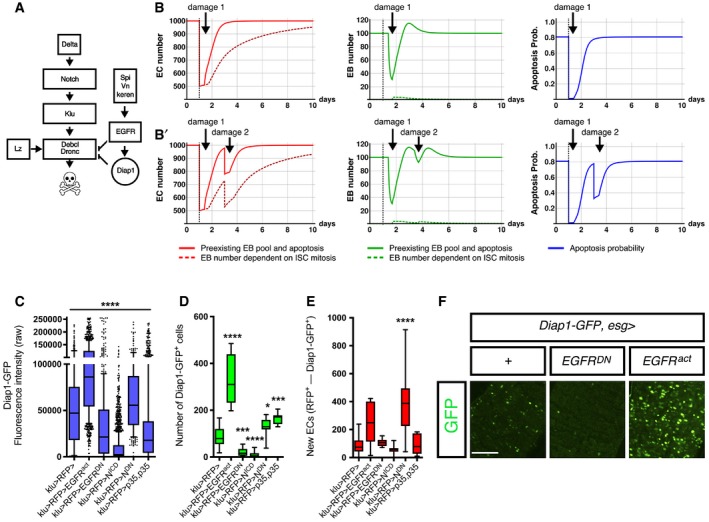
Figure 4. Tuneable apoptosis through tuneable Diap1 signals.
-
AA model of the regulation of physiological cell death in EC‐committed EBs based on our epistatic analysis and previous known gene interactions.
-
B, B′Number of ECs over time (left), number of EBs over time (middle) and probabilities of EB loss through apoptosis (right graph). The simulation starts with 1,000 EC cells in all figures (Appendix Supplementary Methods; Appendix Table S1). In (B), a challenge at day 1 imposes a loss of 500 EC cells (black dashed vertical line). In (B′), two successive challenges are imposed: one at day 1, reducing by half the number of ECs (as in B), and a second one at day 3, causing a loss of 200 cells.
-
CAll EBs show Diap1‐GFP expression but at varying levels, consistent with EB death fate being tuned by apoptotic input counteracting survival signals.
-
DQuantification of the number of Diap1‐GFP+. Note that in p35‐expressing midguts reared in “Low”, GFP levels are not increased, consistent with the p35 protein suppressing apoptosis downstream of Diap1.
-
EQuantification of the number of newly renewed ECs in the indicated genotypes after 7 days. Increase in EB numbers and EC turnover in the EGFRact midgut reflects both suppression of EB deaths and the non‐autonomous stimulation of ISC in this background.
-
FRepresentative images acquired using the same laser intensity are shown for Diap1‐GFP in the indicated illustrative examples. Scale bar, 100 μm.
A role for Klu in sustaining EC fate commitment was also uncovered from klu‐RNAi experiments using esg ReDDM and klu ReDDM (see Fig EV3). EC fate determination requires the Dl‐mediated activation of N signalling in EBs (Perdigoto et al, 2011; Kapuria et al, 2012). In the absence of N activation, upon stem cell division both daughter cells adopt the ISC fate or terminally differentiate as EE cells, which can be marked by Pros (Jiang & Edgar, 2012). However, in the presence of high Dl‐N signalling, the daughter cell receiving N signalling commits to differentiation towards the EC lineage, which is reflected by the committed progenitor cell increasing its size over time via endoreplication (Perdigoto et al, 2011; Lucchetta & Ohlstein, 2012). Dl‐N signalling is also required for the specification of a subset of EE cells (Beehler‐Evans & Micchelli, 2015). These fate‐determination processes are generally depicted as an irreversible commitment. However, we observed that depleting klu by RNAi using klu ReDDM, which is normal gut will only yield ECs (Fig EV3A and A′), caused in some of the klu + cells a switch of their fate towards the EE lineage (Fig EV3B and C). klu‐RNAi midguts showed cells with large nuclei (high DNA content shown by DAPI indicate polyploid cells) labelled with Pros (e.g. Fig EV3C), supporting conversion of EC‐ “committed” EBs towards the EE lineage. Typically, wild‐type midguts have a ratio of 10% EEs (Pros+) to 90% ECs (de Navascués et al, 2012), and no or rare EE cells were found to be descendants of klu + progenitors (see also lineage tracing in Appendix Fig S1O). However, klu‐depleted klu + EBs (klu ReDDM >klu‐RNAi, 7 days, Fig EV3D) generated approximately 33% of total EEs instead of 0% (control guts (mean ± SEM) 0.429 ± 0.297 Pros+ RFP+ cells, and klu>klu‐RNAi guts, 98.1 ± 7.21 Pros+ RFP+ cells), indicating a continuous requirement for Klu gene expression to maintain the EC commitment fate. This experiment uncovered an unanticipated plasticity of EBs to adopt an alternative fate. These observations can be interpreted in two alternative models. In one model, Klu+ activity is required in all EBs for their robust establishment of the EC lineage, as well as the regulation of their number. In the second model, ISCs generate stochastic EC and EE cell fates (~50% EC and ~50% “class II” EE); but N activation could bias the fate towards EC lineage, resulting in more ECs than EE. In such a scenario, Klu+ would be required to robustly maintain the EC fate in a subset of the EBs, which could account for the observation that EC fate still occurs in klu ReDDM >klu‐RNAi guts. Regardless of the mechanism, these findings are in line with recent studies of mammalian stem cell systems that suggest that progenitor cells are primed, not committed, and cell fate decisions remain tuneable by external inputs (Notta et al, 2016).
Comparison of models with a feedback mitosis control and a “tuneable” apoptosis with steady stem cell divisions
Both PCD and stem cell division are energetically costly (Vaux & Korsmeyer, 1999). Thus, to further explore the potential advantages of this apparently costly strategy for adult tissue renewal, we set up a computational model based on these experimental observations to evaluate the performance of a stem cell system in response to injury. We compared a hypothetical system controlling production only by mitosis with a system in which stem cells produce a continuous pool of progenitor cells with further control of their numbers by PCD. The model includes a feedback mechanism by which the steady‐state number of EC determines both the rate of ISC division and the probability of EB to undergo either differentiation or apoptosis (Appendix Fig S2). The model predicts a tighter control of the number of ECs under homeostatic conditions and a faster recovery from acute damage (a sudden EC loss for example through injury) (Fig 4B and B′).
A simulated intestinal turnover with single (Fig 4B) and two successive challenges (Fig 4B′) revealed that both models cope with a loss of around 30 ECs per day (Appendix Fig S2), which was the observed average intestinal cell loss in the “Low” demand ReDDM‐tracing experiments. However, when we challenged the models with one or two successive acute damages (Fig 4B and B′, respectively), only the model with pre‐existing EBs owing to continual ISC divisions predicted a return to homeostasis after 1–2 days after damage consistently with the estimated recovery time determined by previous experimental studies (Amcheslavsky et al, 2008; Buchon et al, 2009; Jiang & Edgar, 2011).
These simulations hinted at EB death fate in the intestine being a tuneable fate decision presumably by extrinsic cues that also stimulate EB differentiation for cell replacement. Consistent with this idea, we noticed that EBs express a varying level of Diap1 (assessed by GFP fluorescent intensity, Fig 4C). Importantly, single manipulations of EGFR, N activity or caspase inhibition markedly changed the numbers of Diap1‐GFP + cells (EBs: Fig 4D; see also quantification of terminal differentiation, new ECs in Fig 4E) along with the Diap1‐GFP levels as assessed by changes in their fluorescent intensity (Fig 4C) and expression by qPCR (Fig EV2E). The baculovirus p35 anti‐apoptotic factor blocks apoptosis downstream of the Diap1 transcriptional repression by Rpr/Hid/Grim factors (Hirata et al, 1995; Meier et al, 2000; Holley et al, 2002; Bergmann & Steller, 2009). As anticipated, expression of the p35 caused accumulation of EBs (Fig 4D) with many of them exhibiting low Diap1‐GFP levels (Fig 4C). This would suggest that EB cells displaying low Diap1 levels would normally undergo PCD but escape death by expressing the anti‐apoptotic factor p35. Importantly, a “tuneable” Diap1‐GFP is also observed when gene manipulations are done using another promoter, esg‐Gal4 (Fig 4F). Note that EBs with constitutively active EGFR had an excess of EBs but a highly variable Diap1‐GFP fluorescence intensity (Fig 4F), suggesting that Diap1 transcription can be tuned by various signals simultaneously. This is consistent with Diap1 transcription being directly regulated by several pathways (Zhang et al, 2008), most notably the Dl‐N pathway itself (Djiane et al, 2013) (see also Discussion).
Our observations suggest that adult ISCs overproduce progenitor cells (EBs) probably as a mechanism to respond rapidly to cell damage, and normally compensate this “overproduction” by a culling excess supply via a caspase‐dependent death programme that requires N, Klu and Lz upstream of caspases and Diap1, analogous to the PCD that eliminates excess cells during retinal development, e.g. (Baker & Yu, 2001; Bergmann & Steller, 2009). Early findings of spontaneous apoptosis in the human and murine intestinal stem/progenitor cell compartment (Potten, 1992) were attributed to a protection strategy to eliminate damaged or aged stem cells. Our study provides a paradigm for how the apoptotic culling process may operate during cell turnover and how this process is interwoven with proliferation and cell fate determination to ensure that the correct cell types and numbers are produced.
Discussion
We have found that steady‐state intestinal stem cell production is not solely controlled by mitosis, but also by a culling process of progenitors. Our observations support a model in which adult ISCs overproduce progenitor cells to ensure rapid intestinal cell renewal in the face of sudden and unpredictable demands, thereby efficiently preserving homeostasis and thus intestinal barrier. Under normal physiological conditions, demand equals supply by ISCs, but in low demand the ISC's production exceeds the tissue demand and EB number is adjusted by a N‐Klu‐Lz‐mediated death via caspase‐dependent programme. We have also shown that the elimination of surplus EBs may be also a critical tumour suppressor strategy. Thus, ISC performance both promotes and limits tumorigenesis, and these findings may explain earlier observations of regeneration defects when endogenous inhibitors of apoptosis were impaired (Fuchs et al, 2013). Moreover, our epistatic data suggest that Lz acts downstream of Klu and it may mediate cross‐talk between N and EGFR to reinforce cell death commitment by dampening EGFR signalling downstream of the receptor (model in Fig 4A) as seen during development (Wildonger, 2005), which may explain how these transcriptional regulators determine robust outcomes of N signalling.
N signalling requires the continuous interaction of the N protein with its membrane‐bound ligand Dl in the adjacent stem cells (Ohlstein & Spradling, 2007; Simons & Clevers, 2011; Liang et al, 2017). EGFR signalling can be activated in the EB in response to multiple EGF‐like signals released by the niche, as well as dying ECs (Liang et al, 2017) that also stimulate ISC proliferation, providing different scenarios for how survival signals may modulate committed progenitor cell numbers. N and EGFR oppositely control life/death decisions in other cellular contexts during development (Baker & Yu, 2001; Gilboa & Lehmann, 2006; Protzer et al, 2008). However, in these other developmental contexts apoptosis is highly stereotyped with an invariant outcome and often occurs after cell fate determination. In adult tissues with high and constant demand for cell turnover, the supply of precursor cells needs to be regulated dynamically and adaptively in coordination with cell fate diversification to respond efficiently to changing environmental conditions and with a sudden increase in demand. Indeed, while N and EGFR act oppositely to control the life/death of EBs, they are both positively required for EB terminal differentiation. It is intriguing that Dl‐N signalling can directly drive expression of both rpr (Krejcí et al, 2009) and Diap1 (Djiane et al, 2013). We hypothesize that N activation may “prime” EB to death by activating caspases through induction of pro‐apoptotic genes, but simultaneously prevent the execution of the caspase‐mediated death programme, which may ultimately depend on the balance of pro‐apoptotic and pro‐survival or pro‐differentiation signals that the EB cells receive. Our data suggest that the balance of pro‐apoptotic and pro‐survival signals, which may be reflected in the levels of Diap1 transcription and/or the GFP levels driven by the enhancer elements contained in the Diap1‐GFP4.3. Caspases appear to be broadly activated in the adult midgut progenitor cells that, depending on level and other input, may perform apoptotic and non‐apoptotic roles (Tang et al, 2015; Baena et al, 2018; and citations therein).
Our data indicate that a “death” signal emanating from the stem cells in direct contact with its committed progeny allows a flexible accommodation of EB number and differentiation to ISC production. We postulate that this “death”/”differentiation” programme may be tuneable by survival/differentiation signals produced by dying cells, from the niche, or other environmental cues, which further attunes EB‐number regulation to varying physiological and pathological conditions. In the haematopoietic system, stochastic cell choice provides flexibility for the maintenance of production of all blood cell lineages in the face of substantial demand for one particular lineage (Enver et al, 1998). In a speculative manner, we suggest that ISC dividing ahead of demand may similarly generate stochastic cell choice (EC and EE) with a high N‐Klu biased fate towards the EC lineage. Derangement of apoptosis‐mediated regulation of EB number along with fate conversion may explain the previously observed tumours associated with impaired N signalling (Biteau et al, 2011) as supported by our findings (Fig 1J). Similarly, the same mechanism of altered apoptosis within the stem/progenitor cell compartment causes hyperplasia and tumour formation during the murine skin regeneration (Fuchs et al, 2013). Our study therefore provides a regulatory logic for the adjustment of progenitor numbers intertwined with both fate diversification and tissue demand.
Materials and Methods
Drosophila stocks and husbandry
The following alleles and fly stocks, as described in Table EV1 and FlyBase (http://flybase.org/), were used:
For ReDDM lineage cell tracing [UAS‐mCD8::GFP, UAS‐H2B::RFP, tubα1‐Gal80 ts; as described in ref. (Antonello et al, 2015)], the following Gal4 drivers were used: esg‐Gal4 (J. Casanova), klu‐Gal4 (T. Klein), GBE‐Su(H)‐Gal4 (Zeng et al, 2010), lz‐Gal4 (FBtp0099102).
Reporter transgenes: Notch activity‐sensitive sensors, GBE‐Su(H)‐lacZ (Furriols & Bray, 2001), the NRE‐EGFP (FBst0030728) and NRE‐mCherry [M{NRE‐RedRabbit.ins} (FBal0268109) (Housden et al, 2012)]; the caspase activity sensor UAS‐Apoliner (Bardet et al, 2008); the initiator caspase Dronc sensor, act‐DBS‐S‐QF (gift from Baena et al, 2018); the Diap1‐GFP.4.3 (Zhang et al, 2008); the Diap1‐lacZ [yw; th j5C8 /TM3Sb, lacZ enhancer trap in thread/diap1; (Ryoo et al, 2002)]; the JNK activity sensor, TRE‐DsRed (Chatterjee & Bohmann, 2012) (FlyBase ID: FBtp0072198, and the Dl‐GFP (Tl{sfGFP}Dl GFP), a fusion protein generated by CRISPR/Cas9 gene targeting by homologous recombination (Corson et al, 2017) (FBal0344893).
Other mutant allele and fly stocks used were as follows: UAS‐p35x2 (two insertions, B. Hay), hsp70‐Gal4 (FlyBase ID: FBst0002077), UAS‐Debcl‐RNAi (TRiP.JF02429), UAS‐Dredd‐RNAi (TRiP.HMS00063), UAS‐Drice‐RNAi (TRiP.HMS00398), UAS‐Dark‐RNAi (TRiP.HMS00870), UAS‐Dronc.s (BDSC:56197, FlyBase ID: FBst0056197), UAS‐Diap1‐RNAi (TRiP.HMS00752), UAS‐klu‐RNAi (TRiP.JF03158), UAS‐N DN (J. Treisman), UAS‐N ICD (FlyBase ID: FBal0093233), UAS‐EGFR DN (FlyBase ID: FBtp0007539), UAS‐EGFR act (EGFR::tor act (Dominguez et al, 1998), UAS‐H‐RNAi (KK104341), UAS‐lz (FlyBase ID: FBtp0125780), UAS‐N‐RNAi (GD14477), UAS‐lz‐RNAi (TRiP.JF02221), UAS‐klu (T. Klein), w 1118 (FlyBase ID: FBst0003605). Actin DBS‐S‐QF, QUAS‐tomato‐HA/+; QUAS‐FLPo (BL30126)/+; Actin5C FRT‐stop‐FRT lacZ‐nls/+ (BL6355) (gift from L.A. Baena), MARCM82 (hsp70‐Flp; tub‐Gal4, UAS‐mCD8::GFP; FRT{neo FRT}82, tubGal80) (gift from N. Perrimon).
MARCM clones: The Drice 17 (FBal0219086) clones were induced by combining MARCM (Mosaic Analysis with a repressible Cell Marker system) with FRT{neo FRT}82B‐containing Drice 17 chromosome (a gift from L.A. Baena). Control (wild type) and Drice 17 clones were induced by a single heat shock of 45 min at 37°C, and adult midguts were analysed at 7 days after clone induction (ACI) and at least 10 clones/midgut were examined in n = 10 adult midguts.
For lineage tracing of the initiator caspase sensor: A Drice‐based sensor fused to the transcriptional activator QF (Act‐DBS‐S‐QF) (Baena et al, 2018) was combined with the QUAS‐FLP transgene and the flp‐out cassette reporter Act5c>FRT>stop>FRT>lacZ (gift from K. Basler). The endogenous activation of the initiator caspase Dronc triggers processing of the Drice‐based sensor and ultimately causes the translocation of the transcriptional activator QF to the nucleus. When combined with QUAS‐FLP and act>FRT>stop>FRT>lacZ construct, lineage tracing of the cells that had activated the Dronc caspase is visualized by the presence of βgalactosidase (βGal) labelling.
Fly crosses were performed at 18°C and reared on standard “Iberian” food. Standard “Iberian” fly food was made by mixing 15 l of water, 0.75 kg of wheat flour, 1 kg of brown sugar, 0.5 kg yeast, 0.17 kg agar, 130 ml of a 5% nipagin solution in ethanol and 130 ml of propionic acid. Upon eclosion, adult female flies of 3–4 days old from control and experimental genotypes were shifted to 29°C in the presence of males and transferred to new food vial every 2 days (“Low” demand condition) or every 7 days (“Variable” demand under standard culturing conditions).
Immunostaining
Adult Drosophila midguts were dissected, fixed for 40 min in 4% PFA and stained using the following primary antibodies in PB‐T buffer (PBS, 0.1% Triton X‐100): rabbit anti‐activated caspase3 (1:2,000, Upstate), rabbit anti‐PH3 (1:2,000, Upstate), mouse anti‐Dlg‐1 (1:100, Hybridoma Bank), mouse anti‐Pros (1:100, Hybridoma Bank), mouse anti‐Dl (1:100, Hybridoma Bank), mouse anti‐Lz (1:100, Hybridoma Bank), sheep anti‐GFP (1:1,000, Biogenesis), chicken anti‐β‐Gal (1:1,000, Abcam), anti‐Diap1 (1:100, from B. Hay's laboratory) and the according Alexa secondary fluorophore coupled antibodies (1:500, Invitrogen). Nuclei were counterstained with DAPI (Sigma) and mounted in Fluoromount‐G (Southern Biotech).
TUNEL assay in stem and progenitor cells
Adult midguts of the indicated genotypes and age were dissected, fixed and immunostained to detect dying GFP‐labelled progenitor cells using the in situ Cell Death Detection Kit (Roche Applied Science, Grenzach, Germany) according to manufacturer's protocol followed by a DAB reaction (Thermo Fisher, Schwerte, Germany). GFP+ and TUNEL+ cells were quantified using a Nikon Fluorescence microscope (Eclipse 90i) using brightfield and fluorescence microscopy to count visual fields of 20 × magnification. For NICD midguts, TUNEL was assays 2 days after temperature shift because this manipulation caused rapid cell loss and lethality. Data represent the proportion of TUNEL+ cells relative to total GFP+ cells. Graphs and all statistical analyses were performed using GraphPad Prisma 8, and data were analysed using ANOVA (analysis of variance with Bonferroni correction) statistical test and Student's t‐tests.
Image acquisition
Confocal images were obtained with a Leica TCS SP5 inverted confocal microscope, using a 1,024 × 1,024 image size. Stacks were typically collected every 1 μm, and the images were reconstructed using max projection. Images were evaluated and scaled using Fiji/ImageJ. In all cases, the images shown in the Figures are representative of the effect of the genetic manipulation.
Quantitative PCR
To assess the efficacy of the RNAi transgenes, mRNA was extracted from wandering third‐instar larvae with the corresponding RNAi transgene (hsp70‐Gal4>UAS‐RNAi) or without (control, hsp70‐Gal4>) after a 1‐h heat shock at 37°C to induce transgene expression. To determine mRNA levels, we used superScript First‐Strand Synthesis System for RT–PCR (Invitrogen) and SYBR Green PCR Master kit (Applied Biosystems), according to the manufacturer's instructions. The cDNAs were amplified using specific primers designed using the ProbeFinder software by Roche Applied Science, and RpL32 was used as a house‐keeping gene for normalization.
The following primers were used:
| Gene | Forward | Reverse |
|---|---|---|
| Drice | 5′‐GTCGGCCCACCCTTATCTA‐3′ | 5′‐TGGACGACCATGACACACAG‐3′ |
| Debcl | 5′‐ATCATCAACCAGGGGAAATGTCTG‐3′ | 5′‐GTTGCGCAAACGCTGTGTC‐3′ |
| Diap1 | 5′‐AAATCGTTCATTCTGGTTTTGTTT‐3′ | 5′‐GATCTTCCGTCTTATGGACCTATC‐3′ |
| H | 5′‐AACTGTGACCCCAACGTCG‐3′ | 5′‐CGAGCTGTTGTCGTCCGAA‐3′ |
| lz | 5′‐TTCACCAGGATCTATTGTGGATGG‐3′ | 5′‐ATTGCTCGTGCGCACCAATTC‐3′ |
| keren | 5′‐CCGCTTTAATCGGCGCTTAC‐3′ | 5′‐ATCGGGAAGGTGACATTCGG‐3′ |
| klu | 5′‐ACCGTCTAAATCAAAGAGTCCCA‐3′ | 5′‐TGGCCACAAGATATCCAGCC‐3′ |
| N | 5′‐ACCGTTCGCGGAACTGATACC‐3′ | 5′‐GCGCAGTAGGTTTTGCCATTG‐3′ |
| RpL32 | 5′‐TGTCCTTCCAGCTTCAAGATGACCATC‐3′ | 5′‐CTTGGGCTTGCGCCATTTGTG‐3′ |
| spitz | 5′‐TGCGGTGAAGATAGCCGATC‐3′ | 5′‐TTCGCATCGCTGTCCCATAA‐3′ |
| vein | 5′‐TCCGAGCTAATAGTGCGCTC‐3′ | 5′‐TTTATTCTTGGCCCGGCACT‐3′ |
Quantification and statistical analysis, cell counting and fluorescence measurements
For progenitor cell counts, 20× images of ReDDM posterior midguts (pmg, R5) of the different genotypes and conditions were cropped with ImageJ (Fiji 64bit) for processing and quantification with Matlab. A self‐written script optimized for the ReDDM method that analyses quality (size, colour) and quantity (count events) in posterior midguts was used to measure the number of progenitor cells (double‐positive mCD8::GFP H2B::RFP cells) and DAPI nuclei (Antonello et al, 2015).
Measurements of fluorescence intensity of Diap1‐lacZ/βGal staining and Diap1‐GFP were acquired with a fixed 488 nm laser intensity, and images of midguts were analysed using a Fiji‐script for intensity per cell available from the authors. For Diap1‐lacZ/βGal quantification in Appendix Fig S1K, intestines were stained with anti‐βGal antibody and DAPI. One confocal plane was used to calculate β‐Gal fluorescence intensity of nuclear region of interest (ROI) using ImageJ. The ISCs were identified by co‐expression of the Dl‐GFP enhancer trap (ISCs) and the EBs by the N reporter element NRE‐mCherry (NRE‐RedRabbit.ins; Housden et al, 2012), while enterocytes (ECs) were identified by the exclusive DAPI staining (polyploid, Dl‐GFP negative and NRE‐mCherry negative). Data were analysed using GraphPad Prisma 8. Representative images are shown in all panels. For experiments of the role of apoptosis, at least 20 posterior midguts were scored. For complex experiments analysing many gene conditions, cell counting was usually done in at least four to 10 posterior midguts.
Key resources, antibodies, etc. in Table EV1.
Mathematical model and equations are described in Appendix Supplementary Methods.
Author contributions
TR and ZAA performed the majority of experiments and analyses and contributed to the design of the study. EB‐I. and LM assisted with the molecular and genetic analysis. SS, MN and LMM developed the computational models. MD provided the general concept, the study design, interpretation, analyses, and supervision, and TR, ZAA and MD wrote the paper.
Conflict of interest
The authors declare that they have no conflict of interest.
Supporting information
Appendix
Expanded View Figures PDF
Table EV1
Source Data for Appendix
Review Process File
Source Data for Figure 4
Acknowledgements
We thank T. Klein, P. Adler, K. Dücker, S. Bray, J‐P. Vincent, L.A. Baena, H. Herranz, N. Perrimon and B. Hay for reagents; the Bloomington Drosophila Stock Center (NIHP400D018537), the Transgenic RNAi Project (TRiP) at Harvard Medical School (NIK/NIGMS R01‐GM084947) and the Vienna Drosophila Resource Center (VDRC, http://www.vdrc.at) for providing transgenic RNAi fly stocks. We also thank I. Oliveira for technical assistance. T.R. was funded by a postdoctoral Deutsche Forschungsgesellschaft (DFG) fellowship and by a contract by Foundation Botin, and Z.A.A. by a fellowship from MEC‐CONSOLIDER. This work in the Dominguez's laboratory was supported by the Spanish Ministry of Economy and Competitiveness and co‐financed by FEDER funds (BFU2015‐64239‐R and “Severo Ochoa” Program for Centers of Excellence in R&C, SEV‐2013‐0317), the Scientific Foundation of the AECC (Spanish Association Against Cancer) (CICPF16001DOMÍ) and the Valencian Regional Government's Prometeo Programme for research groups of excellence (PROMETEO/2017/146) to M.D.
The EMBO Journal (2019) 38: e101346
References
- Amcheslavsky A, Jiang J, Ip YT (2008) Tissue damage‐induced intestinal stem cell division in Drosophila . Stem Cell 4: 49–61 [DOI] [PMC free article] [PubMed] [Google Scholar]
- Antonello ZA, Reiff T, Ballesta‐Illan E, Dominguez M (2015) Robust intestinal homeostasis relies on cellular plasticity in enteroblasts mediated by miR‐8‐Escargot switch. EMBO J 34: 2025–2041 [DOI] [PMC free article] [PubMed] [Google Scholar]
- Apidianakis Y, Rahme LG (2010) Drosophila melanogaster as a model for human intestinal infection and pathology. Dis Models Mech 4: 21–30 [DOI] [PMC free article] [PubMed] [Google Scholar]
- Baehrecke EH (2002) How death shapes life during development. Nat Rev Mol Cell Biol 3: 779–787 [DOI] [PubMed] [Google Scholar]
- Baena LA, Arthirson L, Bischoff M, Vincent J‐P, Alexander C, McGregar R (2018) Novel initiator caspase reporters uncover previously unknown features of caspase‐activating cells. Development 145: dev170811 [DOI] [PMC free article] [PubMed] [Google Scholar]
- Baker NE, Yu SY (2001) The Egf receptor defines domains of cell cycle progression and survival to regulate cell number in the developing Drosophila eye. Cell 104: 699–708 [DOI] [PubMed] [Google Scholar]
- Bardet PL, Kolahgar G, Mynett A, Miguel‐Aliaga I, Briscoe J, Meier P, Vincent JP (2008) A fluorescent reporter of caspase activity for live imaging. Proc Natl Acad Sci USA 105: 13901–13905 [DOI] [PMC free article] [PubMed] [Google Scholar]
- Beehler‐Evans R, Micchelli CA (2015) Generation of enteroendocrine cell diversity in midgut stem cell lineages. Development 142: 654–664 [DOI] [PMC free article] [PubMed] [Google Scholar]
- Behan KJ, Nichols CD, Cheung TL, Farlow A, Hogan BM, Batterham P, Pollock JA (2002) Yan regulates lozenge during Drosophila eye development. Dev Genes Evol 212: 267–276 [DOI] [PubMed] [Google Scholar]
- Bergmann AA, Steller HH (2009) Apoptosis, stem cells, and tissue regeneration. Sci Signal 3: re8 [DOI] [PMC free article] [PubMed] [Google Scholar]
- Biteau B, Hochmuth CE, Jasper H (2008) JNK activity in somatic stem cells causes loss of tissue homeostasis in the aging Drosophila gut. Stem Cell 3: 14–14 [DOI] [PMC free article] [PubMed] [Google Scholar]
- Biteau B, Jasper H (2011) EGF signaling regulates the proliferation of intestinal stem cells in Drosophila . Development 138: 1045–1055 [DOI] [PMC free article] [PubMed] [Google Scholar]
- Biteau B, Hochmuth CE, Jasper H (2011) Maintaining tissue homeostasis: dynamic control of somatic stem cell activity. Cell Stem Cell 9: 402–411 [DOI] [PMC free article] [PubMed] [Google Scholar]
- Bray SJ (2016) Notch signalling in context. Nature 17: 722–735 [DOI] [PubMed] [Google Scholar]
- Buchon N, Broderick NA, Poidevin M, Pradervand S, Lemaitre B (2009) Drosophila intestinal response to bacterial infection: activation of host defense and stem cell proliferation. Cell Host Microbe 5: 200–211 [DOI] [PubMed] [Google Scholar]
- Chatterjee N, Bohmann D (2012) A versatile ΦC31 based reporter system for measuring AP‐1 and Nrf2 signaling in Drosophila and in tissue culture. PLoS ONE 7: e34063 [DOI] [PMC free article] [PubMed] [Google Scholar]
- Chen F (2012) JNK‐induced apoptosis, compensatory growth, and cancer stem cells. Cancer Res 72: 379–386 [DOI] [PMC free article] [PubMed] [Google Scholar]
- Chen J, Xu N, Huang H, Cai T, Xi R (2016) A feedback amplification loop between stem cells and their progeny promotes tissue regeneration and tumorigenesis. Elife 5: e14330 [DOI] [PMC free article] [PubMed] [Google Scholar]
- Chen J, Xu N, Wang C, Huang P, Huang H, Jin Z, Yu Z, Cai T, Jiao R, Xi R (2018) Transient Scute activation via a self‐stimulatory loop directs enteroendocrine cell pair specification from self‐renewing intestinal stem cells. Nat Cell Biol 20: 152–161 [DOI] [PubMed] [Google Scholar]
- Corson F, Couturier L, Rouault H, Mazouni K, Schweisguth F (2017) Self‐organized Notch dynamics generate stereotyped sensory organ patterns in Drosophila . Science 356: eaai7407 [DOI] [PubMed] [Google Scholar]
- Ding AX, Sun G, Argaw YG, Wong JO, Easwaran S, Montell DJ (2016) CasExpress reveals widespread and diverse patterns of cell survival of caspase‐3 activation during development in vivo . Elife 5: e10936 [DOI] [PMC free article] [PubMed] [Google Scholar]
- Djiane A, Krejčí A, Bernard F, Fexova S, Millen K, Bray SJ (2013) Dissecting the mechanisms of Notch induced hyperplasia. EMBO J 32: 60–71 [DOI] [PMC free article] [PubMed] [Google Scholar]
- Domen JJ, Weissman ILI (1999) Self‐renewal, differentiation or death: regulation and manipulation of hematopoietic stem cell fate. Mol Med Today 5: 201–208 [DOI] [PubMed] [Google Scholar]
- Dominguez M, Wasserman JD, Freeman M (1998) Multiple functions of the EGF receptor in Drosophila eye development. Curr Biol 8: 1039–1048 [DOI] [PubMed] [Google Scholar]
- Enver TT, Heyworth CMC, Dexter TMT (1998) Do stem cells play dice? Blood 92: 348–352 [PubMed] [Google Scholar]
- Fuchs Y, Steller H (2011) Programmed cell death in animal development and disease. Cell 147: 742–758 [DOI] [PMC free article] [PubMed] [Google Scholar]
- Fuchs Y, Brown S, Gorenc T, Rodriguez J, Fuchs E, Steller H (2013) Sept4/ARTS regulates stem cell apoptosis and skin regeneration. Science 341: 286–289 [DOI] [PMC free article] [PubMed] [Google Scholar]
- Furriols M, Bray S (2000) Dissecting the mechanisms of suppressor of hairless function. Dev Biol 227: 520–532 [DOI] [PubMed] [Google Scholar]
- Furriols M, Bray S (2001) A model Notch response element detects Suppressor of Hairless‐dependent molecular switch. Curr Biol 11: 60‐64 [DOI] [PubMed] [Google Scholar]
- Gilboa L, Lehmann R (2006) Soma‐germline interactions coordinate homeostasis and growth in the Drosophila gonad. Nature 443: 97–100 [DOI] [PubMed] [Google Scholar]
- Hirata J, Nakagoshi H, Nabeshima Y, Matsuzaki F (1995) Asymmetric segregation of the homeodomain protein Prospero during Drosophila development. Nature 377: 627–630 [DOI] [PubMed] [Google Scholar]
- Holley CL, Olson MR, Colón‐Ramos DA, Kornbluth S (2002) Reaper eliminates IAP proteins through stimulated IAP degradation and generalized translational inhibition. Nat Cell Biol 4: 439–444 [DOI] [PMC free article] [PubMed] [Google Scholar]
- Housden BE, Millen K, Bray SJ (2012) Drosophila reporter vectors compatible with ΦC31 integrase transgenesis techniques and their use to generate new notch reporter fly lines. G3 2: 79–82 [DOI] [PMC free article] [PubMed] [Google Scholar]
- Jiang H, Edgar BA (2009) EGFR signaling regulates the proliferation of Drosophila adult midgut progenitors. Development 136: 483–493 [DOI] [PMC free article] [PubMed] [Google Scholar]
- Jiang H, Patel PH, Kohlmaier A, Grenley MO, McEwen DG, Edgar BA (2009) Cytokine/Jak/Stat signaling mediates regeneration and homeostasis in the Drosophila midgut. Cell 137: 1343–1355 [DOI] [PMC free article] [PubMed] [Google Scholar]
- Jiang H, Edgar BA (2011) Intestinal stem cells in the adult Drosophila midgut. Exp Cell Res 317: 2780–2788 [DOI] [PMC free article] [PubMed] [Google Scholar]
- Jiang H, Grenley MO, Bravo MJ, Blumhagen RZ, Edgar BA (2011) EGFR/Ras/MAPK signaling mediates adult midgut epithelial homeostasis and regeneration in Drosophila . Stem Cell 8: 84–95 [DOI] [PMC free article] [PubMed] [Google Scholar]
- Jiang H, Edgar BA (2012) Intestinal stem cell function in Drosophila and mice. Curr Opin Genet Dev 22: 354–360 [DOI] [PMC free article] [PubMed] [Google Scholar]
- Kapuria SS, Karpac JJ, Biteau BB, Hwangbo DD, Jasper HH (2012) Notch‐mediated suppression of TSC2 expression regulates cell differentiation in the Drosophila intestinal stem cell lineage. PLoS Genet 8: e1003045 [DOI] [PMC free article] [PubMed] [Google Scholar]
- Klein TT, Campos‐Ortega JAJ (1997) klumpfuss, a Drosophila gene encoding a member of the EGR family of transcription factors, is involved in bristle and leg development. Development 124: 3123–3134 [DOI] [PubMed] [Google Scholar]
- Korzelius J, Ronnen‐Oron T, Baldauf M, Meier E, Sousa‐Victor P, Jasper H (2019) The WT1‐like transcription factor Klumpfuss maintains lineage commitment in the intestine. Nat Commun 10: 4123 [DOI] [PMC free article] [PubMed] [Google Scholar]
- Krejcí A, Bernard F, Housden BE, Collins S, Bray SJ (2009) Direct response to Notch activation: signaling crostalk and incoherent logic. Sci Signal 2: ra1 [DOI] [PubMed] [Google Scholar]
- Liang J, Balachandra S, Ngo S, O'Brien LE (2017) Feedback regulation of steady‐state epithelial turnover and organ size. Nature 548: 588–591 [DOI] [PMC free article] [PubMed] [Google Scholar]
- Lucchetta EM, Ohlstein B (2012) The Drosophila midgut: a model for stem cell driven tissue regeneration. Wiley Interdiscip Rev Dev Biol 1: 781–788 [DOI] [PMC free article] [PubMed] [Google Scholar]
- Meier P, Silke J, Leevers SJ, Evan GI (2000) The Drosophila caspase DRONC is regulated by DIAP1. EMBO J 19: 598–611 [DOI] [PMC free article] [PubMed] [Google Scholar]
- Micchelli CA, Perrimon N (2006) Evidence that stem cells reside in the adult Drosophila midgut epithelium. Nature 439: 475–479 [DOI] [PubMed] [Google Scholar]
- Mollereau B, Perez‐Garijo A, Bergmann A, Miura M, Gerlitz O, Ryoo HD, Steller H, Morata G (2012) Compensatory proliferation and apoptosis‐induced proliferation: a need for clarification. Cell Death Differ 20: 181–181 [DOI] [PMC free article] [PubMed] [Google Scholar]
- de Navascués J, Perdigoto CN, Bian Y, Schneider MH, Bardin AJ, Martinez Arias A, Simons BD (2012) Drosophila midgut homeostasis involves neutral competition between symmetrically dividing intestinal stem cells. EMBO J 31: 2473–2485 [DOI] [PMC free article] [PubMed] [Google Scholar]
- Notta F, Zandi S, Takayama N, Dobson S, Gan OI, Wilson G, Kaufmann KB, McLeod J, Laurenti E, Dunant CF et al (2016) Distinct routes of lineage development reshape the human blood hierarchy across ontogeny. Science 351: aab2116 [DOI] [PMC free article] [PubMed] [Google Scholar]
- O'Brien LE, Soliman SS, Li X, Bilder D (2011) Altered modes of stem cell division drive adaptive intestinal growth. Cell 147: 603–614 [DOI] [PMC free article] [PubMed] [Google Scholar]
- Oguro H, Iwama A (2007) Life and death in haematopoietic stem cells. Curr Opin Immunol 19: 503–509 [DOI] [PubMed] [Google Scholar]
- Ohlstein B, Spradling A (2006) The adult Drosophila posterior midgut is maintained by pluripotent stem cells. Nature 439: 470–474 [DOI] [PubMed] [Google Scholar]
- Ohlstein B, Spradling A (2007) Multipotent Drosophila intestinal stem cells specify daughter cell fates by differential notch signaling. Science 315: 988–992 [DOI] [PubMed] [Google Scholar]
- Parasram K, Bernardon N, Hammoud M, Chang H, He L, Perrimon N, Karpowicz P (2018) Intestinal stem cells exhibit conditional circadian clock function. Stem Cell Rep 13: 1287–1301 [DOI] [PMC free article] [PubMed] [Google Scholar]
- Perdigoto CN, Schweisguth F, Bardin AJ (2011) Distinct levels of Notch activity for commitment and terminal differentiation of stem cells in the adult fly intestine. Development 138: 4585–4595 [DOI] [PubMed] [Google Scholar]
- Potten CS (1992) The significance of spontaneous and induced apoptosis in the gastrointestinal tract of mice. Cancer Metast Rev 11: 179–195 [DOI] [PubMed] [Google Scholar]
- Protzer CE, Wech I, Nagel AC (2008) Hairless induces cell death by downregulation of EGFR signalling activity. J Cell Sci 121: 3167–3176 [DOI] [PubMed] [Google Scholar]
- Raff MC (1996) Size control: the regulation of cell numbers in animal development. Cell 86: 173–175 [DOI] [PubMed] [Google Scholar]
- Rusconi JC, Fink JL, Cagan R (2004) klumpfuss regulates cell death in the Drosophila retina. Mech Dev 121: 537–546 [DOI] [PubMed] [Google Scholar]
- Ryoo HD, Bergmann A, Gonen H, Ciechanover A, Steller H (2002) Regulation of Drosophila IAP1 degradation and apoptosis by reaper and ubcD1. Nat Cell Biol 4: 32–438 [DOI] [PubMed] [Google Scholar]
- Sallé J, Gervais L, Boumard B, Stefanutti M, Siudeja K, Bardin AJ (2017) Intrinsic regulation of enteroendocrine fate by Numb. EMBO J 36: 1928–1945 [DOI] [PMC free article] [PubMed] [Google Scholar]
- Shaw RL, Kohlmaier A, Polesello C, Veelken C, Edgar BA, Tapon N (2010) The Hippo pathway regulates intestinal stem cell proliferation during Drosophila adult midgut regeneration. Development 137: 4147–4158 [DOI] [PMC free article] [PubMed] [Google Scholar]
- Siddall NAN, Behan KJK, Crew JRJ, Cheung TLT, Fair JAJ, Batterham PP, Pollock JAJ (2003) Mutations in lozenge and D‐Pax2 invoke ectopic patterned cell death in the developing Drosophila eye using distinct mechanisms. Dev Genes Evol 213: 107–119 [DOI] [PubMed] [Google Scholar]
- Simons BD, Clevers H (2011) Stem cell self‐renewal in intestinal crypt. Exp Cell Res 317: 2719–2724 [DOI] [PubMed] [Google Scholar]
- Tang HL, Tang HM, Fung MC, Hardwick JM (2015) In vivo CaspaseTracker biosensor system for detecting anastasis and non‐apoptotic caspase activity. Sci Rep 5: 9015 [DOI] [PMC free article] [PubMed] [Google Scholar]
- Vasudevan D, Don Ryoo H (2015) Regulation of cell death by IAPs and their antagonists. Curr Top Dev Biol 114: 185–208 [DOI] [PMC free article] [PubMed] [Google Scholar]
- Vaux DL, Korsmeyer SJ (1999) Cell death in development. Cell 96: 245–254 [DOI] [PubMed] [Google Scholar]
- Wildonger J (2005) Lozenge directly activates argos and klumpfuss to regulate programmed cell death. Genes Dev 19: 1034–1039 [DOI] [PMC free article] [PubMed] [Google Scholar]
- Zacharioudaki E, Bray SJ (2014) Tools and methods for studying Notch signaling in Drosophila melanogaster . Methods 68: 173–182 [DOI] [PMC free article] [PubMed] [Google Scholar]
- Zeng X, Chauhan C, Hou SX (2010) Characterization of midgut stem cell‐ and enteroblast‐specific Gal4 lines in Drosophila . Genesis 48: 607–611 [DOI] [PMC free article] [PubMed] [Google Scholar]
- Zhai Z, Kondo S, Ha N, Boquete J‐P, Brunner M, Ueda R, Lemaitre B (2015) Accumulation of differentiating intestinal stem cell progenies drives tumorigenesis. Nat Comms 6: 10219 [DOI] [PMC free article] [PubMed] [Google Scholar]
- Zhang L, Ren F, Zhang Q, Chen Y, Wang B, Jiang J (2008) The TEAD/TEF family of transcription factor scalloped mediates hippo signaling in organ size control. Dev Cell 14: 377–387 [DOI] [PMC free article] [PubMed] [Google Scholar]
Associated Data
This section collects any data citations, data availability statements, or supplementary materials included in this article.
Supplementary Materials
Appendix
Expanded View Figures PDF
Table EV1
Source Data for Appendix
Review Process File
Source Data for Figure 4