Abstract
We sought to calibrate mechanical properties of left ventricle (LV) based on three-dimensional (3D) speckle tracking echocardiographic imaging data recorded from 16 segments defined by American Heart Association (AHA). The in vivo data were used to create finite element (FE) LV and biventricular (BV) models. The orientation of the fibers in the LV model was rule based, but diffusion tensor magnetic resonance imaging (MRI) data were used for the fiber directions in the BV model. A nonlinear fiber-reinforced constitutive equation was used to describe the passive behavior of the myocardium, whereas the active tension was described by a model based on tissue contraction (Tmax). isight was used for optimization, which used abaqus as the forward solver (Simulia, Providence, RI). The calibration of passive properties based on the end diastolic pressure volume relation (EDPVR) curve resulted in relatively good agreement (mean error = −0.04 ml). The difference between the experimental and computational strains decreased after segmental strain metrics, rather than global metrics, were used for calibration: for the LV model, the mean difference reduced from 0.129 to 0.046 (circumferential) and from 0.076 to 0.059 (longitudinal); for the BV model, the mean difference nearly did not change in the circumferential direction (0.061) but reduced in the longitudinal direction from 0.076 to 0.055. The calibration of mechanical properties for myocardium can be improved using segmental strain metrics. The importance of realistic fiber orientation and geometry for modeling of the LV was shown.
Introduction
Heart disease is the leading cause of death in the US and worldwide [1]. Nearly 6.2 million adults had heart failure (HF) between 2013 and 2016 [2]. The cost and prevalence of heart disease is on the rise. Between 2014 and 2015 (average annual), the estimated costs (direct and indirect) of heart diseases were $218.7 billion [2]. The cost of HF was estimated to be $31 billion in 2012 in US alone and is projected to be $70 billion by 2030 [3]. The number of people with HF in the US is projected to increase from more than 5 million in 2012 to more than 8 million in 2030 [3]. Therefore, there is an absolute need for efficient methods for prevention and treatment of heart disease.
Characterization of myocardial material properties has important clinical applications [4–6]. Mechanical stress has a key role in understanding the mechanics of myocardium [7]. Myocardium stress can be evaluated if the mechanical properties of the tissue are quantified. The stress distribution within myocardium affects blood flow in coronary arteries [8] and also oxygen consumption within the myocardial tissue [9]. Abnormal myocardial stress leads to hypertrophy of the left ventricle (LV) [10]. However, experimental invasive determination of myocardial stress is not currently a reliable option because errors inherent to the experimental methods are so large that they make the measurements unreliable [11,12].
Computational modeling has been used to estimate myocardial mechanical properties noninvasively. We previously used tagged magnetic resonance imaging (MRI) to calibrate mechanical properties [4]. Recently, we used ex vivo MRI data to reconstruct an anatomically accurate geometry of the heart with high resolution [13]. However, the material properties were estimated based on global LV metrics, namely stroke volume and longitudinal strain. The computational circumferential and longitudinal strains were generally in agreement with experimental strains obtained from three-dimensional (3D) speckle tracking echocardiography, but the level of agreement, particularly for longitudinal strain, needs improvement [13].
The goals of this study were threefold. First, to validate our calibration method based on isight (Simulia, Providence, RI) and abaqus (Simulia, Providence, RI) by testing this method for LV models in which calibrated material parameters are known. Second, to explore the capability of isight to improve state-of-the-art material calibration for a porcine biventricular (BV) model based on segmental strain metrics [13]. Third, to compare the BV ex vivo MRI-based models [13] to the in vivo 3D echo-based LV models. Using an anatomically accurate geometry of the LV, we estimated LV mechanical properties to minimize the difference between the computational and experimental strain metrics. Unlike the previous studies that used global LV metrics such as stroke volume and global longitudinal strain, we used the segmental strain metrics from 16 segments according to American Heart Association (AHA) guidelines. The experimental strain metrics in these segments were used to define and minimize the objective function. Moreover, we used strains provided by speckle tracking echocardiography of the heart. The abaqus living heart framework [14–16] was used to find computational strains using finite element (FE) modeling, whereas the whole optimization algorithm was conducted by isight. One of the possible applications of this project would be to quantify myocardial contractility after treatments with cardiac devices such as the left ventricle assistive device (LVAD) or MitraClip. For example, after patients with HF receive an LVAD, the methodology presented in this study can be used to determine when their LV function has recovered sufficiently for explant of the LVAD [17–19]. By providing a more realistic approach to the calibration of the mechanical properties of the LV, the findings of this paper should lead to more realistic cardiac models.
2. Methods
2.1. Animal Experiment.
The animal experiment was performed in accordance with national and local ethical guidelines, including the Guide for the Care and Use of Laboratory Animals, the Public Health Service Policy on Humane Care and Use of Laboratory Animals, and the Animal Welfare Act, and an approved California Medical Innovations Institute IACUC protocol regarding the use of animals in research.
One Yorkshire domestic swine was used in this study. The animal was sedated with TKX (Telazol 10 mg/kg, Ketamine 5 mg/kg, and Xylazine 5 mg/kg, intramuscular (IM)), intubated, and maintained on surgical anesthesia with isoflurane (1–2%) and oxygen while on the ventilator. The neck and the right inguinal area were shaved and scrubbed with nolvasan, alcohol, and betadine. A 5Fr introducer sheath was placed percutaneously in the right jugular vein to administer fluids and drugs. Heparin 100 international units (IU)/kg body weight was administered intravenously before further instrumentation. A 6Fr introducer sheath was placed percutaneously into the right femoral artery. A hockey-stick guiding catheter was advanced over a 0.035 in. guide wire through the introducer sheath toward the LV to measure pressure. The geometry of the LV was measured using 3D echocardiography using a Philips (iE33) transesophageal probe (X7-2t). Strain was measured using speckle tracking (TomTec, Unterschleissheim, Germany) at 16 segments of the AHA segmentation. The LV pressure was recorded at the time of echo acquisition. After the procedures, the animal was euthanized with a bolus injection (60 mL) of potassium chloride under deep anesthesia (Isoflurane 5%).
2.2. Computational Modeling
2.2.1. Geometry Reconstruction.
The geometry of the LV in early diastole was reconstructed from echocardiography images using QLAB 10 (Philips, Andover, MA) after the echocardiography data were acquired [20]. The reconstructed geometry was meshed using TrueGrid (XYZ Scientific Applications, Inc., Pleasant Hill, CA). An example echocardiography image and the mesh are shown in Fig. 1.
Fig. 1.
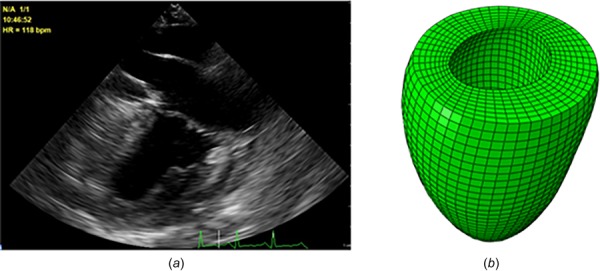
The echo image (a) and the reconstructed geometry and the mesh for the LV (b). We also used a BV geometry described by Sack et al. [13]
In addition to a single LV model, we analyzed our previously described BV model [13]. The LV and BV models are from the same animal. We used the Simulia Living Heart Project framework for the single LV model [14,15]. In the BV model, atria were excluded but their effects were considered via lumped parameter models [13].
During diastole, the end-diastolic pressure (EDP) was applied. During systole, the myocardium contracted, and the interaction between the LV and the circulation system was considered using a Windkessel model [21,22]. Systolic blood flow between the LV and the circulation system was modeled by applying an initial pressure of 80 mmHg, and unidirectional fluid exchange was enforced.
The passive tissue behavior was based on a fiber-reinforced constitutive equation in the literature [23,24]
| (1) |
With
It was assumed that the myofibers deviated from the circumferential direction smoothly, changing in direction from −60 deg in epicardium, aligned circumferentially at the midwall, and orientated to +60 deg in endocardium [25,26]. In line with experimental [27,28] and computational studies [24,29], we assumed sheet direction is normal to the epicardial and endocardial surfaces where the fiber directions are located.
To determine the passive material constants, we used the analytical end-diastolic pressure volume relation (EDPVR) curve reported by Klotz and colleagues [30]. For this purpose, we used end-diastolic volume (EDV) (57.8 ml) and EDP (13.5 mmHg) to create the analytical curve, and then, determined the passive constants such that the difference between the numerical and analytical volumes was minimized at multiple points along the EDPVR curve (see Results section, Fig. 2).
Fig. 2.
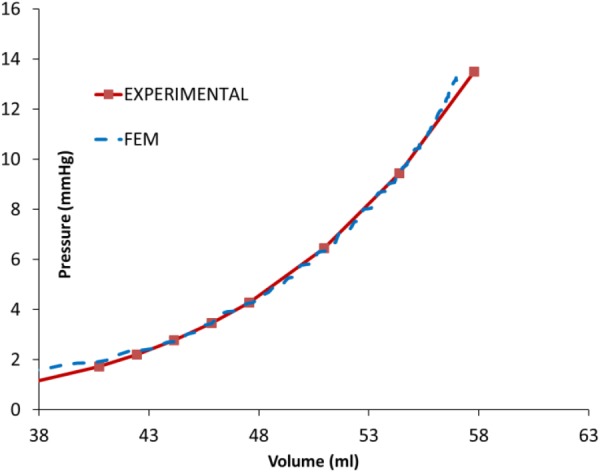
The experimental and computational EDV PVRs were in close agreement
Full cardiac cycle (diastole and systole) was simulated. The active stress in the myocardium was calculated from calcium concentration as follows [26,31,32]:
| (2) |
With
The active fiber stress is partially transferred to the sheet by a parameter called [13,33]. The total stress was the sum of active and passive stresses.
The center of aortic endocardial annulus was fixed, and the average translational and rotational motions of the nodes at the endocardial annulus were coupled to the fixed point. The blood pressure was applied at the endocardial surface as the loading condition. The optimization was done in isight (Simulia, Providence, RI), which used abaqus Explicit (Simulia, Providence, RI) as the forward solver (Fig. 3). The element types in the LV and BV models were C3D8 (eight-node linear brick) and C3D10M (ten-node modified tetrahedron, with hourglass control), respectively (abaqus Analysis User's manual).
Fig. 3.
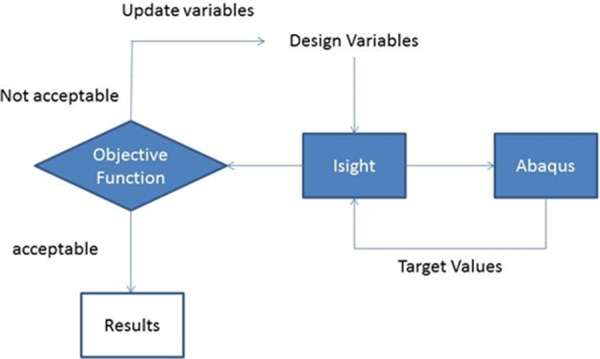
The block diagram of the isight model with abaqus component
2.2.2. Computational Strains.
The calculation of computational strains for the BV model has been described in another paper from our group [13].
The reference configuration at which the model was initialized was assumed to be at the start of filling, when the ventricle cavity is both the smallest and the least loaded. The echo-based strain measurements were most accurate at the endocardium, especially the values in the longitudinal and in the circumferential directions [34,35]. These measurements were obtained as relative strains between two time points in the cardiac cycle and reported as nominal strains (relative changes in length). Since neither of the two time points corresponded to the reference configuration, to obtain the strain values equivalent to experimental strains, a tool had to be developed. The two measuring points in the FE model correspond to the end of diastole (ED) and the point right after the end of ejection, i.e., end systole (ES).
The single LV cavity model was coated with membrane elements that share their nodes with the solid model. These membranes are very thin, such that they do not interfere with the mechanics of the rest of the model. Rather, they are there as strain measuring devices, as they inherit the deformations of the parent surface. The material behavior of these membranes was modeled via an abaqus VUMAT user subroutine, which represents an isotropic hyperelastic material (we have chosen the simplest Neo-Hookean material). The most important aspect of the process is that the deformation gradient is available to the VUMAT user subroutine. Local orientations were defined in cylindrical coordinate systems (spherical for the apex segments) such that deformations would be represented roughly in the circumferential and longitudinal directions.
Consider the start of strain measurement configuration at time to which corresponds a deformation gradient . From that time on, the deformation gradient can be decomposed as , where is the deformation gradient of the relative deformation between the current configuration (ES) and the start configuration (ED). We then compute the relative left Cauchy–Green strain tensor from which we extract the principal values and directions. The principal values being the square of principal relative stretches allow the determination of the principal nominal strains followed by a projection back into the deformed configuration of the global coordinate system. We then have the relative nominal strains in the tangential and longitudinal directions. These strains are carried in the analysis database as state variables (abaqus User Subroutines Reference manual) and can be postprocessed. These computational radial and circumferential strains are defined on the endocardial surface. There were three components of strain but we used the two more accurate components [35].
We wrote scripts to monitor the minimum ventricle volume in order to select the end time-point that produces the frame from which the relative strains are obtained. These strains are integration point values. Therefore, the script averages the relative strain values over each one of the 16 AHA segments (Fig. 4) and feeds such averages to the optimization algorithm for comparison with measurements. The 16 AHA segments are consistent with those used by tomtec software (as described in TomTec-Arena™ 1.1 Operating Manual). It should be noted that the current recommendation from the AHA is to segment the LV into 17 segments, but 16 AHA segments in our paper refers to the TOMTEC convention.
Fig. 4.

The experimental strains were measured at 16 segments in two directions: circumferential and longitudinal
2.2.3. Optimization Scenarios.
The optimization was conducted for either LV or BV model, for either homogeneous or heterogeneous contractility. In all optimization scenarios, the downhill simplex optimization method was used to minimize the differences between the computational and experimental (target) strains [36,37]. The objective function was the sum of the difference between the experimental (target) and computational strains. Since the set of target experimental strains was different in the scenarios, different objective functions were used in each scenario (Table 1). To assess the reliability of the optimization process, in scenarios #3 and #4, the values of Tmax were altered and the optimization was repeated.
Table 1.
Different models were simulated to assess the role of segmental parameters on active material calibration. The passive material properties were also calculated by the material calibration platform (Fig. 2). In scenario 6, the contraction in segments 3–6 was separately determined because the differences between the longitudinal and experimental strains were higher in segments 3–6.
| # | Model | Optimization variable | Optimization target |
|---|---|---|---|
| 1 | LV | One single value of Tmax | ESV |
| 2 | LV | 16 values of Tmax at each AHA segment | 32 strain components at 16 segments, including 16 circumferential and 16 longitudinal strains |
| 3 | LV | 16 values of Tmax at each AHA segment | 16 circumferential strains at 16 AHA segments |
| 4 | LV | 16 values of Tmax at each AHA segment | 16 longitudinal strains at 16 AHA segments |
| 5 | Biventricular | One single value of Tmax | ESV and global longitudinal strain |
| 6 | Biventricular | One single value of Tmax at segments 1, 2, 7–10, 12–16 and segmental values of Tmax at segments 3, 4, 5, 6, 11 (different value at each segment) | 32 strain components at 16 segments, including 16 circumferential and 16 longitudinal strains |
3. Results
3.1. Calibration of Passive Properties for Left Ventricle Model.
Calibration of passive material properties was based on the end-diastolic pressure–volume relationship or EDPVR, and led to the passive properties (Table 2). The optimization scheme provided the EDPVR curve in agreement with the analytical curve (Fig. 2). The mean difference (the sum of the differences between the experimental and computational results at the points shown in Fig. 2 divided by the number of points) between the analytical and experimental LV volumes was approximately −0.04 ml. The computational and experimental LV EDVs were 57.1 and 57.8 ml, respectively (computational EDV 1.2% lower).
Table 2.
The material properties for LV (#2) and BV (#6) models with highest heterogeneous regional contraction (Tmax). For the LV model (model #2 in Table 1), Tmax values at regions 1–16 were 36.2, 345.3, 175.5, 108.3, 71.7, 90.4, 41, 177.1, 680.4, 46.1, 60.9, 55.1, 23.6, 426.9, 37.2, and 31.5 kPa. For the BV mode (model #6 in Table 1), Tmax values at regions 1–16 were 113.0, 113.0, 400.0, 400.0, 400.0, 400.0, 113.0, 113.0, 113.0, 113.0, 280.0, 113.0, 113.0, 113.0, 113.0, and 113.0 kPa. The results from a previous report are provided for comparison. For models 2 and 3, the regional contractions were calculated in a way similar to model 1.
| Parameters | |||||||||
|---|---|---|---|---|---|---|---|---|---|
| Model | MPa | MPa | , MPa | MPa | MPa | ||||
| 1 | 5.913 × 10⁻⁴ | 7.899 | 1.949 × 10⁻³ | 15.157 | 2.707 × 10⁻⁴ | 13.142 | 1.590 × 10⁻⁴ | 3.235 | 0.075 |
| 2 | 5.913 × 10⁻⁴ | 7.899 | 1.949 × 10⁻³ | 15.157 | 2.707 × 10⁻⁴ | 13.142 | 1.590 × 10⁻⁴ | 3.235 | Caption |
| 3 | 5.913 × 10⁻⁴ | 7.899 | 1.949 × 10⁻³ | 15.157 | 2.707 × 10⁻⁴ | 13.142 | 1.590 × 10⁻⁴ | 3.235 | Caption |
| 4 | 5.913 × 10⁻⁴ | 7.899 | 1.949 × 10⁻³ | 15.157 | 2.707 × 10⁻⁴ | 13.142 | 1.590 × 10⁻⁴ | 3.235 | Caption |
| 5 [13] | 1.704 × 10⁻⁴ | 5.517 | 5.618 × 10⁻⁴ | 10.586 | 7.803 × 10⁻⁵ | 9.179 | 4.584 × 10⁻⁵ | 2.259 | 0.113 |
| 6 | 1.704 × 10⁻⁴ | 5.517 | 5.618 × 10⁻⁴ | 10.586 | 7.803 × 10⁻⁵ | 9.179 | 4.584 × 10⁻⁵ | 2.259 | Caption |
| Dabiri et al. [6] | 6.832 × 10⁻⁴ | 7.541 | 2.252 × 10⁻³ | 14.471 | 3.127 × 10⁻⁴ | 12.548 | 1.837 × 10⁻⁴ | 3.088 | 0.086 |
3.2. Calibration of Active Properties for the Left Ventricle Model.
The experimental circumferential and longitudinal strains for 16 segments changed from segment to segment (Figs. 5 and 6). The two strains had different patterns in basal (segments 1–6), midwall (segments 7–12), and apical (segments 13–16) segments.
Fig. 5.
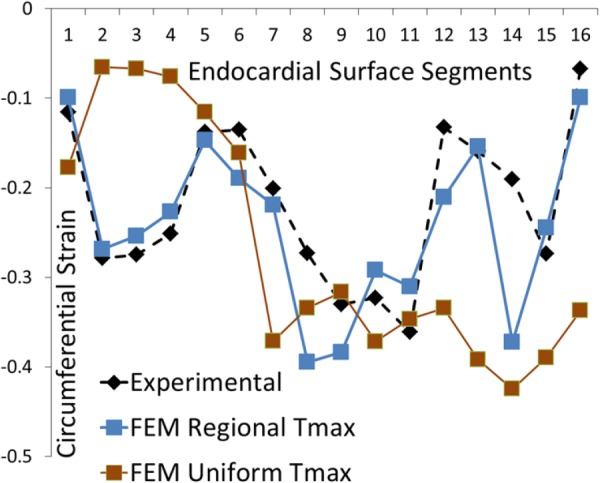
The experimental and computational circumferential strains at 16 AHA segments. The blue curve shows FE model with segmental values for Tmax, whereas the brown curve shows the FE model with uniform Tmax. The direction of strain is shown in Fig. 4.
Fig. 6.
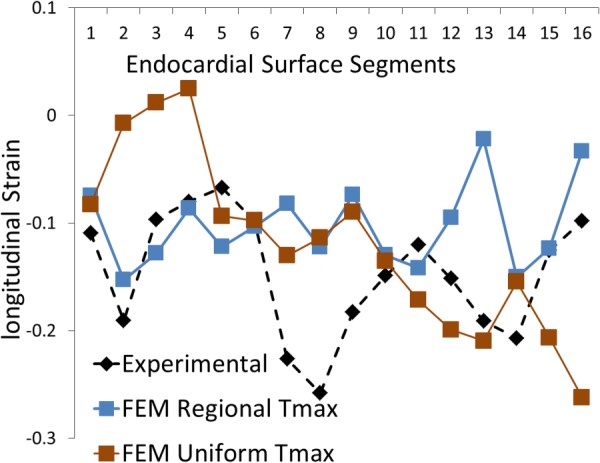
The experimental and computational longitudinal strains at 16 AHA segments. The blue curve shows FE model with segmental values for Tmax, whereas the brown curve shows the FE model with a uniform Tmax. The direction of strain is shown in Fig. 4.
The segmental values for Tmax in 16 segments were altered in the optimization process to calibrate mechanical properties based on segmental strain metrics (Table 2). The difference between the mean Tmax and segmental Tmax values changed for each segment (Fig. 7, Table 2). The largest difference occurred at midwall segment 9, where Tmax (680.4 kPa) was 352.1% larger than the mean Tmax (150.5 kPa) (the sum of Tmax values at all 16 regions divided by number of regions = 150.5 kPa). The computational and experimental circumferential strains were in correspondence; the mean difference between them in 16 segments was 0.046. The largest difference occurred at apical segment, segment 14 (0.182, 295.7% higher relative to the mean value). The computational and experimental longitudinal strains were generally in agreement. The mean difference (the sum of the difference between the computational and experimental strains at target regions divided by number of target regions) between them in 16 segments was 0.059. The maximum difference was at midmyocardium at segment 13 (0.169 and 186.4% higher relative to the mean value).
Fig. 7.
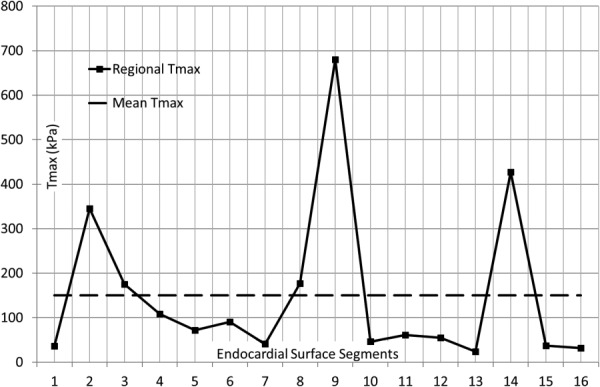
The segmental and mean Tmax in the LV model. In the basal segments, the largest deviation from mean Tmax occurred at segment 2; in the mid LV, the largest deviation from mean Tmax occurred at segment 9. In the apical segments, the largest deviation from mean Tmax occurred at segment 14.
When only circumferential strains were used in the calibration process (Fig. 8), the agreement between the computational and experimental strains was better than when both circumferential and longitudinal strains were used. The mean difference between the computational and experimental strains was 0.040, and the maximum difference occurred at apical segment 14 (0.169 and 323.0% higher relative to the mean value).
Fig. 8.
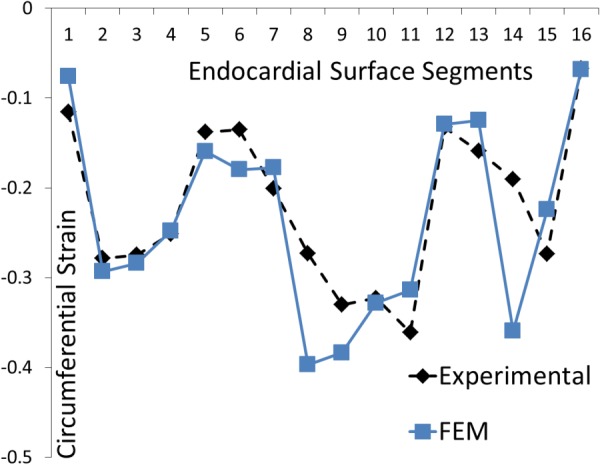
The experimental and computational longitudinal strains at 16 AHA segments. Only 16 circumferential strains were used in the optimization process. The direction of strain is shown in Fig. 4.
Similarly, the agreement between the computational and experimental longitudinal strains improved when only longitudinal strains were used in the calibration process (Fig. 9). The mean difference at 16 segments between the two strains was 0.043, and the maximum difference occurred at midwall segment 8 (0.125 and 190.7% higher relative to the mean value).
Fig. 9.
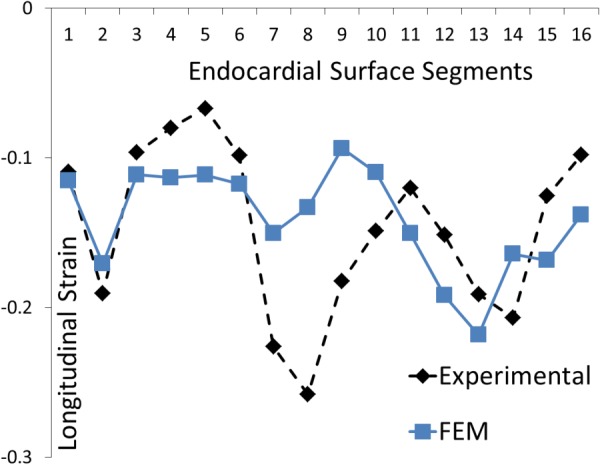
The experimental and computational longitudinal strains at 16 AHA segments. Only 16 longitudinal strains were used in the calibration. The direction of strain is shown in Fig.4.
3.3. Calibration of Active Properties for the Biventricular Model.
The calibration of material properties for the BV model led to converged objective function. The mean and maximum differences between the experimental and computational circumferential strains were 0.061 and 0.120 (segment 9, 100% higher relative to the mean value), respectively. Similarly, the mean and maximum differences between the computational and experimental longitudinal strains were 0.076 and 0.133 (segment 3, 75% higher relative to the mean value), respectively. The agreement between the experimental and computational strains improved after material properties were altered segmentally at segments 3–6 (Table 3, Figs. 10–13).
Table 3.
The mean and maximum difference between the computational and experimental strains for different models described in Table 1
| Model | Mean difference circumferential | Max difference circumferential | Mean difference longitudinal | Max difference longitudinal |
|---|---|---|---|---|
| 1 | 0.129 | 0.270 | 0.076 | 0.183 |
| 2 | 0.046 | 0.182 | 0.059 | 0.169 |
| 3 | 0.040 | 0.169 | N/A | N/A |
| 4 | N/A | N/A | 0.043 | 0.125 |
| 5 | 0.061 | 0.120 | 0.076 | 0.133 |
| 6 | 0.061 | 0.122 | 0.055 | 0.139 |
Fig. 10.
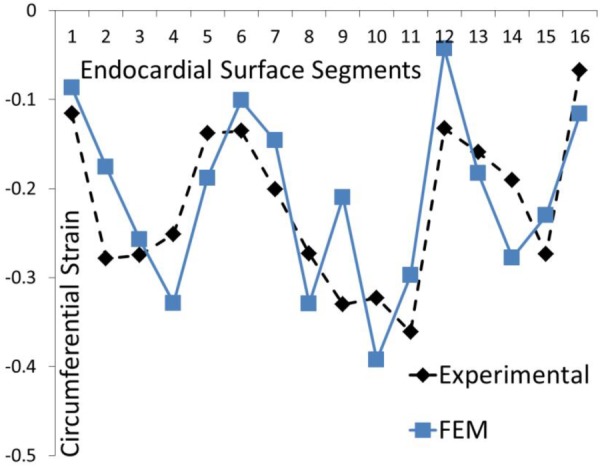
The experimental and computational circumferential strains at 16 AHA segments for the BV model. The parameter Tmax was uniform at all segments. This result is the same as that reported by Sack et al. [13].
Fig. 13.
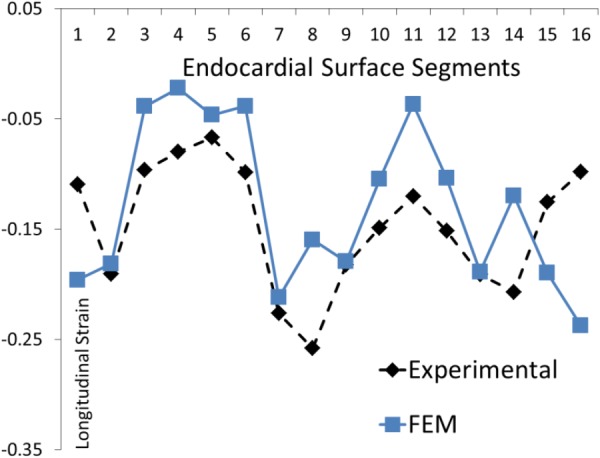
The experimental and computational longitudinal strains at 16 AHA segments for the BV model. The parameter Tmax was altered at segments 3–6.
The differences between the experimental and computational strains were higher when uniform Tmax values were used. The mean differences for the LV model with uniform Tmax were 0.129 and 0.076 for the circumferential and longitudinal strains, respectively (Table 3; Figs. 5 and 6). For the BV model, the mean differences for the circumferential and longitudinal strains were 0.061 and 0.076, respectively, with uniform Tmax (Table 3, Figs. 10 and 11). After segmental Tmax calibration, these differences were 0.046 (LV, circumferential), 0.059 (LV, longitudinal), 0.061 (BV, circumferential), and 0.055 (BV, longitudinal).
Fig. 11.
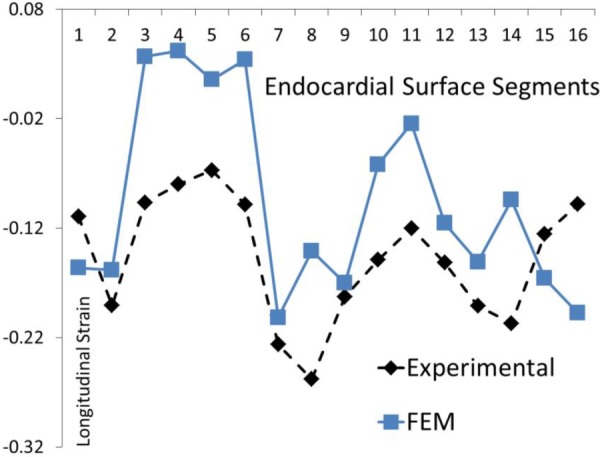
The experimental and computational longitudinal strains at 16 AHA segments for the BV model. The parameter Tmax was uniform at all segments. This result is the same as that reported by Sack et al. [13].
After the segmental values for Tmax for models #2 and 3 were calculated, the starting values for the optimization were changed to ascertain the optimized values that are not those associated with a local minimum. The time to reach convergence was affected by the starting values for the parameters (segmental Tmax), but the calibration results did not change when the starting values were altered.
4. Discussion
In this study, we used LV ED (EDV and EDP) and speckle tracking 3D echocardiography segmental strains from beating hearts to calibrate passive and active mechanical properties of the LV. Our results show that isight can be used as a platform to improve the state-of-the-art calibration of the LV mechanical properties [13]. The calibration results were in line with the previous reports (Table 2, rows 1 and 7). The optimization algorithm was stable because the results did not change by altering starting Tmax values. The selection of segments where strains are measured affects the calibration accuracy. When circumferential and longitudinal strains were both used, the average difference between the predicted and experimental circumferential and longitudinal strains was higher (0.046 and 0.059, respectively) than when only circumferential (0.040) or longitudinal (0.043) strains were used (Table 3). The LV volume in our calibrated model was close to the experimental value. Although we did not use end systolic volume (ESV) as a calibration criterion, the predicted and experimental ESVs were close (29.9 versus 30.9 ml).
4.1. Rationale for Using abaqus and isight.
In a previous study, ls-dyna and ls-opt (Livermore Software Technology Corporation, Livermore, CA) were used to calibrate material properties of LV based on segmental strain metrics [4]. Here, we used abaqus and isight for the same purpose. This study extends the work seen in our previous study [4], by utilizing more sophisticated methods, incorporating more modern strain tracking information, advanced cardiac modelling techniques (i.e., FE and coupled lumped circulatory models) and sophisticated models (i.e., realistic fiber orientations and biventricular modelling).
4.2. Global Versus Segmental Calibration Metrics.
The calibration of the mechanical properties of myocardium can be based on global or segmental metrics. From a mathematical perspective, using global metrics is more straightforward than using segmental metrics. Here, we used 16 circumferential and 16 longitudinal strains at 16 AHA segments to calibrate the myocardium. The convergence of the objective function took longer than when we used global metrics, or when we used 16 circumferential or 16 longitudinal strains. These findings indicate that the selection of calibration parameters plays a key role in an efficient calibration process.
The optimization platform presented here was used to improve the state-of-the-art calibration process [13]. Our results showed that the agreement between the computational strains and the experimental strains improved after segmental variations in mechanical properties were implemented (Table 3, Figs. 12 and 13). The mean differences for the circumferential strains were reduced in the LV model (0.129 versus 0.046) and were nearly unchanged for the BV models (0.061 versus 0.061). Similarly, mean differences between experimental longitudinal strains decreased in the LV model (0.076 versus 0.059) and the BV model (0.076 versus 0.055).
Fig. 12.
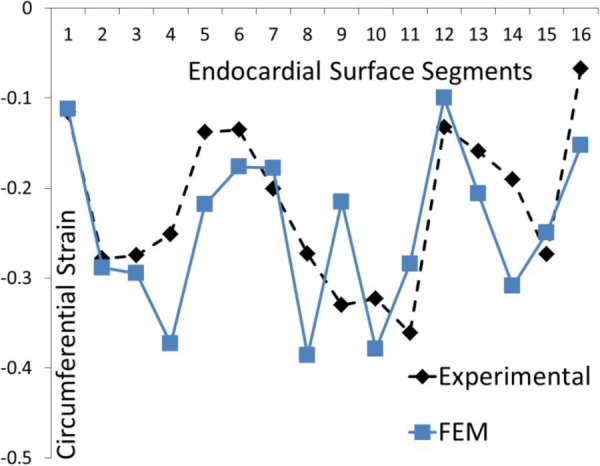
The experimental and computational circumferential strains at 16 AHA segments for the BV model. The parameter Tmax was altered at segments 3–6.
4.3. Rationale for Segmental Variation of Tmax in the Left Ventricle Model.
The rationale behind segmental variations in values of Tmax could be limitations in geometry, fiber directions, and constitutive equations. Our results demonstrate the importance of muscle fiber orientation in the mechanics of LV. The single LV and BV models produced results that were in agreement with experimental data. However, the BV model used a simpler approach for calibration of mechanical properties than the single LV model, and had a more realistic geometry and fiber direction. Also, the reference configuration between the LV and the BV was different because of differences in fiber orientations, geometries, loads, and boundary conditions. This reference configuration difference also makes the BV model more realistic compared to the LV model. We suspect that if, for the single LV model, the LV geometry is reconstructed from MRI and it includes the diffusion tensor magnetic resonance imaging fiber data, the results will be closer to those of the BV model.
The values of Tmax at 16 segments deviated from mean value of Tmax (Fig. 7). Within the basal segments (1–6), the largest difference between the mean Tmax and the segmental Tmax happened at segment 2. Within the midwall segments (7–12), the largest difference was at segment 9, and within apical segments (13–16), the largest difference was at segment 14. It seems that at these segments (2, 9, and 14) larger errors happen in geometry approximation and fiber orientations in the LV model. It should be noted that the scenarios presented here for LV are complicated as we considered all 16 AHA segments. If a smaller number of LV regions are considered for calibration, the optimization will be faster, and the computational results will be closer to target strains (in calibrated regions).
4.4. Model Reconstruction From Echocardiography Versus Magnetic Resonance Imaging.
In this study, we did material calibration based on two types of imaging methods. The BV model was based on ex vivo MRI data, whereas the LV model was created from in vivo echocardiography data. The accuracy of the geometry and fiber orientation obtained from MRI was better than that from echocardiography data. However, processing MRI data needs more manual work and is more challenging than processing echocardiography images. Nevertheless, the LV model created from echocardiography images can provide rough information about the material properties of the LV. Although for an accurate material calibration, MRI is more suitable, echocardiography can be used to assess alterations in material properties (not to determine exact values of the material constants). In particular, for applications related to effectiveness of treatment strategies for HF, echocardiography may be a better choice because it is less challenging to analyze and can be used for patients who use cardiac implants such as devices (LVAD) and stents.
4.5. Clinical Translation.
Our methodology could have applications in monitoring the recovery of myocardium contractility in patients with HF after treatment with cardiac devices such as LVADs. Although the calibration time was relatively long (on order of 24 h for LV and on order of 14 days for BV model), when linked to machine learning techniques, the material calibration could be achieved on the order of seconds. There are machine-learning finite element studies that successfully applied time-consuming computations into fast applied outcomes [38] that could be used in a clinical setup. In this project, we used echocardiography imaging data. As noted above, unlike tagged MRI, speckle tracking echocardiography can be used for patients with LVADs, stents, or other cardiac implants. Also, echocardiography data can be automated by software, whereas tagged MRI requires more manual operations. There are echocardiography-based handheld devices that can be used by physicians to monitor cardiac conditions [39]. We plan to implement machine learning algorithms that use our calibration methodology in a hand-held device that could be used by physicians. Such a device can be used to find information about the health conditions of the heart in a more convenient, less expensive, and faster way than echo and MRI machines. Moreover, if required, the methodology presented in this paper works for MRI-based strain measurements.
4.6. Model Limitations.
Some of the differences between the model-predicted strains and the experimental strains were noticeably large (Table 3). The calibration of mechanical properties depends on several factors including Tmax, ns, and fiber orientation. The fiber orientation could be approximated from diffusion tensor magnetic resonance imaging data, and ns is mostly related to physiological data from cardiac muscle multiaxial stretching data [33]. That is why in this work, we used Tmax in 16 segments to calibrate the model. Another parameter that has a profound role in the calibration process is variations of muscle contraction in the transmural direction, which was not considered in this study. In fact, a more realistic modeling approach would consider the electrical activity and link it to the transmural variation in the onset of muscle contraction and relaxation. Moreover, atrial contraction which was not considered in this study could noticeably affect the model-predicted strains.
The constitutive equations play a crucial role in calibration of the mechanical properties. In the LV model, we assumed that the parameters of active contraction in the longitudinal and circumferential directions are only determined by fiber directions. The segmental strains vary from segment to segment, but the trend in the strain from segment to segment is different for the longitudinal and circumferential directions (Figs. 5 and 6). This observation suggests that the muscle fiber activation is likely affected by other tissue characteristics, which cause different strain patterns in the circumferential and longitudinal directions. If the constitutive equation includes parameters that reflect these different trends in the circumferential and longitudinal strains, the calibration will be improved noticeably.
The discrepancies in experimental and computational strains in the LV model could be partly due to not taking into account the right ventricle (RV) pressure on the epicardial surface of the LV septum. A more realistic model would have a different transmural pressure for the LV septum that is less than that for the LV free wall (to take into account RV pressure).
5. Conclusions and Future Directions
A noninvasive solution to determine mechanical properties of myocardium may serve as a diagnostic or treatment tool for HF. The properties of myocardium change in the infarcted region. Moreover, stress, which may be the stimulus for remodeling in pathological conditions like HF, can be determined if mechanical properties are known. This study presented a methodology to determine mechanical properties of myocardium in beating hearts using isight. This methodology may lead to more accurate mechanical properties as it is based on segmental metrics (such as strains), rather than global metrics such as ESV and longitudinal strain. Our methodology could be implemented in assessing the effects of other parameters on the calibration outcome. For example, the distal boundary conditions representing circulation, the effects of RV on LV, the effects of errors introduced during reconstruction of geometry, and other modeling parameters could be studied using the methodology introduced in this paper.
Acknowledgment
We thank Pamela Derish in the Department of Surgery, University of California San Francisco, for assistance with proofreading the manuscript. We wish to especially thank Professor Yuan-Cheng Fung for his mentorship. Dr. Guccione and Dr. Kassab were his graduate students at UC San Diego in the late 1980s. The method used in this study is closely aligned with the method of approach described in the introductory chapter of Dr. Fung's classic monograph Biomechanics: Mechanical Properties of Living Tissues.
Contributor Information
Yaghoub Dabiri, Department of Surgery, University of California San Francisco, , San Francisco, CA 94121; , California Medical Innovations Institute, , 11107 Roselle Street Suite 211, , San Diego, CA 92121 , e-mail: ydabiri@gmail.com.
Kevin L. Sack, Department of Surgery, University of California San Francisco, , San Francisco, CA 94121; Division of Biomedical Engineering, Department of Human Biology, , University of Cape Town, , Cape Town 7925, South Africa , e-mail: kevin.sack@uct.ac.za
Nuno Rebelo, Mem. ASME , Nuno Rebelo Associates LLC, , 46709 Rancho Higuera Road, , Fremont, CA 94539 , e-mail: nuno@vjsantos.com.
Peter Wang, Dassault Systemes, , Simulia Corp., , 1301 Atwood Avenue, , Suite 101W, , Johnston, RI 02919; 3979 Freedom Circle, Suite 750, , Santa Clara, CA 95054 , e-mail: peter.wang@3ds.com.
Yunjie Wang, Thornton Tomasetti, , 19200 Stevens Creek Blvd, Suite 100, , Cupertino, CA 95014 , e-mail: swang@thorntontomasetti.com.
Jenny S. Choy, Department of Biomedical Engineering, , California Medical Innovations Institute, , 11107 Roselle Street Suite 201, , San Diego, CA 92121 , e-mail: jschoy@calmi2.org
Ghassan S. Kassab, Department of Biomedical Engineering, , California Medical Innovations Institute, , 11107 Roselle Street Suite 211, , San Diego, CA 92121 , e-mail: gkassab@calmi2.org
Julius M. Guccione, Department of Surgery, , University of California San Francisco, , 4150 Clement Street, , San Francisco, CA 94121 , e-mail: julius.guccione@ucsf.edu
Funding Data
This work was supported by NIH (Grant Nos. R01-HL-077921, R01-HL-118627, and U01-HL-119578; Funder ID: 10.13039/100000002).
Nomenclature
- and =
isotropic stiffness material parameters
- AHA =
American Heart Association
- =
a constant
- =
the relative left Cauchy–Green strain tensor
- =
the right Cauchy–Green tensor
- =
the peak intracellular calcium concentration
- =
the maximum intracellular calcium concentration
- =
2/bulk modulus
- =
the Lagrangian strain in the myofiber direction
- EDP =
end diastolic pressure
- EDPVR =
end diastolic pressure volume relation
- ESV =
end systolic volume
- =
the deformation gradient
- =
the deformation gradient of the relative deformation between the current configuration and the start configuration
- =
the deformation gradient at start of strain measurement
- and =
vectors for the local myofiber and sheet directions, respectively
- HF =
heart failure
- , and =
the invariants of
- =
determinant of the deformation gradient
- =
the sarcomere length with the stress-free condition
- =
the sarcomere length with no active stress
- LV =
left ventricle
- LVAD =
left ventricle assistive device
- =
used to partially transfer fiber stress to the sheet
- subscripts , , and =
material parameters associated with additional stiffness in the myofiber direction, sheet direction, and the connection between the myofiber and sheet directions
- =
the isometric tension at the longest sarcomere length and highest calcium concentration
- =
time to arrive at peak tension
- =
the principal relative stretch
References
- [1]. Mensah, G. A. , and Brown, D. W. , 2007, “ An Overview of Cardiovascular Disease Burden in the United States,” Health Aff., 26(1), pp. 38–48. 10.1377/hlthaff.26.1.38 [DOI] [PubMed] [Google Scholar]
- [2]. Benjamin, E. J. , Muntner, P. , Alonso, A. , Bittencourt, M. S. , Callaway, C. W. , Carson, A. P. , Chamberlain, A. M. , Chang, A. R. , Cheng, S. , Das, S. R. , Delling, F. N. , Djousse, L. , Elkind, M. S. V. , Ferguson, J. F. , Fornage, M. , Jordan, L. C. , Khan, S. S. , Kissela, B. M. , Knutson, K. L. , Kwan, T. W. , Lackland, D. T. , Lewis, T. T. , Lichtman, J. H. , Longenecker, C. T. , Loop, M. S. , Lutsey, P. L. , Martin, S. S. , Matsushita, K. , Moran, A. E. , Mussolino, M. E. , O'Flaherty, M. , Pandey, A. , Perak, A. M. , Rosamond, W. D. , Roth, G. A. , Sampson, U. K. A. , Satou, G. M. , Schroeder, E. B. , Shah, S. H. , Spartano, N. L. , Stokes, A. , Tirschwell, D. L. , Tsao, C. W. , Turakhia, M. P. , VanWagner, L. B. , Wilkins, J. T. , Wong, S. S. , and Virani, S. S. , 2019, “ American Heart Association Council on Epidemiology and Prevention Statistics Committee and Stroke Statistics Subcommittee, Heart Disease and Stroke Statistics—2019 Update: A Report From the American Heart Association,” Circulation, 139(10), pp. e56–e528. 10.1161/CIR.0000000000000659 [DOI] [PubMed] [Google Scholar]
- [3]. Heidenreich, P. A. , Albert, N. M. , Allen, L. A. , Bluemke, D. A. , Butler, J. , Fonarow, G. C. , Ikonomidis, J. S. , Khavjou, O. , Konstam, M. A. , Maddox, T. M. , Nichol, G. , Pham, M. , Piña, I. L. , and Trogdon, J. G. , 2013, “ American Heart Association Advocacy Coordinating Committee, Council on Arteriosclerosis, Thrombosis and Vascular Biology, Council on Cardiovascular Radiology and Intervention, Council on Clinical Cardiology, Council on Epidemiology and Prevention, Stroke Council, Forecasting the Impact of Heart Failure in the United States,” Circ.: Heart Failure, 6, pp. 606–619. 10.1161/HHF.0b013e318291329a [DOI] [PMC free article] [PubMed] [Google Scholar]
- [4]. Sun, K. , Stander, N. , Jhun, C.-S. , Zhang, Z. , Suzuki, T. , Wang, G.-Y. , Saeed, M. , Wallace, A. W. , Tseng, E. E. , Baker, A. J. , Saloner, D. , Einstein, D. R. , Ratcliffe, M. B. , and Guccione, J. M. , 2009, “ A Computationally Efficient Formal Optimization of Regional Myocardial Contractility in a Sheep With Left Ventricular Aneurysm,” ASME J. Biomech. Eng., 131(11), p. 111001. 10.1115/1.3148464 [DOI] [PMC free article] [PubMed] [Google Scholar]
- [5]. Wenk, J. F. , Klepach, D. , Lee, L. C. , Zhang, Z. , Ge, L. , Tseng, E. E. , Martin, A. , Kozerke, S. , Gorman, J. H. , Gorman, R. C. , and Guccione, J. M. , 2012, “ First Evidence of Depressed Contractility in the Border Zone of a Human Myocardial Infarction,” Ann. Thorac. Surg., 93(4), pp. 1188–1193. 10.1016/j.athoracsur.2011.12.066 [DOI] [PMC free article] [PubMed] [Google Scholar]
- [6]. Dabiri, Y. , Sack, K. L. , Shaul, S. , Sengupta, P. P. , and Guccione, J. M. , 2018, “ Relationship of Transmural Variations in Myofiber Contractility to Left Ventricular Ejection Fraction: Implications for Modeling Heart Failure Phenotype With Preserved Ejection Fraction,” Front. Physiol., 9, p. 1003. 10.3389/fphys.2018.01003 [DOI] [PMC free article] [PubMed] [Google Scholar]
- [7]. Yin, F. C. , 1981, “ Ventricular Wall Stress,” Circ. Res., 49(4), pp. 829–42 10.1161/01.RES.49.4.829. [DOI] [PubMed] [Google Scholar]
- [8]. Jan, K. M. , 1985, “ Distribution of Myocardial Stress and Its Influence on Coronary Blood Flow,” J. Biomech., 18(11), pp. 815–20. 10.1016/0021-9290(85)90478-6 [DOI] [PubMed] [Google Scholar]
- [9]. Sarnoff, S. J. , Braunwald, E. , Welch, G. H. , Case, R. B. , Stainsby, W. N. , and Macruz, R. , 1957, “ Hemodynamic Determinants of Oxygen Consumption of the Heart With Special Reference to the Tension-Time Index,” Am. J. Physiol., 192(1), pp. 148–156. 10.1152/ajplegacy.1957.192.1.148 [DOI] [PubMed] [Google Scholar]
- [10]. Grossman, W. , 1980, “ Cardiac Hypertrophy: Useful Adaptation or Pathologic Process?,” Am. J. Med., 69(4), pp. 576–584. 10.1016/0002-9343(80)90471-4 [DOI] [PubMed] [Google Scholar]
- [11]. Huisman, R. M. , Elzinga, G. , Westerhof, N. , and Sipkema, P. , 1980, “ Measurement of Left Ventricular Wall Stress,” Cardiovasc. Res., 14(3), pp. 142–153. 10.1093/cvr/14.3.142 [DOI] [PubMed] [Google Scholar]
- [12]. Rahe-Meyer, N. , Weilbach, C. , Karst, M. , Pawlak, M. , Ahmed, A. , Piepenbrock, S. , and Winterhalter, M. , 2007, “ In Vivo Myograph Measurement of Muscle Contraction at Optimal Length,” Biomed. Eng. Online, 6(1), p. 1. 10.1186/1475-925X-6-1 [DOI] [PMC free article] [PubMed] [Google Scholar]
- [13]. Sack, K. L. , Aliotta, E. , Ennis, D. B. , Choy, J. S. , Kassab, G. S. , Guccione, J. M. , and Franz, T. , 2018, “ Construction and Validation of Subject-Specific Biventricular Finite-Element Models of Healthy and Failing Swine Hearts From High-Resolution DT-MRI,” Front. Physiol., 9, p. 539. 10.3389/fphys.2018.00539 [DOI] [PMC free article] [PubMed] [Google Scholar]
- [14]. Baillargeon, B. , Rebelo, N. , Fox, D. D. , Taylor, R. L. , and Kuhl, E. , 2014, “ The Living Heart Project: A Robust and Integrative Simulator for Human Heart Function,” Eur. J. Mech. A/Solids, 48, pp. 38–47. 10.1016/j.euromechsol.2014.04.001 [DOI] [PMC free article] [PubMed] [Google Scholar]
- [15]. Sack, K. L. , Baillargeon, B. , Acevedo-Bolton, G. , Genet, M. , Rebelo, N. , Kuhl, E. , Klein, L. , Weiselthaler, G. M. , Burkhoff, D. , Franz, T. , and Guccione, J. M. , 2016, “ Partial LVAD Restores Ventricular Outputs and Normalizes LV but Not RV Stress Distributions in the Acutely Failing Heart in Silico,” Int. J. Artif. Organs., 39(8), pp. 421–430. 10.5301/ijao.5000520 [DOI] [PMC free article] [PubMed] [Google Scholar]
- [16]. Baillargeon, B. , Costa, I. , Leach, J. R. , Lee, L. C. , Genet, M. , Toutain, A. , Wenk, J. F. , Rausch, M. K. , Rebelo, N. , Acevedo-Bolton, G. , Kuhl, E. , Navia, J. L. , and Guccione, J. M. , 2015, “ Human Cardiac Function Simulator for the Optimal Design of a Novel Annuloplasty Ring With a Sub-Valvular Element for Correction of Ischemic Mitral Regurgitation,” Cardiovasc. Eng. Technol., 6(2), pp. 105–116. 10.1007/s13239-015-0216-z [DOI] [PMC free article] [PubMed] [Google Scholar]
- [17]. Wohlschlaeger, J. , Schmitz, K. , Schmid, C. , Schmid, K. , Keul, P. , Takeda, A. , Weis, S. , Levkau, B. , and Baba, H. , 2005, “ Reverse Remodeling Following Insertion of Left Ventricular Assist Devices (LVAD): a Review of the Morphological and Molecular Changes,” Cardiovasc. Res., 68 (3), pp. 376–386. 10.1016/j.cardiores.2005.06.030 [DOI] [PubMed] [Google Scholar]
- [18]. Birks, E. J. , Tansley, P. D. , Hardy, J. , George, R. S. , Bowles, C. T. , Burke, M. , Banner, N. R. , Khaghani, A. , and Yacoub, M. H. , 2006, “ Left Ventricular Assist Device and Drug Therapy for the Reversal of Heart Failure,” N. Engl. J. Med., 355(18), pp. 1873–1884. 10.1056/NEJMoa053063 [DOI] [PubMed] [Google Scholar]
- [19]. Burkhoff, D. , Klotz, S. , and Mancini, D. M. , 2006, “ LVAD-Induced Reverse Remodeling: Basic and Clinical Implications for Myocardial Recovery,” J. Card. Failure, 12(3), pp. 227–239. 10.1016/j.cardfail.2005.10.012 [DOI] [PubMed] [Google Scholar]
- [20]. Choy, J. S. , Leng, S. , Acevedo-Bolton, G. , Shaul, S. , Fu, L. , Guo, X. , Zhong, L. , Guccione, J. M. , and Kassab, G. S. , 2018, “ Efficacy of Intramyocardial Injection of Algisyl-LVR for the Treatment of Ischemic Heart Failure in Swine,” Int. J. Cardiol., 255, pp. 129–135. 10.1016/j.ijcard.2017.09.179 [DOI] [PMC free article] [PubMed] [Google Scholar]
- [21]. Westerhof, N. , Lankhaar, J.-W. , and Westerhof, B. E. , 2009, “ The Arterial Windkessel,” Med. Biol. Eng. Comput., 47(2), pp. 131–141. 10.1007/s11517-008-0359-2 [DOI] [PubMed] [Google Scholar]
- [22]. Aguado-Sierra, J. , Krishnamurthy, A. , Villongco, C. , Chuang, J. , Howard, E. , Gonzales, M. J. , Omens, J. , Krummen, D. E. , Narayan, S. , Kerckhoffs, R. C. P. , and McCulloch, A. D. , 2011, “ Patient-Specific Modeling of Dyssynchronous Heart Failure: A Case Study,” Prog. Biophys. Mol. Biol., 107(1), pp. 147–155. 10.1016/j.pbiomolbio.2011.06.014 [DOI] [PMC free article] [PubMed] [Google Scholar]
- [23]. Holzapfel, G. A. , and Ogden, R. W. , 2009, “ Constitutive Modelling of Passive Myocardium: A Structurally Based Framework for Material Characterization,” Philos. Trans. A. Math. Phys. Eng. Sci., 367(1902), pp. 3445–3475. 10.1098/rsta.2009.0091 [DOI] [PubMed] [Google Scholar]
- [24]. Göktepe, S. , Acharya, S. N. S. , Wong, J. , and Kuhl, E. , 2011, “ Computational Modeling of Passive Myocardium,” Int. J. Numer. Method. Biomed. Eng., 27(1), pp. 1–12. 10.1002/cnm.1402 [DOI] [Google Scholar]
- [25]. Streeter, D. D. , Spotnitz, H. M. , Patel, D. P. , Ross, J. , and Sonnenblick, E. H. , 1969, “ Fiber Orientation in the Canine Left Ventricle During Diastole and Systole,” Circ. Res., 24(3), pp. 339–347. 10.1161/01.RES.24.3.339 [DOI] [PubMed] [Google Scholar]
- [26]. Genet, M. , Lee, L. C. , Nguyen, R. , Haraldsson, H. , Acevedo-Bolton, G. , Zhang, Z. , Ge, L. , Ordovas, K. , Kozerke, S. , and Guccione, J. M. , 2014, “ Distribution of Normal Human Left Ventricular Myofiber Stress at End Diastole and End Systole: A Target for in Silico Design of Heart Failure Treatments,” J. Appl. Physiol., 117(2), pp. 142–152. 10.1152/japplphysiol.00255.2014 [DOI] [PMC free article] [PubMed] [Google Scholar]
- [27]. Legrice, I. , Hunter, P. , Young, A. , and Smaill, B. , 2001, “ The Architecture of the Heart: A Data-Based Model,” Philos. Trans. R. Soc., A, 359(1783), pp. 1217–1232. 10.1098/rsta.2001.0827 [DOI] [Google Scholar]
- [28]. Chen, J. , Liu, W. , Zhang, H. , Lacy, L. , Yang, X. , Song, S.-K. , Wickline, S. A. , and Yu, X. , 2005, “ Regional Ventricular Wall Thickening Reflects Changes in Cardiac Fiber and Sheet Structure During Contraction: Quantification With Diffusion Tensor MRI,” Am. J. Physiol. Circ. Physiol., 289(5), pp. H1898–H1907. 10.1152/ajpheart.00041.2005 [DOI] [PubMed] [Google Scholar]
- [29]. Bovendeerd, P. H. , Huyghe, J. M. , Arts, T. , van Campen, D. H. , and Reneman, R. S. , 1994, “ Influence of Endocardial-Epicardial Crossover of Muscle Fibers on Left Ventricular Wall Mechanics,” J. Biomech., 27(7), pp. 941–951. 10.1016/0021-9290(94)90266-6 [DOI] [PubMed] [Google Scholar]
- [30]. Klotz, S. , Hay, I. , Dickstein, M. L. , Yi, G.-H. , Wang, J. , Maurer, M. S. , Kass, D. A. , and Burkhoff, D. , 2006, “ Single-Beat Estimation of End-Diastolic Pressure-Volume Relationship: A Novel Method With Potential for Noninvasive Application,” Am. J. Physiol. Circ. Physiol., 291(1), pp. H403–H412. 10.1152/ajpheart.01240.2005 [DOI] [PubMed] [Google Scholar]
- [31]. Guccione, J. M. , McCulloch, A. D. , and Waldman, L. K. , 1991, “ Passive Material Properties of Intact Ventricular Myocardium Determined From a Cylindrical Model,” ASME J. Biomech. Eng., 113(1), pp. 42–55. 10.1115/1.2894084 [DOI] [PubMed] [Google Scholar]
- [32]. Wall, S. T. , Walker, J. C. , Healy, K. E. , Ratcliffe, M. B. , and Guccione, J. M. , 2006, “ Theoretical Impact of the Injection of Material Into the Myocardium: A Finite Element Model Simulation,” Circulation, 114(24), pp. 2627–2635. 10.1161/CIRCULATIONAHA.106.657270 [DOI] [PubMed] [Google Scholar]
- [33]. Lin, D. H. , and Yin, F. C. , 1998, “ A Multiaxial Constitutive Law for Mammalian Left Ventricular Myocardium in Steady-State Barium Contracture or Tetanus,” ASME J. Biomech. Eng., 120(4), pp. 504–517. 10.1115/1.2798021 [DOI] [PubMed] [Google Scholar]
- [34]. Seo, Y. , Ishizu, T. , Enomoto, Y. , Sugimori, H. , Yamamoto, M. , Machino, T. , Kawamura, R. , and Aonuma, K. , 2009, “ Validation of 3-Dimensional Speckle Tracking Imaging to Quantify Regional Myocardial Deformation,” Circ. Cardiovasc. Imaging, 2(6), pp. 451–459. 10.1161/CIRCIMAGING.109.858480 [DOI] [PubMed] [Google Scholar]
- [35]. Seo, Y. , Ishizu, T. , Enomoto, Y. , Sugimori, H. , and Aonuma, K. , 2011, “ Endocardial Surface Area Tracking for Assessment of Regional LV Wall Deformation With 3D Speckle Tracking Imaging,” JACC Cardiovasc. Imaging, 4(4), pp. 358–365. 10.1016/j.jcmg.2010.12.007 [DOI] [PubMed] [Google Scholar]
- [36]. Nelder, J. A. , and Mead, R. , 1965, “ A Simplex Method for Function Minimization,” Comput. J., 7(4), pp. 308–313. 10.1093/comjnl/7.4.308 [DOI] [Google Scholar]
- [37]. Van der Velden, A. , 2018, “ High-Fidelity Simulation Surrogate Models for Systems Engineering,” Disciplinary Convergence in Systems Engineering Research, Springer International Publishing, Cham, Switzerland, pp. 327–339. [Google Scholar]
- [38]. Liang, L. , Liu, M. , Martin, C. , and Sun, W. , 2018, “ A Deep Learning Approach to Estimate Stress Distribution: A Fast and Accurate Surrogate of Finite-Element Analysis,” J. R. Soc. Interface, 15(138), p. 20170844. 10.1098/rsif.2017.0844 [DOI] [PMC free article] [PubMed] [Google Scholar]
- [39]. Chamsi-Pasha, M. A. , Sengupta, P. P. , and Zoghbi, W. A. , 2017, “ Handheld Echocardiography,” Circulation, 136(22), pp. 2178–2188. 10.1161/CIRCULATIONAHA.117.026622 [DOI] [PubMed] [Google Scholar]


