

Abstract
Synapse loss occurs normally during development and pathologically during neurodegenerative disease. Long-term depression, a proposed physiological correlate of synapse elimination, requires caspase-3 and the mitochondrial pathway of apoptosis. Here, we show that caspase-3 activity is essential—and can act locally within neurons—for regulation of spine density and dendrite morphology. By photostimulation of Mito-KillerRed, we induced caspase-3 activity in defined dendritic regions of cultured neurons. Within the photostimulated region, local elimination of dendritic spines and dendrite retraction occurred in a caspase-3-dependent manner without inducing cell death. However, pharmacological inhibition of inhibitor of apoptosis proteins or proteasome function led to neuronal death, suggesting that caspase activation is spatially restricted by these “molecular brakes” on apoptosis. Caspase-3 knock-out mice have increased spine density and altered miniature EPSCs, confirming a physiological involvement of caspase-3 in the regulation of spines in vivo.
Keywords: caspase-3, dendrite retraction, IAP, nonapoptotic, proteasome, spine elimination
Introduction
Activity-dependent remodeling of synapses is vital for multiple brain functions including learning and memory. Although pruning of excess synapses is a critical process for normal development of the nervous system, synapse loss has also emerged as a central pathology in neurodegenerative diseases (Selkoe, 2002; Stevens et al., 2007). However, the mechanisms leading to spine elimination remain poorly understood.
Apoptosis-programmed cell death removes unwanted cells during development (Kerr et al., 1972) and eliminates damaged or unhealthy cells in aging and disease (Fuchs and Steller, 2011). Apoptosis is orchestrated by a family of cysteine-aspartate proteases termed caspases (Alnemri et al., 1996). Activation of caspase-3, an executioner caspase that lies downstream of both extrinsic and intrinsic (mitochondrial) pathways of apoptosis, plays a central role in programmed cell death of many cell types, including neurons (Fuchs and Steller, 2011). Recent studies, however, have established that the molecular mechanisms of apoptosis, including caspases, are also involved in nonapoptotic functions (Hyman and Yuan, 2012).
Components of the mitochondrial pathway of apoptosis, including BAX/BAK and caspase-3, are necessary for NMDA-receptor-dependent long-term depression (LTD) and AMPA receptor internalization (Li et al., 2010; Jiao and Li, 2011). LTD is associated with spine shrinkage and elimination (Nägerl et al., 2004; Zhou et al., 2004) and likely represents a physiological correlate of synapse elimination. Moreover, acute NMDA receptor activation is correlated with transient and modest activation of caspase-3 in dendrites (Li et al., 2010; Jiao and Li, 2011). Such findings suggest that caspase-3 can have a localized effect on the modification of synapses and spines in the absence of cell death. This concept also implies the existence of mechanisms that limit the activity of caspase-3 and prevent complete destruction of the cell.
Until now, there has been no direct demonstration that local activation of caspase-3 can alter synapse function and morphology without causing apoptosis. Previous studies have used genetic or pharmacologic manipulations to investigate the functions of caspases in neurons and synapses but, by their nature, such approaches cannot address local actions of caspases within specific neuronal compartments or longitudinally follow the changes in the same neuron after caspase activation.
Using an optogenetic approach (Mito-KillerRed photostimulation), we demonstrate here that caspase-3 can be activated within the neuronal cell body to induce neuronal death or locally within distal dendritic branches to “sculpt” spines and dendrites in the absence of cell death. Local activation of the mitochondrial apoptosis pathway in dendrites is sufficient to cause elimination of spines and dendrite branches that are localized in the vicinity of Mito-KillerRed photostimulation in a manner dependent on caspase-3 activation. We present evidence that the restriction of caspase-3 activation to the region of photostimulation—and hence protection against cell death—is mediated by the action of proteasomes and the inhibitor of apoptosis proteins (IAPs). Caspase-3-deficient neurons in culture fail to show spine shrinkage in response to NMDA stimulation (chemical LTD). Finally, we show that caspase-3 knock-out (KO) mice have increased spine density and synaptic strength, which is consistent with an essential role of caspase-3 in spine elimination in vivo.
Materials and Methods
Animals and neuron culture.
Rat hippocampal neuronal cultures were prepared from embryonic day 18 (E18) embryos of Sprague Dawley rats. Mouse hippocampal neuronal cultures were prepared from E17 embryos from caspase-3 KO and wild-type littermate mice in a C57BL/6 background (Kuida et al., 1996; Leonard et al., 2002) obtained under license from R. Flavell (Yale University). The experiments with caspase-3 KO neurons and related controls were performed in mouse hippocampal cultures and all other experiments were performed using rat hippocampal cultures. We observed no survival difference in the results of Mito-KillerRed experiments conducted in mouse or rat hippocampal cultures. Neuronal morphology and spines in the cortex and hippocampus were measured by imaging GFP-expressing neurons obtained from a cross between the GFP-M line (Feng et al., 2000) and caspase-3 KO mice (of either sex) with the observer blinded to the caspase-3 genotype. This cross allowed us to visualize and quantify neuronal and spine morphology of the sparsely labeled cortical (L5, pyramidal neurons) and hippocampal (CA1, pyramidal neurons) neurons in tissue sections from wild-type and caspase-3-deficient adult mice. A minority of caspase-3 KO mice in the C57BL/6 background develop hydrocephalus; these were excluded because they do not survive to adulthood (data not shown; Kuida et al., 1996; Houde et al., 2004).
Dissociated hippocampal cultures from rat and mice were prepared as described previously (Bingol et al., 2010). Briefly, hippocampi of E18 rat or E17 mouse embryos were collected and digested with trypsin for 8 min or papain for 5 min, respectively. After washing with HBSS (rat) or neurobasal medium with B27 (mouse), 50–75 × 103 cells in 100 μl of medium were plated in glass-bottomed dishes (P35G-0-14-C, MatTek) coated with 30 mg/ml poly-d-lysine and 2 mg/ml laminin for 2 d and washed with DPBS (catalog #14190-144; Invitrogen) 4 times before culturing. After a 3–4 h incubation to allow for the settling of cells in the dish, 2 ml of neurobasal medium with B27 was added.
Transfection.
DNA plasmids were transfected using Lipofectamine 2000 or Lipofectamine LTX Reagent (Invitrogen). We used the commercially available Mito-KillerRed (catalog #FP964; Evrogen) and Mito-RFP constructs (catalog #FP147; Evrogen) for photostimulation experiments. Briefly, a final total of 2 μl of Lipofectamine reagent and 2 μg of total DNA in 100 μl of medium was used (per dish). Initially, Lipofectamine reagent and DNA were incubated in 25 μl glutamine-free neurobasal media separately for 5 min. Afterward, they were mixed (brief vortex and spin down) and incubated at room temperature for 30 min. Before addition to cells, the mix was diluted with additional 50 μl of medium containing 2× glutamine. After washing twice the cells with 2 ml of glutamine(+) media, 100 μl of transfection solution was added to cells and incubated for 40 min at 37°C. The cells were washed 2 times with 2 ml of glutamine(+) medium and the original conditioned media was replaced. Constructs were expressed for 1–3 d after transfection.
Time-lapse imaging.
Neurons were placed in an HBS-based imaging buffer containing 1.5 mm MgCl2 and 2 mm CaCl2 (Lu et al., 2001) and imaged using a Leica SP5 confocal microscopy system with an environmental chamber maintaining culture temperature at 37°C. Samples were scanned in live data mode using 63× (numerical aperture [NA]) 1.4 or 40× oil objective (NA 1.25) with the following parameters: 1024 × 1024 pixels, bidirectional, 700 hertz, 1.7× or 5× zoom, sequential scanning (stack by stack). The neurons were imaged every 10–60 min up to 15 h.
Mito-KillerRed photostimulation.
Mito-KillerRed photostimulation (photobleaching) was performed using a short arc mercury lamp (HXP 120W/45C; Osram) on a Leica SP5 (DMI6000CS) inverted confocal microscope. For photostimulation of a wide field containing many cells, a 20× oil objective (NA 0.70) was used; for photostimulation of single cell body or dendritic branches, either 63× (NA 1.4) or 40× oil objective (NA 1.25) with the smallest 2 apertures on the microscope was used. The local photostimulation experiments were performed on dendrites at similar distance from the soma center to the proximal edge of photostimulation (∼75–125 μm) at the tip of either primary or secondary dendrites. We observed no difference in the results of local Mito-KillerRed photostimulation on primary versus secondary dendrites.
Selection of neurons for photostimulation and evaluation criteria for survival.
The same acquisition parameters on the confocal microscope were used for imaging Mito-KillerRed or Mito-RFP. After acquiring the initial scans (before photostimulation), we obtained the max-projection views of the scanned samples (Fig. 1F,M) and selected neurons with similar expression levels defined by >50% saturation of the soma pixels for Mito-KillerRed or Mito-RFP fluorescence.
Figure 1.

Photostimulation of Mito-KillerRed in neuronal cell bodies results in cell death within hours. Cultured hippocampal neurons (9–12 DIV) were cotransfected with GFP and Mito-KillerRed (A–G) or GFP and Mito-RFP as control (H–N). Arrowheads in F mark some of the mitochondria labeled with Mito-KillerRed. Neuronal morphology (GFP) and Mito-KillerRed or Mito-RFP in mitochondria were monitored by time-lapse imaging at indicated times before and after photostimulation of cell bodies (region of photostimulation indicated by dashed circles). Photostimulation resulted in bleaching of Mito-KillerRed and Mito-RFP (G, N, dashed circles; only time-points “before” and 5 min after photostimulation are shown for Mito-KillerRed and Mito-RFP). F1 and M1 show high-magnification views of Mito-KillerRed- (F1) and Mito-RFP (M1)-labeled dendritic mitochondria. Mito-KillerRed-transfected neurons formed blebs on their neurites and soma, typical of apoptotic cells, and degenerated within 3–4.5 h (C, D, arrows), whereas neurons transfected with Mito-RFP survived > 7 h with no morphological change (H–L). Survival data are quantified in Figure 2O.
To measure neuronal survival, we monitored morphology using cytoplasmic GFP fluorescence. The appearance of membrane blebs on neuronal soma (Fig. 1C), which correlated with DNA fragmentation/condensation as detected by Hoechst staining (data not shown), was taken as the time point of cell death.
CellEvent active capase-3 reporter assay.
To monitor caspase-3 activity, we used a fluorescent reporter of caspase-3 activity called CellEvent (catalog #C10423; Invitrogen; Huang et al., 2011; Miyata et al., 2011). This reporter has an advantage over caspase-3 immunostaining because it allowed us monitoring of caspase-3 activation in the same neurons over time, before and after Mito-KillerRed/Mito-RFP photostimulation. Neurons transfected with either Mito-KillerRed or Mito-RFP were preincubated with 2 μm CellEvent for 15 min. The CellEvent reporter signal, which has excitation and emission spectra similar to GFP, was measured before and at indicated times after photostimulation of Mito-KillerRed or Mito-RFP.
Fluorescence signal quantification.
To quantify the fluorescence signal, we made the sum intensity projections of the confocal stacks for each sample using ImageJ (images/stacks/z-projection, sum slices). This projection adds the signal intensity values of all z-slices into one 32-bit projection. The intensity of the signal was then measured in the same size of region of interest in different samples (analyze/measure integrated density). Subsequently, the intensity measures from different experiments were added up and averaged.
Reactive oxygen species measurement.
To follow reactive oxygen species (ROS) production over time, we used the ROS indicator CM-H2DCFDA (catalog #C6827; Invitrogen). Neurons were washed 2 times with prewarmed imaging buffer and incubated with 2 μm CM-H2DCFDA (in imaging buffer) at 37°C for 30 min. After the incubation, the neurons were washed 3 times with warm imaging buffer and immediately used for photostimulation experiments.
Active caspase-3 and caspase-9 immunostaining and confocal imaging.
Hippocampal neurons were fixed with 4% PFA + 4% sucrose solution at room temperature for 10 min. After 4 washes with PBS, they were incubated at room temperature for 1 h in a “blocking solution” containing 2% fetal bovine serum (Invitrogen), 2% bovine serum albumin (Sigma-Aldrich), and 0.2% fish gelatin (Sigma-Aldrich) dissolved in PBS with 0.25% Triton X-100. Subsequently, cells were incubated 2–3 h with primary antibody for cleaved caspase-3 (catalog #9661; Cell Signaling Technology) or cleaved caspase-9 (catalog #9509; Cell Signaling Technology) diluted (1:250) in blocking solution. After washing with PBS 3 times, anti-rabbit Alexa Fluor 405 (catalog #A-31556; Invitrogen) for caspase-3 staining, Alexa Fluor 488 (catalog #A-11034; Invitrogen) and Alexa Fluor 647 (catalog #A-21245; Invitrogen) for caspase-9 staining secondary antibodies were applied in blocking solution for 1 h. Fluorescence imaging was performed using the Leica SP5 confocal system in sequential scanning mode. (We tested several anti-cleaved caspase-3 antibodies and found that the antibody from Cell Signaling Technology did not give any signal on caspase-3 KO neurons).
3D imaging of the entire brain.
3D imaging of entire unsectioned brains from wild-type and caspase-3 KO mice expressing GFP in a subset of neurons was performed as described previously (Ertürk et al., 2012a; Ertürk et al., 2012b). To achieve complete optical clearing of the entire brain, we extended the tetrahydrofuran (THF, catalog #186562; Sigma) and benzyl alcohol (catalog #305197; Sigma) + benzyl benzoate (catalog #B6630; Sigma) (BABB) incubation times as follows: 50% THF for 1 h, 70% THF for 1 h, 80% THF for 1 h, and 100% THF for 1 h, 100% THF for overnight, 100% THF for 1 h (next day), and 2 times BABB for 2 h.
Spine analysis.
The spine density in Figures 6 and 14 (defined as dendritic protrusions of length 0.5–2 μm) was measured by investigators blinded to the experimental conditions using ImageJ.
Figure 6.

Focal Mito-KillerRed photostimulation in dendrites induces local spine elimination and dendrite retraction. Cultured hippocampal neurons (DIV 17–24) were cotransfected with Mito-KillerRed and GFP and photostimulated within a defined region over a distal dendritic branch (dashed circle). Photobleaching of Mito-KillerRed is observed specifically within the photostimulated region (B, dashed circle). C–G, Low-magnification views of the same neuron as in A showing no signs of blebbing or degeneration during 9 h of time-lapse imaging after local Mito-KillerRed photostimulation. H–U, High-magnification views show no significant change in morphology of nonphotostimulated dendrite branches (H–L, arrows indicate examples of unchanging spines), but loss of spines and retraction of the dendrite tip in the photostimulated dendrite branch (M–T, arrowheads indicate examples of spines that are lost). Images in H–L and M–T are from indicated boxed regions in C. N and U, High-magnification views of the indicated regions in M and T. V, Quantification and time course of spine density changes in photostimulated versus unstimulated dendritic branches of wild-type neurons-transfected with Mito-KillerRed or Mito-RFP treated or untreated with z-DEVD-FMK or z-DEVD-LEHD compared with photostimulated dendritic branches from Casp3 KO neurons-transfected with Mito-KillerRed. W, Quantification and time course of photostimulated dendritic branch tip retraction after photostimulation (genotype, transfection, photostimulation, and drug treatment as indicated). The distance of dendrite tip to a stable reference point (e.g., a crossing point of an axon) is measured. *p < 0.05, calculated using a two-way ANOVA test with the Bonferroni correction compared with “wild-type/Mito-RFP/stimulation” control. Error bars indicate mean ± SEM. n = 11, 11, 11, 13, 12, and 12 neurons (from at least 3 independent hippocampal cultures) for the “wt/Mito-KR/stimulation,” “wt/Mito-KR/No stimulation,” “wt/Mito-RFP/ stimulation,” “Casp3 KO/Mito-KR/stimulation,” “wt/Mito-RFP/No stimulation,” and “wt/Mito-KR/DEVD/stimulation,” respectively.
Figure 14.
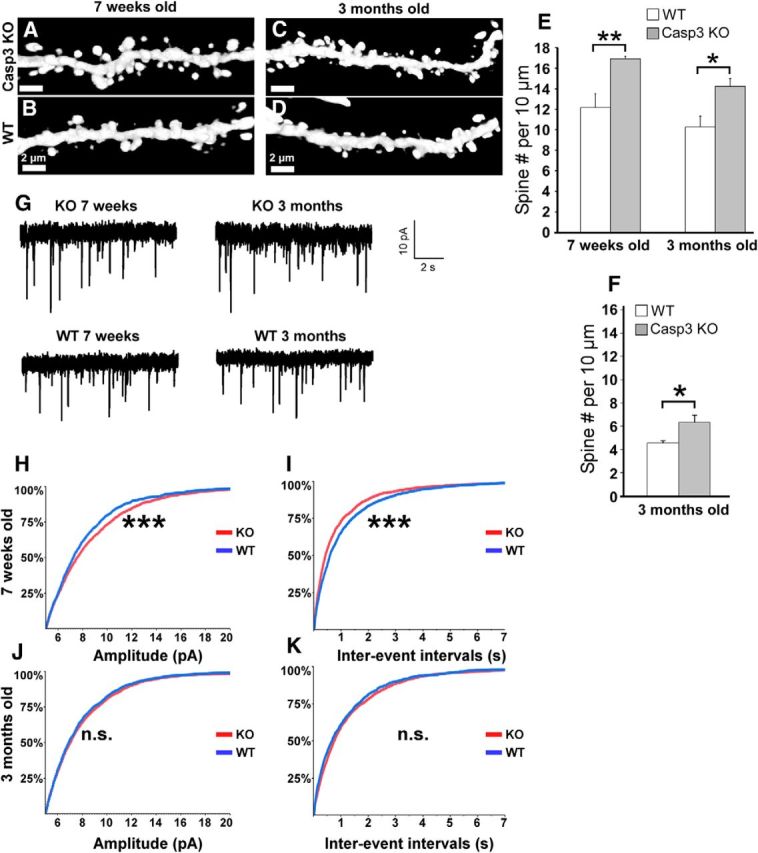
Caspase-3 KO mice manifest abnormalities in spine density and mEPSCs. A–G, Spine density was measured in caspase-3 KO mice and wild-type littermates (crossed to GFP-M line) using confocal microscopy of GFP-positive neurons in brain sections. A–D, Sample images of dendritic spines from apical branches of hippocampal CA1 pyramidal neurons in 7-week-old (A,B) and 3-month-old (C, D) caspase-3 KO mice and wild-type littermates. E, Quantification of dendritic spine density in hippocampal pyramidal neurons of caspase-3 KO versus wild-type littermates at 7 weeks and 3 months age. *p < 0.05, **p < 0.01 calculated by Student's t test (n = 5 mice per group, 66 dendritic branches for 7 weeks old caspase-3 KO, 67 dendritic branches for 7-week-old wild-type littermates; 61 dendritic branches for 3-month-old caspase-3 KO, 58 dendritic branches for 3-month-old wild-type littermates). F, Quantitation of dendritic spine density in cortical neurons of 3-month-old caspase-3 KO mice versus WT littermates. *p < 0.05 calculated by Student's t test (n = 3 mice per group, 28 dendritic branches for caspase-3 KO and 39 for wild-type). G, Sample recordings of mEPSCs for both 7-week-old and 3-month-old mice. H–K, Cumulative distributions of mEPSC peak amplitudes and interevent intervals for 7-week-old (H,I) and 3-month-old (J, K) caspase-3 KO and wild-type littermates. ***p < 0.001 calculated using a Kolmogorov–Smirnov test.
Nissl staining and quantification of brain sections.
The cryopreserved brain tissues were sectioned at 50 μm thickness. The sections were washed 3 times with PBS and incubated with 1:50 Nissl dye (catalog #N21482; Invitrogen) for 30 min. The number of Nissl-positive cells was counted using Imaris software by investigators blinded to caspase-3 genotype.
Electrophysiology.
Acute hippocampal slices (400 μm) from wild-type or caspase-3 KO mice were cut using a vibrating sectioning system (Leica). Cutting solution contained the following (in mm): 110 choline-Cl, 2.5 KCl, 25 NaHCO3, 1.25 NaH2PO4, 25 glucose, 0.5 CaCl2, 7 MgSO4, 11.6 Na ascorbate, and 3.1 Na pyruvate. Miniature EPSCs (mEPSCs) were recorded from CA1 pyramidal neurons of hippocampal slices at holding membrane potential of −70 mV. The recording solution was oxygenated artificial CSF (ACSF) containing the following (in mm): 127 NaCl, 2.5 KCl, 25 NaHCO3, 1.25 NaH2PO4, 25 glucose, 1.3 MgSO4, and 2.5 CaCl2, along with 100 μm picrotoxin and 1 μm tetrodotoxin. Pipette solution contained the following (in mm): 140 Cs methanesulfonate, 10 HEPES, 2.5 MgCl2, 10 EGTA, and 5 QX-314 chloride.
Image processing and statistical analysis.
The individual images were made using ImageJ. Images were cropped and resized (if necessary) with Adobe Photoshop and assembled to figures using Canvas (ACD Systems).
The survival curves were plotted in JMP statistical software from SAS (Analyze/Reliability and Survival/Survival) and statistical analysis of survival curves was calculated by a log-rank comparison in JMP containing all neurons (n ≥ 10) from at least 3–5 independent experiments. For statistical analysis of spine number and dendrite retraction over time (Fig. 6), a two-way ANOVA test with the Bonferroni correction was calculated by Prism (GraphPad). For fluorescence intensity of caspase-3 immunostaining (Figs. 7, 11), caspase-9 immunostaining (Fig. 5), CellEvent reporter (Figs. 3, 10), and ROS reporter (Fig. 4), a one-way ANOVA test with Tukey-Kramer post hoc test was performed using JMP. For the statistical analysis of electrophysiology data, cumulative distributions were generated using the maximum number of consecutive mEPSCs recorded for each cell (>115 events for 7-week-old cells and >145 events for 3-month-old cells) and compared using a Kolmogorov–Smirnov 2-sample test (Fig. 14). All other statistical analysis was performed using a two-tailed, unpaired Student's t test.
Figure 7.
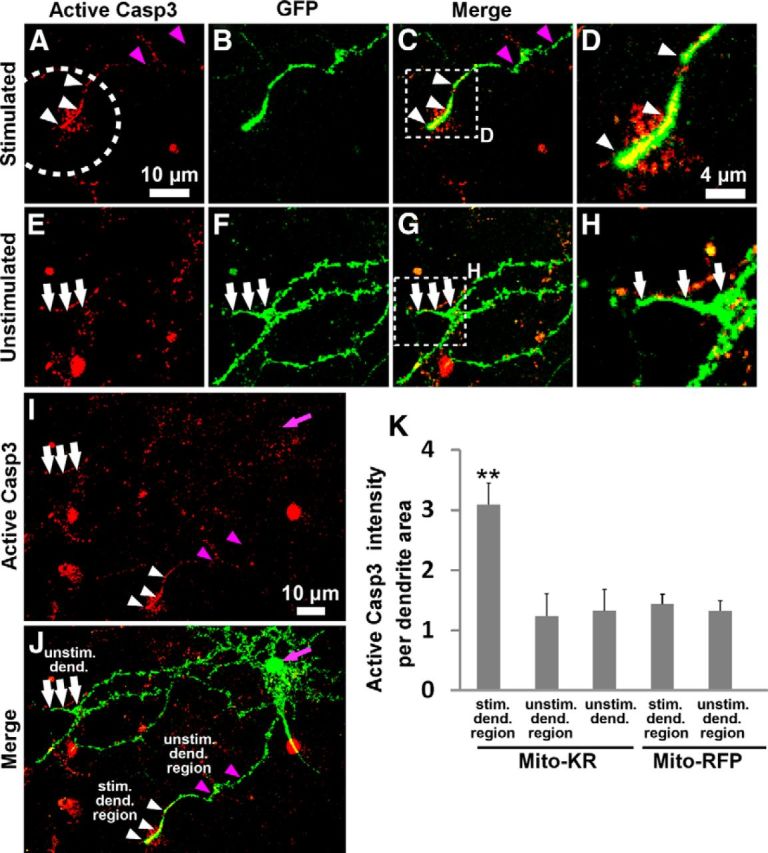
Activation of caspase-3 within the photostimulated region of Mito-KillerRed-transfected neurons. A–D, Immunostaining for active cleaved caspase-3 in dendrites of Mito-KillerRed and GFP-transfected neuron 9 h after photostimulation (A, dashed circle indicates region of photostimulation). D, High-magnification image of the indicated region in C. E–H, Immunostaining for active caspase-3 in the unstimulated dendrites of the same neuron. H, High-magnification image of the indicated region in G. GFP images indicate outline of-transfected neuronal dendrites; the irregularity of GFP signal is due to fixation conditions used for the caspase-3 immunostaining (B,F). C, G, merge of GFP and active caspase-3 images. Active caspase-3 immunostaining was detected in the photostimulated region of this dendrite (A,C,D, white arrowheads), but not in the unstimulated region of the same dendrite (A,C, purple arrowheads), nor in the unstimulated dendrites (E–H, white arrows). I, J, Low-magnification view of the whole cell stained for active caspase-3 (I) and merge of GFP and caspase-3 images (J). The purple arrows in I and J mark the cell body. Caspase-3 immunoreactivity (red) is also frequently observed in scattered cells and flecks in the culture outside of the GFP/Mito-KillerRed-transfected neuron. These signals might be coming from dying cells in normal culture conditions, activated microglia (Burguillos et al., 2011), or nonspecifically from the debris on the coverslip. K, Quantification of active caspase-3 immunostaining (active caspase-3 staining intensity per dendrite area) in the stimulated and unstimulated dendritic regions, as diagrammed in J (stim. dend. region, the dendritic region that lies within the photostimulation zone; unstim. dend. region, nonphotostimulated region of the dendrite that was photostimulated; unstim. dend., dendrite that was entirely nonphotostimulated). **p < 0.01 for “stimulated dendritic region” compared with “unstimulated dendritic region” or “unstimulated dendrite” groups calculated using a one-way ANOVA test with Tukey-Kramer post hoc test. Error bars indicate mean ± SEM. n ≥ 5 neurons for each group (from at least 3 independent hippocampal cultures).
Figure 11.

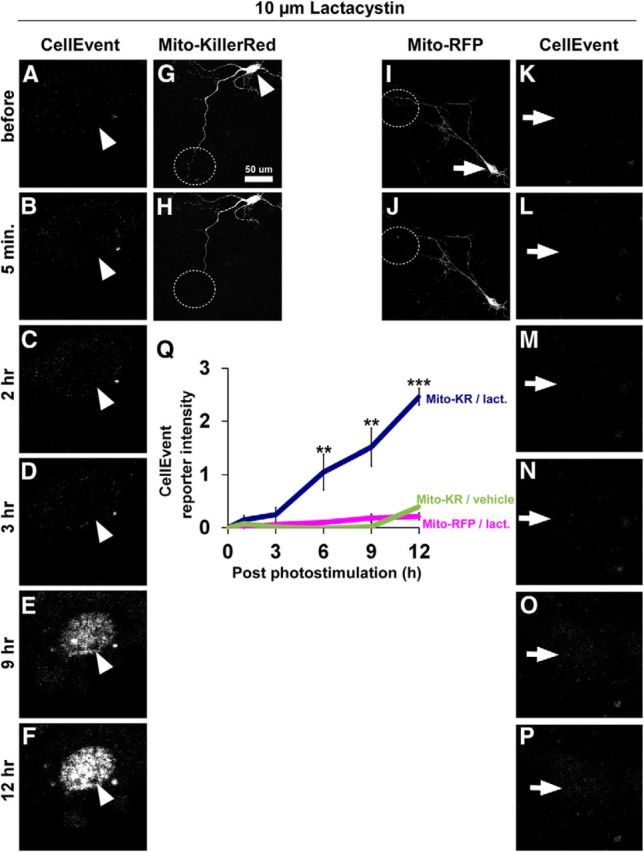
Caspase-3 activation induced by local Mito-KillerRed photostimulation is increased in the presence of lactacystin. A–J, Live imaging of a lactacystin-treated neuron after local Mito-KillerRed photostimulation of a distal dendrite (dashed circles). Photobleaching of Mito-KillerRed was observed within the photostimulated region (B, dashed circles). E, F, I, J, GFP images showing degeneration of dendrite within the photostimulated region by 3 h. G–J, High-magnification images from the indicated region in C showing the degeneration of photostimulated dendritic region over time. K–N, Immunostaining for active (cleaved) caspase-3 in soma and proximal dendrites of the same neuron (as in A–J) transfected with Mito-KillerRed and fixed 3 h after local dendritic photostimulation, when local dendritic degeneration was observed. Unlike nonphotostimulated neurons treated with lactacystin (O–R) or locally photostimulated neurons without lactacystin treatment (S–V), neurons locally photostimulated in distal dendrites in the presence of lactacystin treatment (K–N) showed elevated active caspase-3 staining in their soma (L, arrowhead). N, R, V, High-magnification images of the neuronal cell bodies in M, Q, and U, respectively. W, Quantification of immunostaining intensity for active caspase-3 in the neuronal cell bodies of Mito-KillerRed-transfected neurons photostimulated over a distal dendrite under the indicated conditions. ***p < 0.001 for “lactacystin/local stimulation” compared with “lactacystin/No stimulation” and **p < 0.01 for “lactacystin/local stimulation” compared with “No lactacystin/local stimulation” calculated by one-way ANOVA with Tukey-Kramer post hoc test. There is no significant difference between “lactacystin/No stimulation” group and vehicle group (p = 0.3856 compared with “No lactacystin/local stimulation”). Error bars indicate mean ± SEM. n = 5, 10, and 6 neurons (from at least 3 independent hippocampal cultures) for the “No lactacystin/local stimulation,” “lactacystin/No stimulation,” and “lactacystin/local stimulation” groups, respectively.
Figure 5.
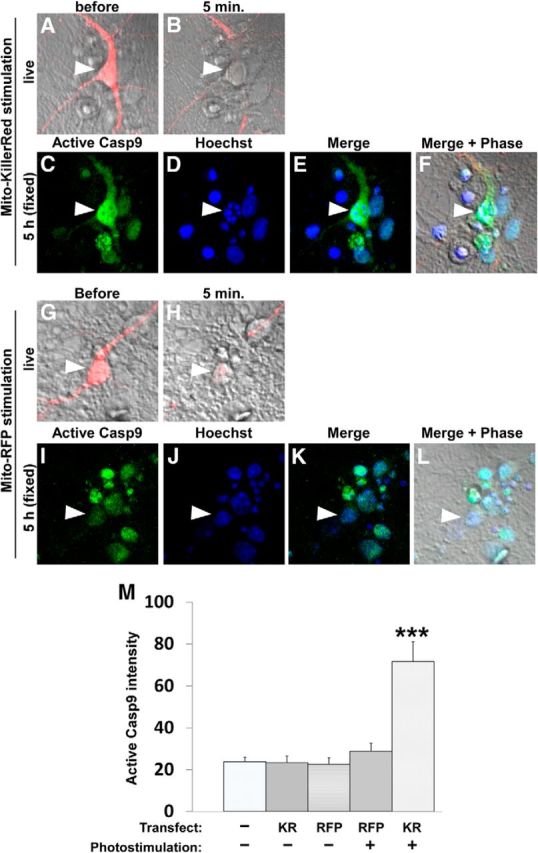
Activation of caspase-9 after Mito-KillerRed photostimulation. Immunostaining for active (cleaved) caspase-9 in cultured hippocampal neurons after Mito-KillerRed or Mito-RFP photostimulation. A–F, Mito-KillerRed-transfected neuron (arrowhead) was imaged before (A) and 5 min after photostimulation over the cell body (B). Five hours after activation, the neurons were fixed and stained with anti-active capase-9 antibody (C) and Hoechst dye (D). High levels of caspase-9 immunoreactivity (C) together with nuclear fragmentation (D) were detected in the photostimulated Mito-KillerRed-expressing neuron (arrowhead). E, Merge image of C and D. F, Merge image of E and phase. G–L, Mito-RFP-transfected neuron was imaged before (G) and 5 min after photostimulation (H). Five hours after activation, the neurons were fixed and stained with anti-active capase-9 antibody (I) and Hoechst dye (J). Mito-RFP-photostimulated neurons showed neither high caspase-9 immunoreactivity nor nuclear fragmentation. K, Merge image of I and J. L, Merge image of K and phase. M, Quantification of active caspase-9 immunostaining signal in cells transfected with Mito-RFP (RFP) or Mito-KillerRed (KR) and photostimulated or not stimulated. ***p < 0.001 for “Mito-KR/stimulation” compared with all other groups calculated using one-way ANOVA test with the Tukey-Kramer post hoc test. Error bars indicate mean ± SEM. n = 8, 7, 8, 10, and 31 neurons (from at least 3 independent hippocampal cultures) for the “Mito-KR/stimulation,” “Mito-RFP/stimulation,” “Mito-KR/No stimulation,” “Mito-RFP/No stimulation,” and “No transfection/No stimulation” groups, respectively.
Figure 3.

Monitoring caspase-3 activity with CellEvent reporter after Mito-KillerRed photostimulation. Time-lapse imaging of caspase-3 activity using the CellEvent reporter (catalog #C10423; Invitrogen). CellEvent reporter is a nucleic-acid-binding dye conjugated to caspase-3 cleavage site (DEVD peptide). When caspase-3 is activated, the DEVD peptide is cleaved, freeing the dye to bind to DNA and produce a fluorescent signal in the nucleus. Wild-type or capase-3 KO neurons were transfected with Mito-KillerRed or Mito-RFP (DIV 9–14); 2 μm CellEvent was added into the imaging medium ∼15 min before the experiments. A–R, Time-lapse imaging of CellEvent reporter signal before and after Mito-KillerRed photostimulation in the wild-type neurons (A–F, arrowheads), Mito-RFP photostimulation in wild-type neurons (G–L, arrowheads), or Mito-KillerRed photostimulation in caspase-3 KO neurons (M–R, arrowheads). Arrowheads indicate position of nucleus in neuronal cell. Insets show Mito-KillerRed or Mito-RFP channel before and after photostimulation of the cell body (dotted circles). S, Quantification of CellEvent reporter signal over time with the indicated genotype, transfection and photostimulation conditions. ***p < 0.001 for “wt/Mito-KR/stimulation” compared with all other groups at the indicated postphotostimulation time points, calculated using one-way ANOVA with Tukey-Kramer post hoc test. Error bars indicate mean ± SEM. n = 11, 8, 7, 7, and 3 neurons (from at least 3 independent hippocampal cultures) for the “wt/Mito-KR/stimulation,” “Casp3 KO/Mito-KR/stimulation,” “wt/Mito-RFP/stimulation,” “wt/Mito-KR/No stimulation,” and “Casp3 KO/Mito-KR/No stimulation” groups, respectively.
Figure 10.
Monitoring caspase-3 activation after local Mito-KillerRed photostimulation in the presence of the proteasome inhibitor lactacystin. A–P, Time-lapse imaging of caspase-3 activation using CellEvent reporter after local dendritic photostimulation of Mito-KillerRed (G, dashed circle) or Mito-RFP (I, dashed circle) in the presence of 10 μm lactacystin. A–F and K–P (arrowheads, arrows) are high-magnification views of the cell bodies of the neurons in G and I, respectively. CellEvent reporter showed positive signal when local stimulation of Mito-KillerRed in dendrites was combined with treatment with 10 μm lactacystin (A–F, quantified in Q). There was no CellEvent reporter signal when we stimulated Mito-RFP in the presence of proteasome inhibitor (I–P) or Mito-KillerRed in the absence of proteasome inhibitor (Q, vehicle). **p < 0.01 and ***p < 0.001 compared with both “Mito-KillerRed/vehicle” and “Mito-RFP/lactacystin” controls, calculated using one-way ANOVA with Tukey-Kramer post hoc test. Error bars indicate mean ± SEM. n = 6, 5, and 7 neurons (from at least 3 independent hippocampal cultures) for the “Mito-KillerRed/lactacystin,” “Mito-RFP/lactacystin,” and “Mito-KillerRed/vehicle” groups, respectively.
Figure 4.

Photostimulation of Mito-KillerRed but not Mito-RFP induces ROS production. We monitored the production of the ROS in Mito-KillerRed-transfected wild-type and caspase-3 KO neurons as well as in Mito-RFP-transfected wild-type neurons before and 0.5, 1.5, and 60 min after the photostimulation. Photostimulation of Mito-KillerRed both in wild-type (A) and caspase-3 KO (B) neurons induced high levels of ROS. Photostimulation of Mito-RFP in wild-type neurons (C) did not induce significant ROS elevation. Top, ROS signal at the indicated time points. Middle, Merge images of the ROS signal and phase images. Bottom, Mito-KillerRed or Mito-RFP channel before and after photostimulation of the cell body (dotted circles). D, Quantification of ROS signals at the indicated times after photostimulation. *p < 0.05 for “wt/Mito-KillerRed” and “Casp3 KO/Mito-KillerRed” compared with “wt/Mito-RFP,” calculated by one-way ANOVA with Tukey-Kramer post hoc test. Error bars indicate mean ± SEM. n = 15, 15, and 18 neurons (from at least 3 independent hippocampal cultures) for the “wt/Mito-KillerRed,” “Casp3 KO/Mito-KillerRed,” and “wt/Mito-RFP” groups, respectively.
Results
Mito-KillerRed photostimulation induces neuronal death via the mitochondrial pathway of caspase-3-dependent apoptosis
To activate caspase-3 with spatiotemporal control in neurons, we took an optogenetic approach using a genetically encoded protein called KillerRed. KillerRed (a derivative of red fluorescent protein) generates ROS upon photobleaching with green light irradiation (Roy et al., 2010; Yang and Yang, 2011), causing oxidative stress to nearby molecules and leading to cytotoxicity and apoptosis in various non-neuronal cell types (Bulina et al., 2006a; Bulina et al., 2006b; Serebrovskaya et al., 2009; Waldeck et al., 2011).
We transfected cultured hippocampal neurons (9–12 d in vitro [DIV]) with mitochondria-targeted KillerRed (Mito-KillerRed; Fig. 1F,F1, arrowheads), which should trigger mitochondrial damage and activate the intrinsic pathway of apoptosis when photostimulated (Waldeck et al., 2011). As a control, we used mitochondria-targeted RFP (Mito-RFP; Fig. 1M,M1). To monitor morphological changes in the neurons, we used time-lapse live imaging of cotransfected cytoplasmic GFP. Neurons expressed readily detectable levels of Mito-KillerRed, Mito-RFP, and GFP as early as 24 h after transfection and looked morphologically normal before light stimulation (Fig. 1A,H). Photostimulation of the cell body region (5–10 min stimulation, max power of 120W/45C mercury arc lamp, 40×/63× objectives, 535–575 nm excitation filter) resulted in bleaching of Mito-KillerRed and Mito-RFP within the irradiated region, as expected (Fig. 1G,N, dashed circles). Within several hours after Mito-KillerRed photostimulation of the cell body, neurons formed numerous blebs on their soma and neurites, morphological changes typical of apoptotic cell death (Fig. 1C, arrows), whereas the surrounding structures from other cells remained intact (Fig. 1C–E; Häcker, 2000). Identically irradiated neurons transfected with Mito-RFP showed no morphological aberration and appeared healthy with normal motility throughout the experiment (Fig. 1J–L). The survival rates at 3 and 7 h after photostimulation were 18% and 0%, respectively, for neurons transfected with Mito-KillerRed and 91% and 91%, respectively, for neurons transfected with Mito-RFP (Fig. 1A–E, H–L, quantified in Fig. 2O). Therefore, light-induced cell death was specific to Mito-KillerRed-expressing neurons. Neither Mito-KillerRed- nor Mito-RFP-transfected neurons showed any degeneration within minutes after photostimulation, further suggesting that light irradiation per se was not directly toxic (Fig. 1B,I).
Figure 2.

Neuronal degeneration after photostimulation of Mito-KillerRed depends on caspase-3 activation. Wild-type neurons transfected with Mito-KillerRed and GFP and treated with pan-caspase inhibitor (z-VAD-FMK, 100 μm; A–G) or caspase-3 KO (Casp3 KO) neurons transfected with Mito-KillerRed and GFP (H–N) were photostimulated over their cell bodies as in Figure 1 (dashed circles). Neuronal morphology and Mito-KillerRed were followed by time-lapse imaging at the indicated times (top). Graph in O shows the survival curve of neurons of the indicated genotype, transfection/treatment, and drug conditions over 7 h after photostimulation of Mito-KillerRed or Mito-RFP (including data from Fig. 1). The appearance of membrane blebs on the soma was taken as the point of cell death (Fig. 1C). Wild-type neurons treated with z-VAD-FMK (A–E) and caspase-3 KO neurons (J–N) were strongly protected against Mito-KillerRed-induced neuronal cell death. ***p < 0.001 for “wt/Mito-KR” compared with “wt/Mito-RFP” and for “wt/Mito-KR/ vehicle” compared with “wt/Mito-KR/VAD”; *p < 0.05 for “Casp3 KO/Mito-KR” compared with “wt/Mito-KR/z-VAD-FMK,” calculated by log-rank comparison. n = 15, 16, 11, 12, 10, 16, 15, 18 neurons (from at least 3 independent hippocampal cultures) for “Casp3 KO/Mito-KR/DEVD,” “wt/Mito-KR/VAD,” “wt/Mito-RFP,” “Casp3 KO/Mito-RFP,” “wt/Mito-KR + XIAP,” “Casp3 KO/Mito-KR,” “wt/Mito-KR,” and “wt/Mito-KR/vehicle” groups, respectively. KR, KillerRed; DEVD, z-DEVD-FMK inhibitor of caspase-3 and -7; VAD, z-VAD-FMK pan-caspase inhibitor.
To assess the role of caspases in Mito-KillerRed-induced neuronal death, we treated cells with the general caspase inhibitor z-VAD-FMK (100 μm), which was added 20 min before Mito-KillerRed photostimulation. We observed an almost complete block of cell degeneration (Fig. 2A–G,O; survival at 3 and 7 h after photostimulation was 100% and 93%, respectively). Similar experiments were performed in neurons derived from caspase-3 KO mice (Kuida et al., 1996). Caspase-3 KO neurons were largely protected from cell death after Mito-KillerRed photostimulation (Fig. 2H–N, quantified in O; survival for caspase-3 KO neurons at 3 and 7 h after photostimulation was 83% and 65%, respectively; compared with 18% and 0% for wild-type neurons) demonstrating that caspase-3 is required for Mito-KillerRed-induced neuronal death. Could there be contribution from other caspase(s), since ∼30% of neurons lacking caspase-3 still degenerate by 7 h (Fig. 2O)? Caspase-7 has overlapping functions and may be partially redundant with caspase-3 (Stennicke et al., 2000; Lakhani et al., 2006). We found that the addition of z-DEVD-FMK (a caspase-3/7 preferring inhibitor) further protected caspase-3 KO neurons (quantified in Fig. 2O), resulting in almost complete prevention of cell death similar to the pan-caspase inhibitor z-VAD-FMK. These data are consistent with a major role for caspase-3 and a minor role for caspase-7 in neuronal cell death induced by Mito-KillerRed.
The activation of capase-3 after Mito-KillerRed photostimulation was monitored longitudinally in neurons using the caspase-3 activity reporter “CellEvent” (Invitrogen; Huang et al., 2011; Miyata et al., 2011). After cleavage specifically by caspase-3, a released fragment of CellEvent binds DNA and becomes fluorescent. The CellEvent signal rose sharply between 2 and 5 h after Mito-KillerRed photostimulation of the soma (Fig. 3A–F, quantified in S), approximately similar to the time course of neuronal death as measured by appearance of membrane blebs (Fig. 2O). No significant increase in CellEvent signal was detected after photostimulation of Mito-RFP in wild-type neurons (Fig. 3G–L, S) or of Mito-KillerRed in caspase-3 KO neurons (Fig. 3M–R,S), indicating the selectivity of the CellEvent caspase-3 reporter.
Using a ROS indicator dye, we observed that photostimulation of Mito-KillerRed produced similar levels of ROS in wild-type and caspase-3 KO neurons (Fig. 4A,B), whereas photostimulation of Mito-RFP failed to induce detectable ROS (Fig. 4C,D). These findings exclude ROS as the direct toxic agent in Mito-KillerRed-induced cell death. Moreover, caspase-9, the upstream activator of caspase-3 in the mitochondrial pathway of apoptosis, was also activated upon photostimulation of Mito-KillerRed (Fig. 5A–F, arrowhead in C, quantified in M), but not of Mito-RFP (Fig. 5G–L, arrowhead in I, quantified in M). Together, these results support the idea that photostimulation of Mito-KillerRed induces ROS production in mitochondria, which then leads to activation of the caspase-9–caspase-3 pathway of apoptosis, presumably via mitochondrial release of proapoptotic factors such as cytochrome c (Li et al., 1997).
Local Mito-KillerRed photostimulation induces local spine shrinkage and dendritic retraction
Having established that photostimulation of Mito-KillerRed activates the mitochondrial apoptotic pathway in neurons, we then investigated whether localized activation of mitochondrial apoptotic mechanisms is sufficient to mediate local changes in the morphology of dendrites and spines. We took advantage of the fact that Mito-KillerRed is targeted to mitochondria, which are distributed throughout the dendritic tree of neurons (Fig. 6A), allowing us to locally photostimulate Mito-KillerRed within specific regions of dendrites. We photostimulated Mito-KillerRed in selected distal dendritic branches of hippocampal neurons (100% lamp power for 10–15 min, ∼40 μm diameter region, indicated by dashed circles in Fig. 6A,B) at 17–24 DIV, when dendritic spines are well developed. We monitored morphological changes in the entire neuron by time-lapse imaging (Fig. 6C–G) and compared spine/dendrite morphology in the stimulated region (Fig. 6M–T) versus unstimulated dendritic regions of the same neuron (Fig. 6H–L).
In Mito-KillerRed-expressing cells, most of the spines in the photostimulated distal dendrite progressively shrank and disappeared over a time course of hours (Fig. 6M–T, arrowheads, compare N,U, quantified in V). In unstimulated dendrite branches of the same neuron or in photostimulated dendrites of Mito-RFP transfected neurons, there was no change in spine density (Fig. 6H–L,V). In addition to loss of spines, the photostimulated distal dendrite of Mito-KillerRed-transfected neurons retracted in length (Fig. 6W, mean change ± SEM: −19.6 ± 6.0 μm at 9 h after photostimulation). Typically, the retraction of the dendrite tip occurred shortly after the shrinkage and loss of spines (Fig. 6M–T), suggesting that spine loss is not merely secondary to dendrite retraction. However, it is possible that the caspase-3-dependent mechanisms that induce spine elimination overlap with those that cause dendrite retraction. Therefore, these two events could also occur concomitantly after the local activation of caspase-3. In contrast, there was no retraction in the unstimulated branches of the same neurons nor were there any morphological changes in photostimulated dendritic branches of neurons transfected with Mito-RFP (Fig. 6W). Overall neuronal morphology (e.g., pattern of dendrite branching) was not altered by focal stimulation of Mito-KillerRed in a distal dendrite (Fig. 6C–G).
To confirm that the observed morphological effect of dendritic Mito-KillerRed stimulation was associated with local caspase-3 activation, we immunostained for active (cleaved) caspase-3 and compared staining in photostimulated versus unstimulated dendritic regions at 9 h after photostimulation. In Mito-KillerRed-transfected neurons, active caspase-3 was significantly elevated in the photostimulated dendritic branch, approximately corresponding to the distal 20–30 μm of the remaining dendrite (Fig. 7A–D, white arrowheads, quantified in K). Active caspase-3 immunoreactivity was not detectable in the unstimulated dendritic region of the same dendrite (Fig. 7A–C, purple arrowheads), in distant unstimulated dendrites of the same neuron (Fig. 7E–H, white arrows), or in the cell body (Fig. 7I,J, purple arrows). Active caspase-3 immunoreactivity was absent in caspase-3 KO neurons, demonstrating the specificity of the antibody staining (data not shown).
Importantly, in either caspase-3 KO neurons or wild-type neurons treated with caspase-3 inhibitor (z-DEVD-FMK) or caspase-9 inhibitor (z-LEHD-FMK), there was no spine alteration or dendrite retraction after local dendritic photostimulation of Mito-KillerRed (quantified in Fig. 6V,W). Therefore, we conclude that focal photostimulation of Mito-KillerRed in distal dendrites leads to local caspase-3 activation and local spine loss and dendrite retraction, specifically in the photostimulated region.
We also photostimulated Mito-KillerRed in “mid-segments” of dendrites (i.e., away from the distal tips) and observed a significant spine loss in the photoactivated region, albeit to a lesser degree compared with Mito-KillerRed photostimulation at the dendrite tip (29% vs 68% spine loss at 9 h, respectively). The lesser effect in the mid-segment of a dendrite could be due to the diffusion (and hence dilution) of activated caspase-3 in two directions within the dendrite after production by Mito-KillerRed photoactivation, as opposed to only one possible direction at the dendrite tip.
It is noteworthy that neurons did not show any morphological signs of cell death even several hours after completion of the Mito-KillerRed-induced local changes, arguing against a delayed activation of global apoptosis after local dendritic activation of Mito-KillerRed. We observed neuronal apoptosis only when Mito-KillerRed was photostimulated in the cell body (Fig. 2O) or in primary dendrites close to cell body (within 20 μm of the cell body; data not shown), suggesting that activation of caspase-3 is restricted from “spreading” to the cell body when Mito-KillerRed is photoactivated in peripheral dendrites.
Proteasome activity restrains the effect of Mito-KillerRed photostimulation
What molecular mechanisms restrict caspase activity to the local site of induction in dendrites, thereby preventing locally activated apoptotic pathways from causing neuronal cell death? Based on recent evidence that caspase-3 is ubiquitinated and degraded by the ubiquitin-proteasome system (UPS; Choi et al., 2009; Gray et al., 2010), we hypothesized that the UPS acts to restrain the amount and spread of active caspase-3 that is produced by Mito-KillerRed photostimulation. To test the idea, we first determined a “suboptimal” level of Mito-KillerRed photostimulation that would be insufficient to induce any effects on neuronal morphology or survival. To this end, the irradiation power was reduced by 2-fold and the duration of photostimulation of Mito-KillerRed was shortened to 5 min.
Mito-KillerRed-transfected neurons photostimulated for 5 min at half-power on their cell bodies showed no morphological changes and no cell death, as monitored by live imaging of GFP fill over 9 h (Fig. 8A–E, quantified in P). Nonphotostimulated neurons treated with 10 μm lactacystin were also unaffected (Fig. 8F–J, arrows, quantified in Fig. 9Q). In contrast, Mito-KillerRed neurons treated with a combination of proteasome inhibitor lactacystin (10 μm) and half-power photostimulation for 5 min degenerated over time (Fig. 8F–J,P, arrowheads; survival of unstimulated vs 5 min photostimulated lactacystin-treated neurons was 100% vs 55% at 6 h after photostimulation and 94% vs 27% at 9 h). Another proteasome inhibitor, MG132 (10 μm), also induced neuronal death when combined with half-power Mito-KillerRed photostimulation of the cell body (Fig. 8P), but not by itself (data not shown).
Figure 8.

Proteasome or IAP inhibitor enhances neuronal degeneration induced by photostimulation of Mito-KillerRed. Survival of neurons upon Mito-KillerRed photostimulation in the absence or presence of lactacystin or BV6. A–E, 5 min half-max power Mito-KillerRed photostimulation over the neuronal cell body (dashed circles) did not induce neuronal apoptosis in the absence of drug. Insets A1 and B1 show bleaching of the Mito-KillerRed signal by photostimulation in the cell body. F–J, In the presence of 10 μm lactacystin, photostimulated cells (5 min, half-max power, arrowheads) showed degeneration by 6 h, whereas nonphotostimulated neurons in the same culture (arrows) showed no deterioration. F1 and G1 show photobleaching of Mito-KillerRed signal in targeted neuron (arrowheads). K–O, The IAP inhibitor BV6 (2 μm) also led to cell death in combination with 5 min, half-max power photostimulation of Mito-KillerRed. K1 and L1 show photobleaching of Mito-KillerRed signal. P, Graph of neuronal survival under the indicated photostimulation and drug conditions. **p < 0.01 and ***p < 0.001 compared with “5 min photostimulation/vehicle” control calculated by log-rank comparison. n = 18, 10, 16, 12, and 16 neurons (from at least 3 independent hippocampal cultures) for the “No stimulation/vehicle,” “5 min stimulation/vehicle,” “5 min stimulation/10 μm MG132,” “5 min stimulation/10 μm lactacystin,” and “5 min stimulation/10 μm BV6” groups, respectively.
Figure 9.
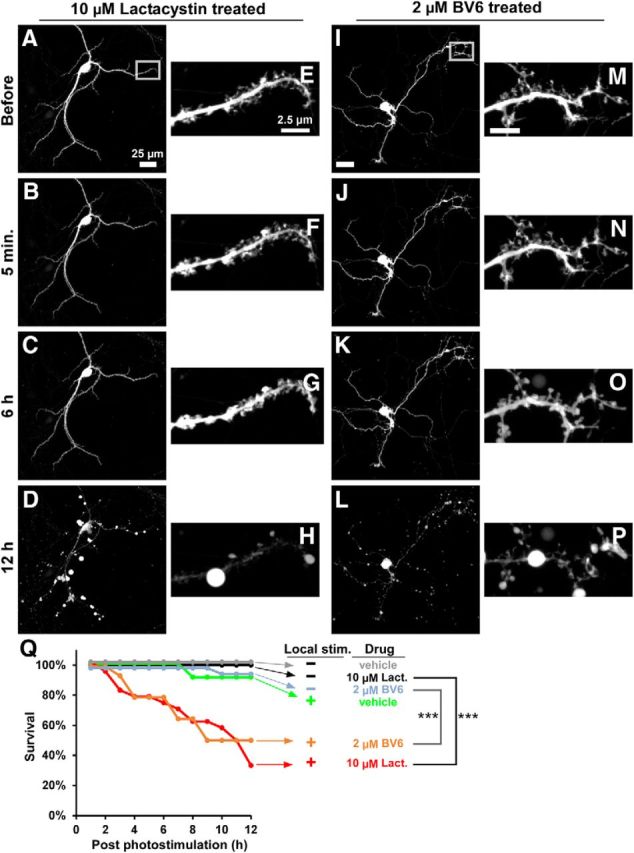
Proteasome activity is required to prevent neuronal cell death after local Mito-KillerRed photostimulation. Cultured hippocampal neurons (DIV 17–24) were cotransfected with Mito-KillerRed and GFP and photostimulated (max lamp power, 10–15 min) within a defined region over a distal dendritic branch (rectangles) in the presence of 10 μm lactacystin (A–H) or 2 μm BV6 (I–P). A–D, The low-magnification time-lapse images show degeneration of the entire neuron in the presence of lactacystin occurring by 12 h after local Mito-KillerRed photostimulation. E–H, High-magnification time-lapse images from the boxed region in A. I–L, In the presence of 2 μm BV6, an IAP inhibitor, photostimulation of distal dendritic branches also induces death of the entire neuron by 12 h (arrowheads). M–P, High-magnification images from the boxed region in I show morphological changes in the photostimulated dendrite starting at ∼6 h (arrowheads). Q, Graph showing survival curve of neurons under the indicated photostimulation and drug conditions. **p < 0.01 for “stimulation/2 μm BV6” compared with “No stimulation/2 μm BV6,” ***p < 0.001 for “stimulation/10 μm lactacystin” compared with “No stimulation/10 μm lactacystin” control, calculated by log-rank comparison. n = 10, 13, 17, 13, 17, and 24 neurons (from at least 3 independent hippocampal cultures) for the “No stimulation/vehicle,” “No stimulation/10 μm lactacystin,” “No stimulation/2 μm BV6,” “local stimulation/vehicle,” “local stimulation/2 μm BV6,” and “local stimulation/10 μm lactacystin” groups, respectively.
X-linked inhibitor of apoptosis (XIAP) is an E3 ligase that inhibits caspase-3 and caspase-9 directly and targets caspase-3 for proteasomal degradation (Riedl et al., 2001; Suzuki et al., 2001; Schile et al., 2008). We found that overexpression of XIAP in neurons protects them from Mito-KillerRed-induced apoptosis (quantified in Fig. 2O). Conversely, treatment with BV6, a specific pharmacologic inhibitor of IAPs including XIAP (Varfolomeev et al., 2007), which by itself did not kill the neurons, caused the death of neurons after 5 min of half-power Mito-KillerRed stimulation (Fig. 8K–O,P). These experiments show that the UPS and XIAP act to antagonize the proapoptotic effects of Mito-KillerRed activation, which is consistent with their known functions as “brakes” on apoptosis.
We then addressed whether XIAP and UPS are required for restricting locally activated caspase-3 in dendrites, thereby preventing cell death. To test this, we photoactivated Mito-KillerRed locally in distal dendrites in the presence of lactacystin or BV6 (Fig. 9). Local photostimulation (100% power, 10–15 min) of Mito-KillerRed in a distal dendrite in the presence of 10 μm lactacystin (Fig. 9A–H) or 2 μm BV6 (Fig. 9I–P) resulted in the death of most neurons by 12 h (quantified in Fig. 9Q). In contrast, minimal cell death was observed with the same photostimulation in the presence of vehicle control or with treatment of lactacystin alone or BV6 alone (Fig. 9Q).
To determine whether the cell death induced by distal photoactivation of Mito-KillerRed in the presence of lactacystin or BV6 is correlated with greater activation of caspase-3, we monitored caspase-3 activation using CellEvent reporter. The CellEvent reporter signal in the neuronal nucleus rose significantly after focal dendritic photostimulation of Mito-KillerRed (Fig. 10A–F, quantified in Q), but not of Mito-RFP (Fig. 10K–P,Q), in the presence of lactacystin. In addition, we immunostained for active caspase-3 in the cell bodies of lactacystin-treated and dendritically photostimulated neurons at a time point after observing local degeneration but before any signs of neuronal death (Fig. 11A–J). We found higher levels of active caspase-3 in the neuronal cell bodies of such cells (Fig. 11K–N, arrowhead, quantified in W) compared with lactacystin-treated, unstimulated cells (Fig. 11O–R,Q) or vehicle-treated, locally photostimulated neurons (Fig. 11S–V,W). Overall, these results strongly support the idea that IAPs and proteasomes are needed to block caspase-3 activity induced locally in dendrites from “spreading” to the cell body and causing cell death.
Caspase-3 regulates spine morphology and dynamics in vitro
We next investigated whether caspase-3 activity is involved in spine shrinkage in a more physiological context. Spine diminution and loss are observed in NMDA receptor-dependent LTD (Zhou et al., 2004), which can be mimicked in cultured neurons by bath application of NMDA (chem-LTD; Segal, 1995; Lee et al., 1998; Hasbani et al., 2001; Lee et al., 2004; Nakamura et al., 2011). As shown previously, acute NMDA treatment (40 μm, 3 min exposure) of cultured hippocampal neurons caused a significant decrease in spine size compared with vehicle control when measured 30 min after treatment (Fig. 12A,B, quantified in D). The NMDA-induced spine shrinkage was blocked by caspase-3/7 inhibitor z-DEVD-FMK (10 μm; Fig. 12C,D) and in caspase-3 KO neurons (Fig. 12E,F, quantified in G). Therefore, caspase-3 activity is necessary for spine shrinkage during NMDA-induced chem-LTD.
Figure 12.

Pharmacological inhibition of caspase-3 blocks NMDA-induced (chem-LTD) spine shrinkage and leads to enlargement of spines. A–F, Cultured hippocampal neurons (DIV 17–24) were transfected with GFP and fixed for spine analysis 30 min after the after pharmacologic treatments: 45 min vehicle (DMSO) pretreatment plus 3 min vehicle (DMSO) treatment (A); 45 min vehicle pretreatment plus 3 min 40 μm NMDA treatment (B); 45 min 10 μm z-DEVD-FMK pretreatment plus 3 min 40 μm NMDA treatment (C). The NMDA-treated neurons (B) possessed smaller dendritic spines compared with control neurons (A), which are rescued with pharmacological inhibition of caspase-3, z-DEVD-FMK (C). D, Spine size quantifications in the indicated conditions plotted as the cumulative frequency of spine head diameter. ***p < 0.001 for “DEVD/NMDA” compared with both “DMSO/NMDA” and “DMSO” groups calculated using a nonparametric multiple comparison with Mann–Whitney test. n = 20, 25, and 24 neurons (from at least 3 independent hippocampal cultures) for the “DMSO/NMDA,” “DEVD/NMDA,” and “DMSO” groups, respectively. E–G, Similar experiments performed on caspase-3 KO neurons confirmed that NMDA treatment could not induce spine shrinkage in the absence of caspase-3. E–F, DMSO- (E) or NMDA (F)-treated caspase-3 KO neurons. G, Spine size quantifications in the indicated conditions plotted as the cumulative frequency of spine head diameter. The difference was not significant (n.s.) for the “NMDA” group compared with the “DMSO” group calculated using a nonparametric multiple comparison with Mann–Whitney test. n = 30 neurons each for the “DMSO” and “NMDA” groups. H–M, Time-lapse imaging of GFP-transfected cultured hippocampal neurons (DIV 17–24) treated with either vehicle (DMSO; H, I) or 10 μm z-DEVD-FMK (J,K) for 4 h. Examples of spines that have enlarged relative to before-treatment are indicated in the 4 h image with (+) in J and K. Quantification of spine head diameter in neurons treated with vehicle (L) or 10 μm z-DEVD-FMK (M) plotted as cumulative frequency curves. ***p < 0.001 calculated using a nonparametric multiple comparison with Mann–Whitney test. n = 11 neurons (from at least 3 independent hippocampal cultures) for both the “vehicle” and “z-DEVD-FMK” groups.
Next, we tested the effect of caspase-3 on spine morphology in hippocampal neurons under basal culture conditions and found that 10 μm z-DEVD-FMK caused a slight but significant increase in spine size over the course of 4 h, as monitored by time-lapse imaging of neurons before and after treatment (Fig. 12H–K, quantified in L,M). Overall, these data suggest that caspase-3 activity has a constraining effect on spine morphology even under normal culture conditions.
Caspase-3 regulates spine density and synapse function in vivo
If caspase-3 activity plays a physiological role in dendritic spine elimination, one would expect that neurons lacking caspase-3 have supernumerary spines. To examine spine morphology in vivo, we crossed the caspase-3 KO mice to the Thy-1 GFP-M mice (caspase-3 KO × GFP-M). The brain anatomy of caspase-3 KO mice was grossly normal (Fig. 13A–F). The number of neurons in the cortex of caspase-3 KO versus wild-type mice was not different (Fig. 13G). Importantly, the density of dendritic spines in hippocampal CA1 neurons was 35–40% higher in juvenile (∼7 weeks old) caspase-3 KO mice than in wild-type littermates (Fig. 14A,B, quantified in E; number of spines per 10 μm were 16.9 ± 0.3 vs 12.2 ± 1.4, mean ± SD, respectively; n = 5 mice). The increase in spine density was maintained in adult (∼3 months old) caspase-3 KO mice (Fig. 14C,D, quantified in E; number of spines per 10 μm were 14.2 ± 0.8 vs 10.3 ± 1.1, mean ± SD; n = 5 mice). Spine density was similarly elevated in layer 5 cortical pyramidal neurons of caspase 3 KO mice compared with littermate wild-types (Fig. 14F; number of spines per 10 μm were 6.3 ± 0.7 vs 4.6 ± 0.2, mean ± SD, respectively). As further evidence that caspase-3 regulates spine numbers, we note that cultured hippocampal neurons from caspase-3 KO mice (17–24 DIV) also have a higher density of dendritic spines than wild-type neurons (5.2 ± 1.1 per 10 μm vs 3.97 ± 1.4, mean ± SD; Fig. 6V).
Figure 13.
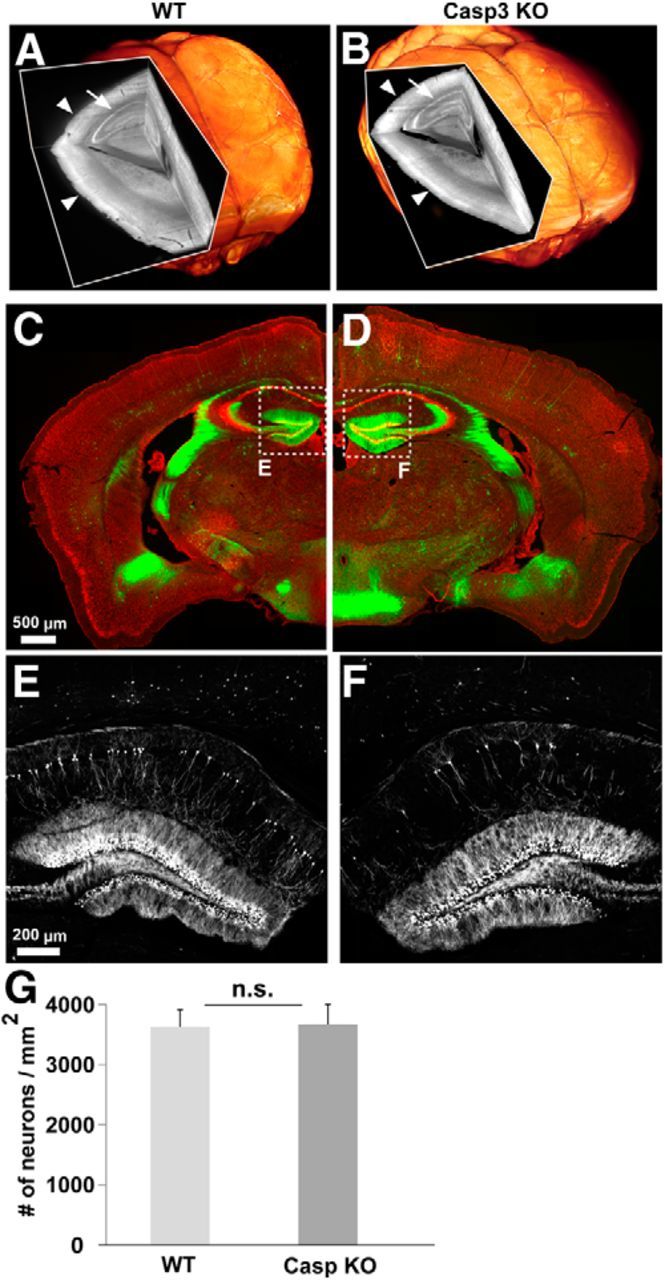
Anatomical characterization of caspase-3 KO brain. 3D scans of whole brains from 10-month-old wild-type (left) and caspase-3 KO (right) mice crossed to GFP-M line. The brains were cleared and subsequently imaged using light-sheet ultramicroscopy (Ertürk et al., 2012b). There was no gross abnormality of capase-3 KO brains compared with control mice: the cortex (B, arrowheads) and hippocampus (B, arrow) of the caspase-3 KO mice was similar to wild-type mice (A). C–D, Coronal brain sections from 3-month-old caspase-3 KO (right) and wild-type littermate (left) mice. Sparse neurons are labeled with GFP (green) and neuronal cell bodies are labeled with Nissl staining (red). No gross anatomical abnormality was observed in caspase-3 KO brain (see text for details). E, F, Hippocampus of wild-type (E) and caspase-3 KO (F) mice; only GFP images are shown. G, Quantification of Nissl staining in the cerebral cortex showing no difference in the numbers of neurons per square millimeter between wild-type and caspase-3 KO mice (p = 0.9311 calculated by Student's t test). n = 11 cortex scans for wild-type and 6 for caspase-3 KO from at least 3 different mice per group.
To determine whether the increased spine density correlates with synaptic strength, we recorded mEPSCs from acute hippocampal slices of both young and adult mice. Juvenile caspase-3 KO mice (∼7 weeks old) showed a significant increase in peak amplitude and frequency of mEPSCs compared with wild-types (Fig. 14G–I), which is consistent with an increase in synaptic release sites and in keeping with the higher spine count. However, neither amplitude nor frequency of mEPSCs was different in 3-month-old caspase-3 KO mice compared with wild-types, despite their elevated spine density (Fig. 14G,J,K). This could be due to homeostatic plasticity mechanisms that compensate for increased synaptic strength during maturation of the brain (Zito et al., 2004).
Discussion
Mito-KillerRed induced local caspase-3 activity and spine elimination
Photostimulation of KillerRed has been used to kill cells by apoptosis both in vitro (Bulina et al., 2006b) and in vivo (Del Bene et al., 2010; Teh et al., 2010). Here, we show in neurons that photostimulation of Mito-KillerRed induces ROS production and subsequent caspase-9 and caspase-3 activation. Using this optogenetic tool in peripheral parts of neurons, we were able to activate caspase-3 locally in the distal branches of dendrites and, more importantly, cause spine elimination and dendrite retraction in the irradiated region without killing the entire neuron (Fig. 15). The Mito-KillerRed-mediated local spine loss and dendrite pruning were absent in caspase-3 KO neurons and were blocked by a caspase-3/7-preferring inhibitor. Together, these data show that local activation of the mitochondrial apoptotic pathway can induce local pruning of dendrites and spines via a mechanism dependent on caspase-3 activity. Although the Mito-KillerRed photostimulation experiments demonstrate the sufficiency of local apoptotic mechanisms to sculpt neuronal morphology, they may not accurately reflect in vivo processes. Therefore, it will be important to confirm that caspase-3 is required for spine elimination in response to a more physiological LTD stimulus.
Figure 15.

Schematic model of caspase-3-mediated changes in distal dendritic regions. Optogenetic photostimulation of Mito-KillerRed induces ROS production, which leads to cytochrome c release and subsequent activation of caspase-9 and caspase-3/7. NMDA receptor activation can also trigger this apoptotic pathway locally in dendrites. The local activation of caspase-3 within dendrites is sufficient to prune dendritic spines and branches locally. XIAP and proteasomes act as brakes to limit the activation and prevent the spread of apoptotic mechanisms to the cell body, thereby preventing cell death.
What are the upstream regulators and downstream effectors of caspase-3? We found that Mito-KillerRed photostimulation triggers the activation of caspase-9; together with the mitochondrial localization of Mito-KillerRed, these data support the idea that caspase-3 activation by Mito-KillerRed occurs via the mitochondrial pathway of apoptosis (Riedl and Shi, 2004). As for downstream targets, it is unclear whether the substrates of caspase-3 that mediate spine loss and dendrite retraction after local Mito-KillerRed photostimulation are the same as those that mediate programmed cell death. The cytoskeleton is a key determinant of dendrite and spine morphology (Hotulainen and Hoogenraad, 2010), so it seems likely that cytoskeletal components might be downstream targets of local caspase-3 activity during spine elimination and dendrite pruning. Several cytoskeleton-associated proteins can be cleaved by caspases, including Gas2, gelsolin, β-catenin, fodrin, actin, PAK-2, spectrin, and tau (Brancolini et al., 1995; Martin et al., 1995; Mashima et al., 1995; Cryns et al., 1996; Kayalar et al., 1996; Kothakota et al., 1997; Rudel and Bokoch, 1997; Wang et al., 1998; Gamblin et al., 2003). Caspase-3 cleavage of actin regulatory proteins gelsolin and ROCK1 has been demonstrated to induce changes in cell morphology (Kothakota et al., 1997; Sebbagh et al., 2001). In addition, calcineurin (CaN), a calcium-dependent phosphatase that regulates ion channels and cytoskeletal proteins (Halpain et al., 1998; Winder and Sweatt, 2001), has been shown to be proteolytically activated by caspase-3 (Mukerjee et al., 2000). A brief application of Aβ on primary cortical neurons induces local CaN activation, which leads to morphological changes in spines (Wu et al., 2012). Akt is a prosurvival and progrowth protein kinase and reduced Akt phosphorylation-inhibition of GSK3β is required for induction of LTD (Peineau et al., 2007). Akt is also a proteolytic substrate of caspase-3 during apoptosis (Asselin et al., 2001) and caspase-3 cleavage of Akt has been implicated in the molecular mechanisms of LTD (Li et al., 2010) and of Aβ suppression of LTP (Jo et al., 2011). It is interesting that Akt is needed for dendrite growth and arborization (Jaworski et al., 2005), raising the possibility that cleavage of Akt by caspase-3 also contributes to the mechanisms of dendrite retraction and spine elimination when the apoptotic pathway is activated locally in dendrites.
Proteasome function limits the spread of caspase-3 activity and cell death
The use of proteasome inhibitors allowed the spread of caspase-3 activity to the cell body and neuronal cell death after focal photostimulation of Mito-KillerRed in peripheral dendrites. Similar effects were seen with inhibition of XIAP, an E3 ligase that targets caspase-3 for proteasomal degradation (Riedl et al., 2001; Suzuki et al., 2001; Schile et al., 2008). Therefore, we propose that proteasomal degradation of activated caspase-3 serves as a brake to limit caspase activity to its local site of induction. This could prevent neuronal cell death when caspase-3 is activated “subapoptotically” in dendrites, as is the case during NMDA-receptor-dependent LTD or developmental synapse pruning (Kuo et al., 2006; Li et al., 2010). Termination of caspase function could occur because caspase-3 is ubiquitinated by XIAP and degraded by the proteasome (Suzuki et al., 2001; Choi et al., 2009; Gray et al., 2010). Caspase-3 is modestly and transiently activated by NMDA receptor activation during LTD (Li et al., 2010; Jo et al., 2011) and, interestingly, similar synaptic stimulation also enhances proteasome activity and recruits proteasomes to stimulated synapses (Bingol and Schuman, 2006; Shen et al., 2007; Djakovic et al., 2009; Bingol et al., 2010; Bingol and Sheng, 2011). Therefore, there is likely to be a coordinated stimulation of both proteasomes and apoptotic mechanisms in the vicinity of synapses, with the former operating to limit the temporal duration and spatial extent of action of caspase-3. Such mechanisms could explain why local Mito-KillerRed photostimulation and LTD are not associated with neuronal cell death while allowing some potential for local caspase-3 effects to spread to nearby synapses (heterosynaptic LTD; Nishiyama et al., 2000).
Physiological and pathological role of caspase-3 in regulation of dendritic spines
We found that caspase-3 KO mice have abnormally high spine density by 7 weeks of age and this excess is maintained into adulthood. These data affirm that caspase-3 is physiologically important for regulation of spine numbers in vivo. The supernumerary spines of caspase-3-deficient mice are consistent with the idea that a major function of caspase-3 in spine morphogenesis is to eliminate spines.
Alterations in spine density and morphology occur not only in response to neuronal activity under physiological circumstances (Bosch and Hayashi, 2012), but also under pathological conditions (Sheng et al., 2012). The loss of synapses correlates closely with functional-cognitive impairment in neurodegenerative diseases and therapeutic approaches that “save” spines and synapses are potentially attractive for treating neurodegeneration, especially at early stages of disease. In this study, we used Mito-KillerRed to show that local activation of apoptosis mechanisms is sufficient to induce spine loss. Given that elevated caspase-3 activity has been observed in spines of transgenic mouse models of Alzheimer's disease (AD; D'Amelio et al., 2011), our findings suggest that local caspase-3 activity in dendrites could be contributing to synaptic alterations in neurodegenerative diseases, most notably in AD, where Aβ is already implicated in depressing synaptic function (Hsieh et al., 2006; Malinow, 2012). It remains unclear how the acute activation of Mito-KillerRed, ROS production, and local apoptosis in our experimental system relates to the chronic time course of neurodegenerative diseases; however, one could envisage that a succession of numerous acute and local subapoptotic events over time and space in neurons could accumulate over many years and gradually overwhelm compensatory and reserve capacities of the nervous system. In such a context, we speculate that inhibiting caspase-3 or other components of the mitochondrial apoptosis pathway may slow down the loss of dendritic spines and synapses, as well as neuronal death and cognitive decline, in neurodegenerative disease.
Footnotes
We thank B. Bingol, M. Chang, J. Hanson, C. Hojer, N. Khidekel, C. Nelson, P. Steiner, and F. Yeh for critically reading the manuscript; C. Chalouni, H. Ngu, and L. Komuves for assistance with confocal microscopy and ImageJ macros; A. Bruce for illustration drawing of the model,;A. Tully and M. Gastinger for help with Imaris software; R. Flavell (Yale University) for the caspase-3 KO; J. Sanes (Harvard University) for GFP-M mice; and D. Vucic for XIAP-flag and BV6.
References
- Alnemri ES, Livingston DJ, Nicholson DW, Salvesen G, Thornberry NA, Wong WW, Yuan J. Human ICE/CED-3 protease nomenclature. Cell. 1996;87:171. doi: 10.1016/S0092-8674(00)81334-3. [DOI] [PubMed] [Google Scholar]
- Asselin E, Mills GB, Tsang BK. XIAP regulates Akt activity and caspase-3-dependent cleavage during cisplatin-induced apoptosis in human ovarian epithelial cancer cells. Cancer Res. 2001;61:1862–1868. [PubMed] [Google Scholar]
- Bingol B, Schuman EM. Activity-dependent dynamics and sequestration of proteasomes in dendritic spines. Nature. 2006;441:1144–1148. doi: 10.1038/nature04769. [DOI] [PubMed] [Google Scholar]
- Bingol B, Sheng M. Deconstruction for reconstruction: the role of proteolysis in neural plasticity and disease. Neuron. 2011;69:22–32. doi: 10.1016/j.neuron.2010.11.006. [DOI] [PubMed] [Google Scholar]
- Bingol B, Wang CF, Arnott D, Cheng D, Peng J, Sheng M. Autophosphorylated CaMKIIalpha acts as a scaffold to recruit proteasomes to dendritic spines. Cell. 2010;140:567–578. doi: 10.1016/j.cell.2010.01.024. [DOI] [PubMed] [Google Scholar]
- Bosch M, Hayashi Y. Structural plasticity of dendritic spines. Curr Opin Neurobiol. 2012;22:383–388. doi: 10.1016/j.conb.2011.09.002. [DOI] [PMC free article] [PubMed] [Google Scholar]
- Brancolini C, Benedetti M, Schneider C. Microfilament reorganization during apoptosis: the role of Gas2, a possible substrate for ICE-like proteases. EMBO J. 1995;14:5179–5190. doi: 10.1002/j.1460-2075.1995.tb00202.x. [DOI] [PMC free article] [PubMed] [Google Scholar]
- Bulina ME, Lukyanov KA, Britanova OV, Onichtchouk D, Lukyanov S, Chudakov DM. Chromophore-assisted light inactivation (CALI) using the phototoxic fluorescent protein KillerRed. Nat Protoc. 2006a;1:947–953. doi: 10.1038/nprot.2006.89. [DOI] [PubMed] [Google Scholar]
- Bulina ME, Chudakov DM, Britanova OV, Yanushevich YG, Staroverov DB, Chepurnykh TV, Merzlyak EM, Shkrob MA, Lukyanov S, Lukyanov KA. A genetically encoded photosensitizer. Nat Biotechnol. 2006b;24:95–99. doi: 10.1038/nbt1175. [DOI] [PubMed] [Google Scholar]
- Burguillos MA, Deierborg T, Kavanagh E, Persson A, Hajji N, Garcia-Quintanilla A, Cano J, Brundin P, Englund E, Venero JL, Joseph B. Caspase signalling controls microglia activation and neurotoxicity. Nature. 2011;472:319–324. doi: 10.1038/nature09788. [DOI] [PubMed] [Google Scholar]
- Choi YE, Butterworth M, Malladi S, Duckett CS, Cohen GM, Bratton SB. The E3 ubiquitin ligase cIAP1 binds and ubiquitinates caspase-3 and -7 via unique mechanisms at distinct steps in their processing. J Biol Chem. 2009;284:12772–12782. doi: 10.1074/jbc.M807550200. [DOI] [PMC free article] [PubMed] [Google Scholar]
- Cryns VL, Bergeron L, Zhu H, Li H, Yuan J. Specific cleavage of alpha-fodrin during Fas- and tumor necrosis factor-induced apoptosis is mediated by an interleukin-1beta-converting enzyme/Ced-3 protease distinct from the poly(ADP-ribose) polymerase protease. J Biol Chem. 1996;271:31277–31282. doi: 10.1074/jbc.271.49.31277. [DOI] [PubMed] [Google Scholar]
- D'Amelio M, Cavallucci V, Middei S, Marchetti C, Pacioni S, Ferri A, Diamantini A, De Zio D, Carrara P, Battistini L, Moreno S, Bacci A, Ammassari-Teule M, Marie H, Cecconi F. Caspase-3 triggers early synaptic dysfunction in a mouse model of Alzheimer's disease. Nat Neurosci. 2011;14:69–76. doi: 10.1038/nn.2709. [DOI] [PubMed] [Google Scholar]
- Del Bene F, Wyart C, Robles E, Tran A, Looger L, Scott EK, Isacoff EY, Baier H. Filtering of visual information in the tectum by an identified neural circuit. Science. 2010;330:669–673. doi: 10.1126/science.1192949. [DOI] [PMC free article] [PubMed] [Google Scholar]
- Djakovic SN, Schwarz LA, Barylko B, DeMartino GN, Patrick GN. Regulation of the proteasome by neuronal activity and calcium/calmodulin-dependent protein kinase II. J Biol Chem. 2009;284:26655–26665. doi: 10.1074/jbc.M109.021956. [DOI] [PMC free article] [PubMed] [Google Scholar]
- Ertürk A, Becker K, Jährling N, Mauch CP, Hojer CD, Egen JG, Hellal F, Bradke F, Sheng M, Dodt HU. Three-dimensional imaging of solvent-cleared organs using 3DISCO. Nat Protoc. 2012a;7:1983–1995. doi: 10.1038/nprot.2012.119. [DOI] [PubMed] [Google Scholar]
- Ertürk A, Mauch CP, Hellal F, Förstner F, Keck T, Becker K, Jährling N, Steffens H, Richter M, Hübener M, Kramer E, Kirchhoff F, Dodt HU, Bradke F. Three-dimensional imaging of the unsectioned adult spinal cord to assess axon regeneration and glial responses after injury. Nat Med. 2012b;18:166–171. doi: 10.1038/nm.2600. [DOI] [PubMed] [Google Scholar]
- Feng G, Mellor RH, Bernstein M, Keller-Peck C, Nguyen QT, Wallace M, Nerbonne JM, Lichtman JW, Sanes JR. Imaging neuronal subsets in transgenic mice expressing multiple spectral variants of GFP. Neuron. 2000;28:41–51. doi: 10.1016/S0896-6273(00)00084-2. [DOI] [PubMed] [Google Scholar]
- Fuchs Y, Steller H. Programmed cell death in animal development and disease. Cell. 2011;147:742–758. doi: 10.1016/j.cell.2011.10.033. [DOI] [PMC free article] [PubMed] [Google Scholar]
- Gamblin TC, Chen F, Zambrano A, Abraha A, Lagalwar S, Guillozet AL, Lu M, Fu Y, Garcia-Sierra F, LaPointe N, Miller R, Berry RW, Binder LI, Cryns VL. Caspase cleavage of tau: linking amyloid and neurofibrillary tangles in Alzheimer's disease. Proc Natl Acad Sci U S A. 2003;100:10032–10037. doi: 10.1073/pnas.1630428100. [DOI] [PMC free article] [PubMed] [Google Scholar]
- Gray DC, Mahrus S, Wells JA. Activation of specific apoptotic caspases with an engineered small-molecule-activated protease. Cell. 2010;142:637–646. doi: 10.1016/j.cell.2010.07.014. [DOI] [PMC free article] [PubMed] [Google Scholar]
- Häcker G. The morphology of apoptosis. Cell Tissue Res. 2000;301:5–17. doi: 10.1007/s004410000193. [DOI] [PubMed] [Google Scholar]
- Halpain S, Hipolito A, Saffer L. Regulation of F-actin stability in dendritic spines by glutamate receptors and calcineurin. J Neurosci. 1998;18:9835–9844. doi: 10.1523/JNEUROSCI.18-23-09835.1998. [DOI] [PMC free article] [PubMed] [Google Scholar]
- Hasbani MJ, Schlief ML, Fisher DA, Goldberg MP. Dendritic spines lost during glutamate receptor activation reemerge at original sites of synaptic contact. J Neurosci. 2001;21:2393–2403. doi: 10.1523/JNEUROSCI.21-07-02393.2001. [DOI] [PMC free article] [PubMed] [Google Scholar]
- Hotulainen P, Hoogenraad CC. Actin in dendritic spines: connecting dynamics to function. J Cell Biol. 2010;189:619–629. doi: 10.1083/jcb.201003008. [DOI] [PMC free article] [PubMed] [Google Scholar]
- Houde C, Banks KG, Coulombe N, Rasper D, Grimm E, Roy S, Simpson EM, Nicholson DW. Caspase-7 expanded function and intrinsic expression level underlies strain-specific brain phenotype of caspase-3-null mice. J Neurosci. 2004;24:9977–9984. doi: 10.1523/JNEUROSCI.3356-04.2004. [DOI] [PMC free article] [PubMed] [Google Scholar]
- Hsieh H, Boehm J, Sato C, Iwatsubo T, Tomita T, Sisodia S, Malinow R. AMPAR removal underlies Abeta-induced synaptic depression and dendritic spine loss. Neuron. 2006;52:831–843. doi: 10.1016/j.neuron.2006.10.035. [DOI] [PMC free article] [PubMed] [Google Scholar]
- Huang TC, Lee JF, Chen JY. Pardaxin, an antimicrobial peptide, triggers caspase-dependent and ROS-mediated apoptosis in HT-1080 cells. Marine drugs. 2011;9:1995–2009. doi: 10.3390/md9101995. [DOI] [PMC free article] [PubMed] [Google Scholar]
- Hyman BT, Yuan J. Apoptotic and non-apoptotic roles of caspases in neuronal physiology and pathophysiology. Nat Rev Neurosci. 2012;13:395–406. doi: 10.1038/nrn3228. [DOI] [PubMed] [Google Scholar]
- Jaworski J, Spangler S, Seeburg DP, Hoogenraad CC, Sheng M. Control of dendritic arborization by the phosphoinositide-3′-kinase-Akt-mammalian target of rapamycin pathway. J Neurosci. 2005;25:11300–11312. doi: 10.1523/JNEUROSCI.2270-05.2005. [DOI] [PMC free article] [PubMed] [Google Scholar]
- Jiao S, Li Z. Nonapoptotic function of BAD and BAX in long-term depression of synaptic transmission. Neuron. 2011;70:758–772. doi: 10.1016/j.neuron.2011.04.004. [DOI] [PMC free article] [PubMed] [Google Scholar]
- Jo J, Whitcomb DJ, Olsen KM, Kerrigan TL, Lo SC, Bru-Mercier G, Dickinson B, Scullion S, Sheng M, Collingridge G, Cho K. Abeta(1–42) inhibition of LTP is mediated by a signaling pathway involving caspase-3, Akt1 and GSK-3beta. Nat Neurosci. 2011;14:545–547. doi: 10.1038/nn.2785. [DOI] [PubMed] [Google Scholar]
- Kayalar C, Ord T, Testa MP, Zhong LT, Bredesen DE. Cleavage of actin by interleukin 1 beta-converting enzyme to reverse DNase I inhibition. Proc Natl Acad Sci U S A. 1996;93:2234–2238. doi: 10.1073/pnas.93.5.2234. [DOI] [PMC free article] [PubMed] [Google Scholar]
- Kerr JF, Wyllie AH, Currie AR. Apoptosis: a basic biological phenomenon with wide-ranging implications in tissue kinetics. Br J Cancer. 1972;26:239–257. doi: 10.1038/bjc.1972.33. [DOI] [PMC free article] [PubMed] [Google Scholar]
- Kothakota S, Azuma T, Reinhard C, Klippel A, Tang J, Chu K, McGarry TJ, Kirschner MW, Koths K, Kwiatkowski DJ, Williams LT. Caspase-3-generated fragment of gelsolin: effector of morphological change in apoptosis. Science. 1997;278:294–298. doi: 10.1126/science.278.5336.294. [DOI] [PubMed] [Google Scholar]
- Kuida K, Zheng TS, Na S, Kuan C, Yang D, Karasuyama H, Rakic P, Flavell RA. Decreased apoptosis in the brain and premature lethality in CPP32-deficient mice. Nature. 1996;384:368–372. doi: 10.1038/384368a0. [DOI] [PubMed] [Google Scholar]
- Kuo CT, Zhu S, Younger S, Jan LY, Jan YN. Identification of E2/E3 ubiquitinating enzymes and caspase activity regulating Drosophila sensory neuron dendrite pruning. Neuron. 2006;51:283–290. doi: 10.1016/j.neuron.2006.07.014. [DOI] [PubMed] [Google Scholar]
- Lakhani SA, Masud A, Kuida K, Porter GA, Jr, Booth CJ, Mehal WZ, Inayat I, Flavell RA. Caspases 3 and 7: key mediators of mitochondrial events of apoptosis. Science. 2006;311:847–851. doi: 10.1126/science.1115035. [DOI] [PMC free article] [PubMed] [Google Scholar]
- Lee HK, Kameyama K, Huganir RL, Bear MF. NMDA induces long-term synaptic depression and dephosphorylation of the GluR1 subunit of AMPA receptors in hippocampus. Neuron. 1998;21:1151–1162. doi: 10.1016/S0896-6273(00)80632-7. [DOI] [PubMed] [Google Scholar]
- Lee SH, Simonetta A, Sheng M. Subunit rules governing the sorting of internalized AMPA receptors in hippocampal neurons. Neuron. 2004;43:221–236. doi: 10.1016/j.neuron.2004.06.015. [DOI] [PubMed] [Google Scholar]
- Leonard JR, Klocke BJ, D'Sa C, Flavell RA, Roth KA. Strain-dependent neurodevelopmental abnormalities in caspase-3-deficient mice. J Neuropathol Exp Neurol. 2002;61:673–677. doi: 10.1093/jnen/61.8.673. [DOI] [PubMed] [Google Scholar]
- Li P, Nijhawan D, Budihardjo I, Srinivasula SM, Ahmad M, Alnemri ES, Wang X. Cytochrome c and dATP-dependent formation of Apaf-1/caspase-9 complex initiates an apoptotic protease cascade. Cell. 1997;91:479–489. doi: 10.1016/S0092-8674(00)80434-1. [DOI] [PubMed] [Google Scholar]
- Li Z, Jo J, Jia JM, Lo SC, Whitcomb DJ, Jiao S, Cho K, Sheng M. Caspase-3 activation via mitochondria is required for long-term depression and AMPA receptor internalization. Cell. 2010;141:859–871. doi: 10.1016/j.cell.2010.03.053. [DOI] [PMC free article] [PubMed] [Google Scholar]
- Lu W, Man H, Ju W, Trimble WS, MacDonald JF, Wang YT. Activation of synaptic NMDA receptors induces membrane insertion of new AMPA receptors and LTP in cultured hippocampal neurons. Neuron. 2001;29:243–254. doi: 10.1016/S0896-6273(01)00194-5. [DOI] [PubMed] [Google Scholar]
- Malinow R. New developments on the role of NMDA receptors in Alzheimer's disease. Curr Opin Neurobiol. 2012;22:559–563. doi: 10.1016/j.conb.2011.09.001. [DOI] [PMC free article] [PubMed] [Google Scholar]
- Martin SJ, O'Brien GA, Nishioka WK, McGahon AJ, Mahboubi A, Saido TC, Green DR. Proteolysis of fodrin (non-erythroid spectrin) during apoptosis. J Biol Chem. 1995;270:6425–6428. doi: 10.1074/jbc.270.12.6425. [DOI] [PubMed] [Google Scholar]
- Mashima T, Naito M, Fujita N, Noguchi K, Tsuruo T. Identification of actin as a substrate of ICE and an ICE-like protease and involvement of an ICE-like protease but not ICE in VP-16-induced U937 apoptosis. Biochem Biophys Res Commun. 1995;217:1185–1192. doi: 10.1006/bbrc.1995.2894. [DOI] [PubMed] [Google Scholar]
- Miyata M, Kambe M, Tajima O, Moriya S, Sawaki H, Hotta H, Kondo Y, Narimatsu H, Miyagi T, Furukawa K, Furukawa K. Membrane sialidase NEU3 is highly expressed in human melanoma cells promoting cell growth with minimal changes in the composition of gangliosides. Cancer Sci. 2011;102:2139–2149. doi: 10.1111/j.1349-7006.2011.02086.x. [DOI] [PMC free article] [PubMed] [Google Scholar]
- Mukerjee N, McGinnis KM, Park YH, Gnegy ME, Wang KK. Caspase-mediated proteolytic activation of calcineurin in thapsigargin-mediated apoptosis in SH-SY5Y neuroblastoma cells. Arch Biochem Biophys. 2000;379:337–343. doi: 10.1006/abbi.2000.1889. [DOI] [PubMed] [Google Scholar]
- Nägerl UV, Eberhorn N, Cambridge SB, Bonhoeffer T. Bidirectional activity-dependent morphological plasticity in hippocampal neurons. Neuron. 2004;44:759–767. doi: 10.1016/j.neuron.2004.11.016. [DOI] [PubMed] [Google Scholar]
- Nakamura Y, Wood CL, Patton AP, Jaafari N, Henley JM, Mellor JR, Hanley JG. PICK1 inhibition of the Arp2/3 complex controls dendritic spine size and synaptic plasticity. EMBO J. 2011;30:719–730. doi: 10.1038/emboj.2010.357. [DOI] [PMC free article] [PubMed] [Google Scholar]
- Nishiyama M, Hong K, Mikoshiba K, Poo MM, Kato K. Calcium stores regulate the polarity and input specificity of synaptic modification. Nature. 2000;408:584–588. doi: 10.1038/35046067. [DOI] [PubMed] [Google Scholar]
- Peineau S, Taghibiglou C, Bradley C, Wong TP, Liu L, Lu J, Lo E, Wu D, Saule E, Bouschet T, Matthews P, Isaac JT, Bortolotto ZA, Wang YT, Collingridge GL. LTP inhibits LTD in the hippocampus via regulation of GSK3beta. Neuron. 2007;53:703–717. doi: 10.1016/j.neuron.2007.01.029. [DOI] [PubMed] [Google Scholar]
- Riedl SJ, Shi Y. Molecular mechanisms of caspase regulation during apoptosis. Nat Rev Mol Cell Biol. 2004;5:897–907. doi: 10.1038/nrm1496. [DOI] [PubMed] [Google Scholar]
- Riedl SJ, Renatus M, Schwarzenbacher R, Zhou Q, Sun C, Fesik SW, Liddington RC, Salvesen GS. Structural basis for the inhibition of caspase-3 by XIAP. Cell. 2001;104:791–800. doi: 10.1016/S0092-8674(01)00274-4. [DOI] [PubMed] [Google Scholar]
- Roy A, Carpentier P, Bourgeois D, Field M. Diffusion pathways of oxygen species in the phototoxic fluorescent protein KillerRed. Photochem Photobiol Sci. 2010;9:1342–1350. doi: 10.1039/c0pp00141d. [DOI] [PubMed] [Google Scholar]
- Rudel T, Bokoch GM. Membrane and morphological changes in apoptotic cells regulated by caspase-mediated activation of PAK2. Science. 1997;276:1571–1574. doi: 10.1126/science.276.5318.1571. [DOI] [PubMed] [Google Scholar]
- Schile AJ, García-Fernández M, Steller H. Regulation of apoptosis by XIAP ubiquitin-ligase activity. Genes Dev. 2008;22:2256–2266. doi: 10.1101/gad.1663108. [DOI] [PMC free article] [PubMed] [Google Scholar]
- Sebbagh M, Renvoizé C, Hamelin J, Riché N, Bertoglio J, Breard J. Caspase-3-mediated cleavage of ROCK I induces MLC phosphorylation and apoptotic membrane blebbing. Nat Cell Biol. 2001;3:346–352. doi: 10.1038/35070019. [DOI] [PubMed] [Google Scholar]
- Segal M. Morphological alterations in dendritic spines of rat hippocampal neurons exposed to N-methyl-d-aspartate. Neurosci Lett. 1995;193:73–76. doi: 10.1016/0304-3940(95)11665-J. [DOI] [PubMed] [Google Scholar]
- Selkoe DJ. Alzheimer's disease is a synaptic failure. Science. 2002;298:789–791. doi: 10.1126/science.1074069. [DOI] [PubMed] [Google Scholar]
- Serebrovskaya EO, Edelweiss EF, Stremovskiy OA, Lukyanov KA, Chudakov DM, Deyev SM. Targeting cancer cells by using an antireceptor antibody-photosensitizer fusion protein. Proc Natl Acad Sci U S A. 2009;106:9221–9225. doi: 10.1073/pnas.0904140106. [DOI] [PMC free article] [PubMed] [Google Scholar]
- Shen H, Korutla L, Champtiaux N, Toda S, LaLumiere R, Vallone J, Klugmann M, Blendy JA, Mackler SA, Kalivas PW. NAC1 regulates the recruitment of the proteasome complex into dendritic spines. J Neurosci. 2007;27:8903–8913. doi: 10.1523/JNEUROSCI.1571-07.2007. [DOI] [PMC free article] [PubMed] [Google Scholar]
- Sheng M, Sabatini BL, Sudhof TC. Synapses and Alzheimer's disease. Cold Spring Harb Perspect Biol. 2012:4. doi: 10.1101/cshperspect.a005777. [DOI] [PMC free article] [PubMed] [Google Scholar]
- Stennicke HR, Renatus M, Meldal M, Salvesen GS. Internally quenched fluorescent peptide substrates disclose the subsite preferences of human caspases 1, 3, 6, 7 and 8. Biochem J. 2000;350:563–568. doi: 10.1042/0264-6021:3500563. [DOI] [PMC free article] [PubMed] [Google Scholar]
- Stevens B, Allen NJ, Vazquez LE, Howell GR, Christopherson KS, Nouri N, Micheva KD, Mehalow AK, Huberman AD, Stafford B, Sher A, Litke AM, Lambris JD, Smith SJ, John SW, Barres BA. The classical complement cascade mediates CNS synapse elimination. Cell. 2007;131:1164–1178. doi: 10.1016/j.cell.2007.10.036. [DOI] [PubMed] [Google Scholar]
- Suzuki Y, Nakabayashi Y, Takahashi R. Ubiquitin-protein ligase activity of X-linked inhibitor of apoptosis protein promotes proteasomal degradation of caspase-3 and enhances its anti-apoptotic effect in Fas-induced cell death. Proc Natl Acad Sci U S A. 2001;98:8662–8667. doi: 10.1073/pnas.161506698. [DOI] [PMC free article] [PubMed] [Google Scholar]
- Teh C, Chudakov DM, Poon KL, Mamedov IZ, Sek JY, Shidlovsky K, Lukyanov S, Korzh V. Optogenetic in vivo cell manipulation in KillerRed-expressing zebrafish transgenics. BMC Dev Biol. 2010;10:110. doi: 10.1186/1471-213X-10-110. [DOI] [PMC free article] [PubMed] [Google Scholar]
- Varfolomeev E, Blankenship JW, Wayson SM, Fedorova AV, Kayagaki N, Garg P, Zobel K, Dynek JN, Elliott LO, Wallweber HJ, Flygare JA, Fairbrother WJ, Deshayes K, Dixit VM, Vucic D. IAP antagonists induce autoubiquitination of c-IAPs, NF-kappaB activation, and TNFalpha-dependent apoptosis. Cell. 2007;131:669–681. doi: 10.1016/j.cell.2007.10.030. [DOI] [PubMed] [Google Scholar]
- Waldeck W, Mueller G, Wiessler M, Tóth K, Braun K. Positioning effects of KillerRed inside of cells correlate with DNA strand breaks after activation with visible light. Int J Med Sci. 2011;8:97–105. doi: 10.7150/ijms.8.97. [DOI] [PMC free article] [PubMed] [Google Scholar]
- Wang KK, Posmantur R, Nath R, McGinnis K, Whitton M, Talanian RV, Glantz SB, Morrow JS. Simultaneous degradation of alphaII- and betaII-spectrin by caspase 3 (CPP32) in apoptotic cells. J Biol Chem. 1998;273:22490–22497. doi: 10.1074/jbc.273.35.22490. [DOI] [PubMed] [Google Scholar]
- Winder DG, Sweatt JD. Roles of serine/threonine phosphatases in hippocampal synaptic plasticity. Nat Rev Neurosci. 2001;2:461–474. doi: 10.1038/35081514. [DOI] [PubMed] [Google Scholar]
- Wu HY, Hudry E, Hashimoto T, Uemura K, Fan ZY, Berezovska O, Grosskreutz CL, Bacskai BJ, Hyman BT. Distinct dendritic spine and nuclear phases of calcineurin activation after exposure to amyloid-beta revealed by a novel fluorescence resonance energy transfer assay. J Neurosci. 2012;32:5298–5309. doi: 10.1523/JNEUROSCI.0227-12.2012. [DOI] [PMC free article] [PubMed] [Google Scholar]
- Yang JY, Yang WY. Spatiotemporally controlled initiation of Parkin-mediated mitophagy within single cells. Autophagy. 2011;7:1230–1238. doi: 10.4161/auto.7.10.16626. [DOI] [PubMed] [Google Scholar]
- Zhou Q, Homma KJ, Poo MM. Shrinkage of dendritic spines associated with long-term depression of hippocampal synapses. Neuron. 2004;44:749–757. doi: 10.1016/j.neuron.2004.11.011. [DOI] [PubMed] [Google Scholar]
- Zito K, Knott G, Shepherd GM, Shenolikar S, Svoboda K. Induction of spine growth and synapse formation by regulation of the spine actin cytoskeleton. Neuron. 2004;44:321–334. doi: 10.1016/j.neuron.2004.09.022. [DOI] [PubMed] [Google Scholar]