Correction to: Cellular and Molecular Life Sciences 10.1007/s00018-019-03113-5
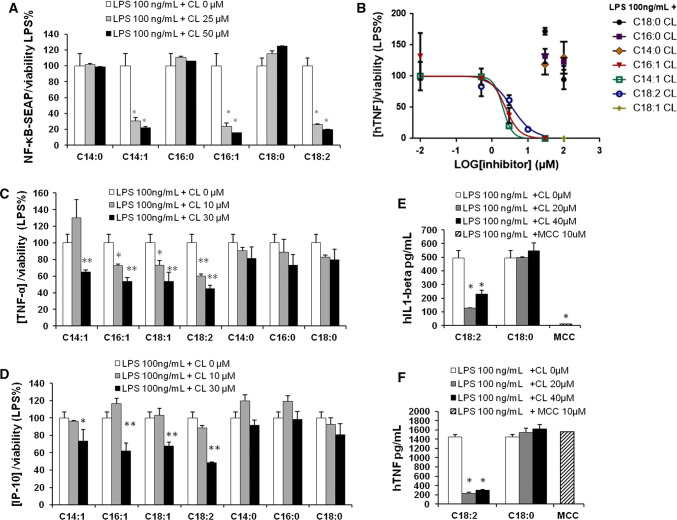
In the published article, the Fig. 2 was published incorrectly. The correct Fig. 2 is given below.
Fig. 2.
Unsaturated but not saturated cardiolipins inhibit 100 ng/mL LPS-dependent pro-inflammatory response. a Murine macrophages RAW-Blue™ cells were incubated 16 h with LPS 100 ng/mL alone (+ CL 0 µM) or together with the indicated amount of each CL, NF-κB activation was quantified in collected supernatants via Quanti-Blue test, normalized on cell viability measured via MTT test and reported here as the percentage of the values measured for LPS in absence of CL (fourfold induction compared to the unstimulated condition). b Primed THP1 cells were incubated for 1 h with the indicated amount of each CL, washed and incubated for 5 h with 100 ng/mL of LPS. TNF-α was quantified in collected supernatants by ELISA assays. c, d Primary BMDMs were incubated 16 h with LPS 100 ng/mL alone or together with the indicated amount of each CL. TNF-α and IP-10 were quantified in collected supernatants by ELISA assays, normalized on cell viability measured via MTT test and reported here as the percentage of the values measured for LPS in absence of CL (2056 pg/mL of TNF-α, 6000 pg/mL of IP-10). e, f Human PBMCs were incubated for 4 h (f) or 16 h (e) with LPS 100 ng/mL alone or together with the indicated amount of each CL or the NLRP3 inhibitor MCC950. TNF-α and IL-1β were quantified in collected supernatants by ELISA assays. Graphs are representative of experiments from five different donors. Each bar represents the mean + standard deviation of three biological replicates (n = 3). Graphs are representative of at least three independent experiments. Unpaired t test: decrease compared to LPS is not significant if p > 0.05 (no symbol); *p ≤ 0.002 (a, e, f), *p ≤ 0.05, **p ≤ 0.021 (c, d)
The original article has been updated.
Footnotes
Publisher's Note
Springer Nature remains neutral with regard to jurisdictional claims in published maps and institutional affiliations.


