Abstract
Early detection of the cancerous process would benefit greatly from imaging at the cellular and molecular level. Increased glucose demand has been recognized as one of the hallmarks of cancerous cells (the “Warburg effect”), hence glucose and its analogs are commonly used for cancer imaging. One example is FDG-PET technique, that led to the use of chemical exchange saturation transfer (CEST) MRI of glucose (“glucoCEST”) for tumor imaging. This technique combines high-resolution MRI obtained by conventional imaging with simultaneous molecular information obtained from the exploitation of agents with exchangeable protons from amine, amide or hydroxyl residues with the water signal. In the case of glucoCEST, these agents are based on glucose or its analogs. Recently, preclinical glucoCEST studies demonstrated the ability to increase the sensitivity of MRI to the level of metabolic activity, enabling identification of tumor staging, biologic potential, treatment planning, therapy response and local recurrence, in addition to guiding target biopsy for clinically suspected cancer. However, natural glucose limits this method because of its rapid conversion to lactic acid, leading to reduced CEST effect and short signal duration. For that reason, a variety of glucose analogs have been tested as alternatives to the original glucoCEST. This review discusses the merits of these analogs, including new data on glucose analogs heretofore not reported in the literature. This summarized preclinical data may help strengthen the translation of CEST MRI of glucose analogs into the clinic, improving cancer imaging to enable early intervention without the need for invasive techniques. The data should also broaden our knowledge of fundamental biological processes.
Keywords: Cancer, chemical exchange saturation transfer (CEST), contrast agent, diagnosis, molecular imaging, MRI
Introduction
Molecular imaging in oncology is defined as the noninvasive imaging of the key molecules essential to the malignant state. Increased glucose demand, even in the presence of ample oxygen (due to mitochondrial dysfunction), called the Warburg effect (1), has been considered one of the fundamental features of malignant cells. Two of the factors contributing to the Warburg effect are the absolute increase in the amount of glucose transported into the cell and its rate of phosphorylation. The first is mediated by transcriptional activation of the glucose transporter gene (GLUT) (2) and the second by the elevation of hexokinase. Both high GLUTs and hexokinase expressions tend to correlate with tumors having high metabolic activity and malignancy. As research in molecular oncology continues to search for a new approach to the detection of the disease, the use of glucose and its analogs as molecular imaging agents seems straightforward. The most common molecular imaging agent in oncology is 2-fluoro-2-deoxy-D-glucose (FDG); FDG as well as 2-deoxy-D-glucose (2DG) are two glucose analogs that are taken up by cells through the glucose transporter and undergo phosphorylation catalyzed by hexokinase to their 6-phosphate form. While their 6-phosphate derivatives cannot be converted by phosphoglucose isomerase, they can be broken down by glucose 6-phosphatase, but this enzyme is markedly downregulated in cancer cells (3). Thus, unlike the natural glucose (D-Glc), they do not proceed through the glycolysis pathway and accumulate in the malignant cells. The enhanced transport and accumulation of FDG in tumors is the basis of radioactive 18F-FDG for positron emission tomography (PET) (4,5), and accounts for its wide clinical use for the diagnosis and monitoring of treatment responses of various kinds of tumors. In the United States alone, more than 1 million patients a year are imaged with 18F-FDG PET. The technique has its limits, however: the radiation exposure limits the scan frequency of the 18F-FDG-PET method and excludes certain patient groups; 18F-FDG PET suffers from low spatial and temporal resolutions; and the procedure is expensive. Clearly, the limits of 18F-FDG PET imaging call for a different clinical application for the detection of new and recurrent tumors and monitoring of treatment response.
Molecular imaging has the potential to enable a quantitative and precise index for these requirements via imaging of biomarkers. Metabolic-based molecular imaging is already used for detecting tumors and metastases (6,7), and the continuing development of molecular targeted contrast agents for non-nuclear imaging is expanding the spectrum of clinical molecular imaging applications. Developing MRI techniques with increased sensitivity to levels of nonradioactive glucose analogs hold promise of more rapid detection of tumors, increased safety, lower costs, and, possibly, repeated use without fear of toxicity.
Chemical exchange saturation transfer (CEST) MRI of glucose (“glucoCEST”), which combines high-resolution MRI obtained by conventional imaging with simultaneous molecular information, has generated increased interest lately (8). The technique enables the exploitation of agents with exchangeable protons from amine (9-12), amide (13-15) or hydroxyl (16-20) residues (in the case of glucoCEST, these agents are based on glucose or its analogs). The technology of CEST MRI has been recognized as a means of generating new contrast in magnetic resonance imaging with potential practicality in the clinic (21). CEST MRI technique has been demonstrated to increase the sensitivity of MRI to the level of metabolic activity (22,23), enabling identification of tumor stage, therapeutic response, local recurrence, more precise treatment planning, and utility for guiding biopsy in cancers. For more technical details on the CEST MRI technique, readers are referred to several reviews (24-26). In this work, we reviewed recent studies that assess glucose analogs as novel MRI contrast with the CEST technique. We also evaluated new data on several novel glucose analogs in order to increase the horizon of possibilities and give the opportunity to choose the best agent that will be used on the clinic.
Methods
In vitro studies
Solutions
Glucose analogs were prepared in 10 mM phosphate-buffered saline (PBS) containing 10% D2O (99.98%, Biolab, Israel). Each sample was inserted into a 5 mm tube for 1H NMR spectroscopy.
NMR spectroscopy
NMR spectra were acquired on a Bruker DRX 11.7T spectrometer, de-tuned to avoid radiation damping effects. Acquisition parameters were as follows: Acquisition time and relaxation delay were 2 and 14 s, respectively. Spectral width was 5 KHz, data size 16 K, number of scans 8. A CW saturation pulse of 3 s with attenuation of 2.5 µT was employed at a series of frequencies (Ω) in the range of ±4.5 ppm relative to the water signal (0 ppm). Data was recorded and processed using TOPSPIN 3.0 software (Bruker).
The CEST was measured by magnetization transfer asymmetry (MTRasym) (27) accordingly:
| CEST (Ω)= [MSAT(−Ω)-MSAT(Ω)]/M0 | [1] |
where MSAT(Ω) and MSAT(−Ω) are the signal intensity with RF saturation at Ω and −Ω, respectively, and M0 is the signal intensity without RF saturation.
Preparation of extracts from tumors
Extracts of brains and tumors were prepared by the methanol/CHCl3/H2O extraction method (28).
NMR spectroscopy of extracts
13C NMR spectra of the extracts were recorded at 125.76 MHz using a Bruker DRX 11.7T spectrometer. Acquisition parameters were as follows: spectral width 16.5 KHz, data size 32 K, pulse width 5 µs, relaxation delay 5 s, acquisition time 1.6 s. 31P NMR spectra of the extracts were recorded at 202 MHz using a Bruker AVANCE3 11.7T spectrometer. Acquisition parameters were as follows: spectral width 2.0 KHz, data size 32 K, pulse width 6 µs, relaxation delay 4 s, acquisition time 1.6 s.
In vivo studies
CEST MRI protocol
A Bruker 7T BioSpec scanner with 30 cm bore size was used to scan implanted xenograft mammary tumors of mice [protocols for cell cultures and orthotopic mammary fat pad implantation are described in detail in reference (29)]. Mice bearing breast tumors were scanned before and after administration (IV, IP or PO) of glucose analogs (dissolved in saline) following overnight fasting with water access. Animals were anesthetized with isoflurane (1–2%) during the scan and body temperature was maintained at 37 °C.
T2 RARE anatomical images (a series of 1 mm coronal slices of the abdominal area with acquisition matrix of 128×128, FOV 28.8–40 mm2, RARE factor 8, TR 3,000 ms, TE 11.7 ms) were acquired to identify the slice presenting the maximum tumor size.
Before CEST, A B0 field map was obtained. The CEST images were generated as follows: a series of T2 RARE images (RARE factor 8, TR 3,000 ms, TE 11.7 ms) were collected from a single 1 mm coronal slice of the abdominal area after a continuous wave saturation pulse (B1=2.4 µT, tsat=2 s). Two protocols of CEST scans were used: (I) Dynamic glucoCEST MRI experiment: CW pulse at a specific proton frequency offset (Ω) of ±1.2 ppm (relative to the water signal) over time. (II) Z spectra experiment: CW pulse at a series of frequency offsets in the range of ±5 ppm (relative to the water signal). CEST images were acquired before and up to 1.5 h after the glucose analog administration.
All experiments with animal models were carried out according to the guidelines of the Israel National Research Council (NRC) and were approved by the Tel Aviv University Institutional Animal Care and Use Committee (0-15-057).
MRI data analysis
Data was processed using custom-written scripts in MATLAB. The mean intensities in the selected region of interest (ROI) of the tumor were used for the % CEST plot, based on the conventional T2 images.
Review
CEST of glucose analogs that are amenable to phosphorylate by the hexokinase
The imaging of D-Glc with the CEST MRI method was recently demonstrated and suggested to be useful for cancer diagnosis (18,30-33). However, its rapid conversion to lactic acid by glycolysis and consequent low CEST signal (18,20,30) and short duration of glucoCEST enhancements pose a serious obstacle to its clinical application. For that reason, a variety of glucose analogs have been tested as alternatives to the original glucoCEST.
CEST MRI of 2DG and FDG give enhanced and stable CEST contrast for more than an hour after administration of the agent (19,20) (Figure 1). Clinical trials on the diagnostic and therapeutic efficacy of 2DG examined it alone or in combination with other therapeutic modalities (34). For example, in phase I/II trials with 2DG in patients with castrate-resistant prostate cancer (35), or a phase I trial of 2DG alone or combined with docetaxel in patients with advanced solid tumors (36). In clinical trials that used 2DG to improve the efficacy of radiotherapy, 200–300 mg of the analog per kg body weight were administered orally after overnight fasting, with minor or no side effects (37). FDG is mostly known for its isotopic form 18FDG for PET examination, with no reports of safety-related concerns. The LD50 for FDG was 600 mg/kg in mice and rats injected IP (38). Mice injected IP with 14.3 mg/kg exhibited no abnormality in the brain, heart, spleen, liver, kidneys or lungs (39). Due to the toxicity of 2DG and FDG at high concentration, they cannot be used for human cancer diagnosis and should be limited to laboratory animals. However, there is a suggestion that 2DG may be considered for human diagnosis if delivered after encapsulation in liposomes (40).
Figure 1.
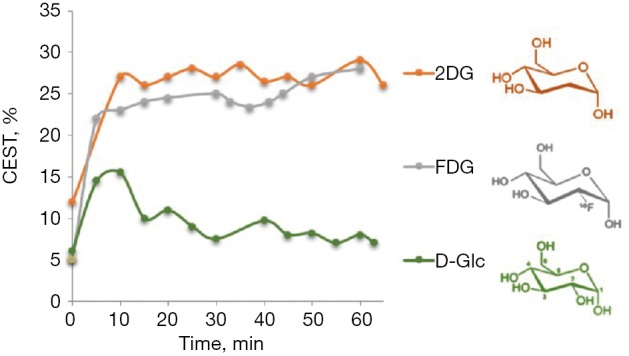
CEST MRI kinetic measurements in D1-DMBA-3 breast tumors at different times following IV injections of 1.0 g/kg of 2DG/FDG and 1.5 g/kg of D-Glc (20). CEST, chemical exchange saturation transfer; 2DG, 2-deoxy-D-glucose; FDG, 2-fluoro-2-deoxy-D-glucose; D-Glc, D-glucose.
Dextran (41,42), sucralose (43) and sucrose (44) were demonstrated in vivo for cancer detection in laboratory animals, based on the contrast obtained by the hydroxyl peaks of these sugars (with a broad CEST signal at around 1 ppm). The possibility to image cancer cells with several branched and unbranched polysaccharides (whose size is determined by the number of repeating glucose units, such as glycogen or glycosaminoglycans) was also examined (16,45-47), but since most of them deal with the use of endogenous substances for CEST MRI, they are beyond the scope of this review.
The ability to image tumors by glucosamine (GlcN) or N-acetyl-glucosamine (GlcNAc) CEST MRI was demonstrated in several tumor-bearing mice models (44,48). The method differentiated among tumor aggressiveness as well as detected metastasis (48), similar to the FDG-PET technique (49). In addition to the known non-toxicity and excellent safety profile (as a common food supplement) of GlcN compared to other glucose analogs, it does not affect blood glucose levels or insulin sensitivity, making it useful for a broader population that includes diabetic patients and those sensitive to glucose levels (50-55). Another advantage of GlcN is the fact that, unlike other glucose analogs whose hydroxyl protons have a small chemical shift relative to the water signal (~1.2 ppm), GlcN can be detected for its amino peak, which yields a significant CEST contrast that is relatively far from the water signal (~2–3 ppm). This increases its possibility to be detected by low-field clinical scanners.
GlucoCEST vs. environmental factors
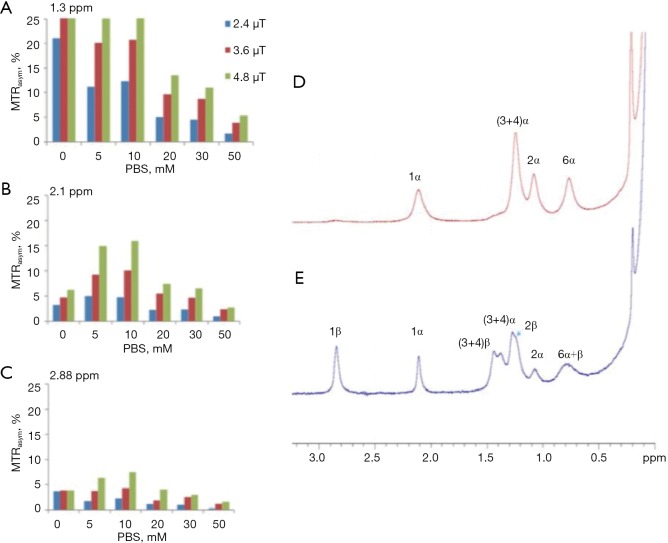
Other glucose analogs were explored for their ability to detect cancer cells using CEST NMR/MRI techniques. However, as the CEST signal is critically dependent on proton exchange rates, as well as other parameters such as the relaxation times of the water and the metabolite and the pH of the local environment, the translation of the in vitro CEST effect to the in vivo one is not straightforward. A major factor that determines the proton exchange rate, in addition to the pH, is the type and concentration of the buffer solution. The dependence of the CEST effect of D-Glc on the phosphate buffer concentration is illustrated by an experiment we conducted (Figure 2A,B,C). The dramatical change in the MTRasym at the typical frequency offsets of the hydroxyl peaks (their full assignment is given in Figure 2D,E) due to buffer modification highlights the challenge of locating the original agent effect. The assignment of the hydroxyl protons of D-Glc was given previously (56).
Figure 2.
Bar graph showing % of MTRasym of 20 mM D-Glc solution (10% D2O) at several PBS concentrations at the typical frequency offsets of the hydroxyl peaks (A) 1.3 ppm, (B) 2.1 ppm and (C) 2.88 ppm from the water peak (T=37 °C, 11.7T). (The peak at 0.66 ppm that belongs to the hydroxyl peak at the 6-position of D-Glc was not included in the MTR calculations because of its proximity to the water signal.) 1H NMR spectra of the hydroxyl protons of 0.1 M D-Glc solution (T=4 °C, pH=5.4, 11.7T). Spectra were recorded on a fresh sample (D) and several hours after the sample preparation (E). MTRasym, magnetization transfer asymmetry.
Accordingly, the ideal glucose analog for CEST MR imaging must meet the criteria of a high CEST or exchange-related effect, high uptake by tumors, and low or no toxic effects. Several glucose analogs examined in vitro in our lab that produced barely any CEST signal (at physiological conditions: pH~7, T=37 °C) were not tested in vivo (Figure 3), including kanamycin A, streptozotocin and 3-amino-3-deoxy-D-glucose (Figure 3). The most promising glucose analogs were evaluated for their sensitivity in vivo in a murine tumor model.
Figure 3.
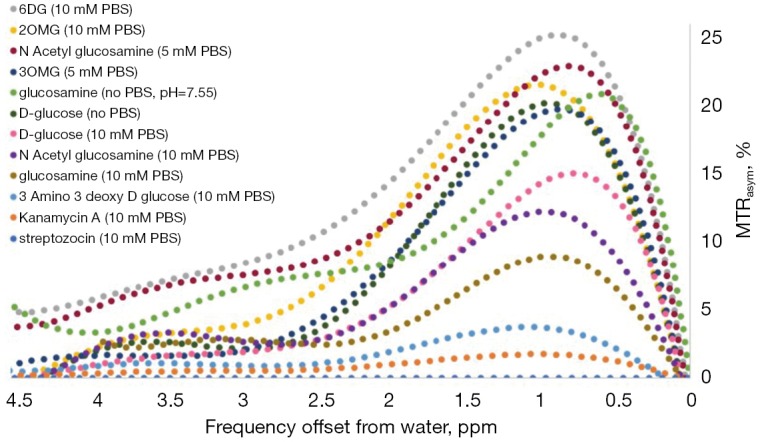
Comparison of in vitro chemical exchange saturation transfer (CEST) MRI of glucose (“glucoCEST”) NMR signals of several glucose analogs. Solutions of 20 mM were measured at T=37 °C, saturation pulse duration of 3 s, and attenuation of 2.4 µT, at the 11.7T (Rivlin M, 2018, unpublished results). MTRasym, magnetization transfer asymmetry.
CEST of glucose analogs that are not phosphorylated by the hexokinase
Glucose analogs that are transported by the GLUTs but not phosphorylated by the hexokinase are expected to be non-toxic since they are not metabolized and are excreted unchanged by the kidney. Examples are 3-O-Methyl-D-glucose (3OMG), 2-O-Methyl-D-glucose (2OMG), and 6-deoxy-D-glucose (6DG). The absence of 6-phospho-O-Methyl-D-glucose in implanted murine R1F-1 tumors following IV administration of 3OMG was demonstrated by both 13C and 31P NMR spectroscopy (57). Figure 4 shows the same results for 3OMG on murine brains.
Figure 4.
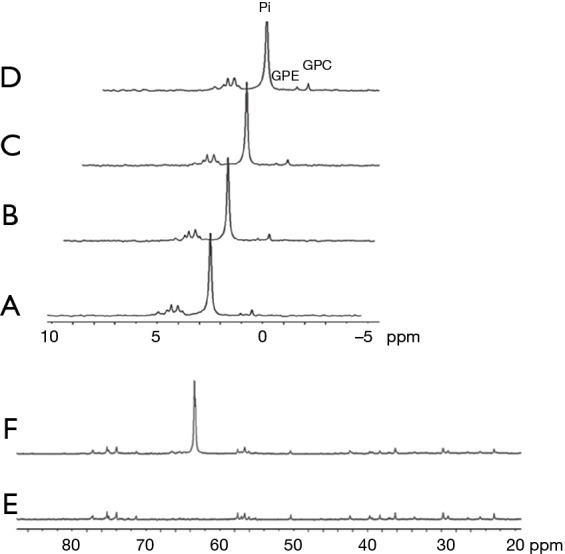
1H-decoupled 31P NMR spectra of metabolites extracted from brains of mice bearing 4T1 tumors. (A) and (B) are extracts from control brains (without treatment). (C) and (D) are extracts from brains of mice administrated [6-13C] 3-O-Methyl-D-glucose (3OMG) [1.0 g/kg, per-os (PO)]. The peaks were referenced to GPC (0.49 ppm). Each spectrum represents a single specific brain of a mouse. The peaks were assigned according to previously published data: GPC, glycerphosphocholine; GPE, glycerphosphoethanolamine; Pi, inorganic phosphate. As no metabolic phosphorylated products were obtained, no peaks were observed around 5.1 ppm. 1H-decoupled 13C NMR spectra of metabolites extracted from brains of mice bearing 4T1 tumors. (E) is an extract from the control brain (without treatment) and (F) is an extract from the brain of mice administrated [6-13C] 3OMG (1.0 g/kg, PO). Each spectrum corresponds to overnight data accumulation and represents a single specific brain of a mouse. The resonance of [6-13C] 3OMG is shown at 63.3 ppm in spectra (F). The peaks were referenced to DSS (0 ppm). As no metabolic phosphorylated products were obtained, no peaks were observed around 66 ppm (Rivlin M, 2018, unpublished results). More details regarding the extracts procedure can be found at Rivlin et al. (29).
Significant CEST MRI signals of 3OMG were recently demonstrated for several breast cancer models of murine and human origin, as well as for malignant brain tumors (29,58,59). 3OMG is generally considered nontoxic (57,60-62), but detailed studies of its toxicity are lacking. Its use produced no behavioral effects in rats when given injections of up to 4 g/kg of 3OMG (63); in pediatric patients given orally as 1 mL/kg of a solution containing 30 mg/mL of 3OMG (64,65); and in adult fasting patients given oral doses of 2.5 g together with a combination of several sugars (66-68). The glucose transporter affinity of 3OMG is mainly facilitated through GLUT1 and GLUT3 transporters; it competes with D-Glc for access to these transporters in the brain (69).
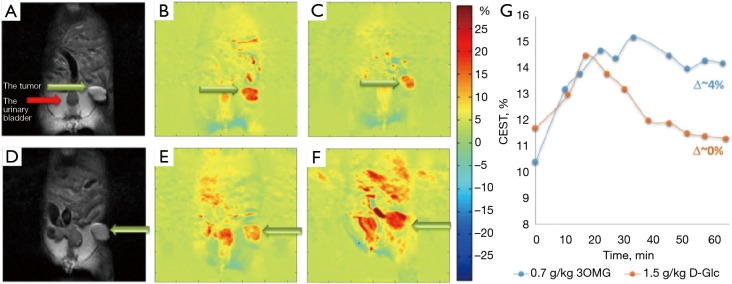
A comparison of the in vivo 3OMG CEST method with glucoCEST on implanted 4T1 breast tumors in mice (Figure 5) points to a CEST contrast enhancement that is considerably higher and longer lasting than that of D-Glc for the same detected tumor (29).
Figure 5.
3-O-Methyl-D-glucose (3OMG) chemical exchange saturation transfer (CEST) vs. CEST MRI of glucose (glucoCEST) kinetics measurements in 4T1 breast tumor model in the same animal. (A) An anatomical T2-weighted image before D-glucose administration. (B,C) CEST map before (B) and ~60 min after (C) Per os (PO) treatment with D-Glc, 1.5 g/kg (at frequency offset of 1.2 ppm, B1=2.4 µT). No remarkable CEST contrast was obtained in the tumor vis-a-vis the baseline. (D) An anatomical T2-weighted image before 3OMG administration. (E,F) CEST map before (E) and ~60 min after (F) PO treatment with 3OMG, 0.7 g/kg (at frequency offset of 1.2 ppm, B1=2.4 µT). Approximately 4% CEST was obtained in the tumor with reference to the baseline. Green arrows point to the tumor, the red arrow to the urinary bladder. (G) The time series of the % CEST achieved in 4T1 tumor following treatment with D-Glc (1.5 g/kg) vs. 3OMG (0.7 g/kg). Figure taken with permission from (29).
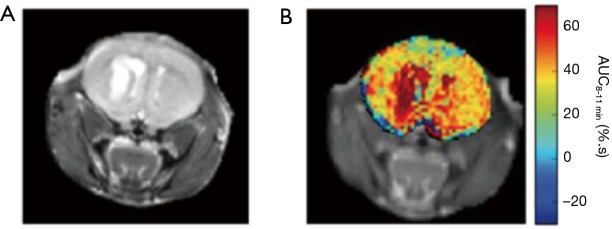
For glioma xenograph of U87-MG cell line (Figure 6), the CEST effect of 3OMG was approximately twice that of D-Glc for a similar tumor line (59).
Figure 6.
3-O-Methyl-D-glucose (3OMG) chemical exchange saturation transfer (CEST) MRI of malignant brain tumor. (A) Anatomical image of the mouse brain. (B) The area under the curve image calculated for the last three minutes of the CEST scan (using a single CW magnetization transfer prepulse of strength 1.5 µT and duration 2 s), a period of 8–11 min post injection of 3OMG (3 g/kg, 1.9M, 200 mL). Figure taken with permission from (59).
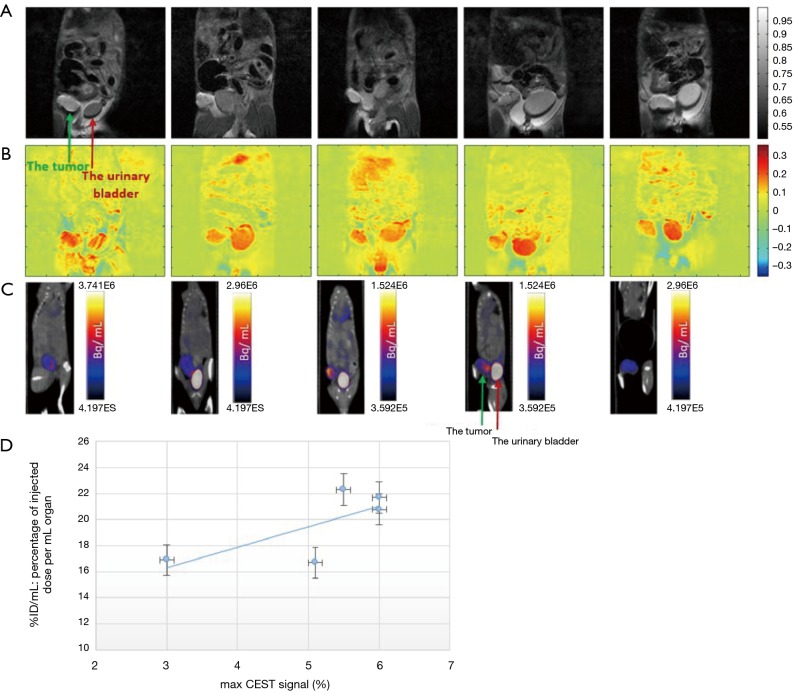
Accumulation of 3OMG in brain (70) and brain bearing 9L glioblastma tumors (71) has been detected by Spin-lock imaging (CESL). To fully explore the potential of this new technology, we compared the tumor metabolism achieved by the 3OMG CEST method and the gold standard 18FDG-PET. The PET effect is measured by the percent of radioactivity from the injected dose per ml (% ID/mL) that accumulated in the target. The CEST and PET parameters were evaluated in the same tumor model of murine breast cancer, 4T1 tumor cells, following acquisition by the two methods [For more details on the methodology see (29)]. The two methods showed similar trends, as evidenced by the good agreement between their tumor uptake results: the % CEST contrast and % ID/mL of 18FDG uptake by the tumor, as illustrated in Figure 7. A correlation analysis was performed on both maximum MRI-based and PET-based estimates. Furthermore, 4T1 tumors are known to metastasize from the primary tumor in the mammary gland to multiple distant sites including blood, lungs and liver. Accordingly, in some of the animals, in correlation with the results of the 3OMG CEST MRI method, significant 18FDG accumulation could also be seen in the liver, presumably due to metastasis (Figure 7, middle example). These results provide a clear validation of the 3OMG CEST method.
Figure 7.
3-O-Methyl-D-glucose (3OMG) chemical exchange saturation transfer (CEST) MRI and 18FDG PET/CT images from five tumors of a murine model (4T1 cells). (A) A coronal view of an anatomical T2-weighted MR images (7T field) before 3OMG administration showing the tumor (green arrow) and the urinary bladder (red arrow). (B) % CEST images 60 min after PO administration with 3OMG, 1.0 g/kg (at a frequency offset of 1.2 ppm, B1=2.4 µT). A significant CEST contrast was obtained in the tumor and the urinary bladder as well as areas suspected to be metastases. (C) 18FDG PET/CT coronal view obtained 60 min after IV injection of 18FDG showing accumulation mainly in the tumor (green arrow) and urinary bladder (red arrow). (D) Correlation between 3OMG % CEST contrast and % ID/mL value in the five tumors from a murine model ± SD. The CEST and PET/CT measurements were performed 8 and 10 days after implantation of the tumors, respectively (29).
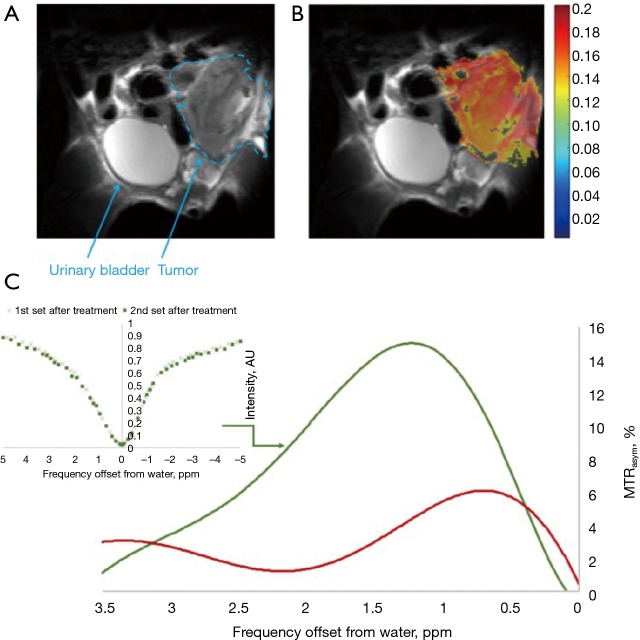
Other non-phosphorylated glucose analogs were examined as potential CEST contrast agents to image cancer cells (Rivlin M, 2018, unpublished results), with promising results. One is 6-deoxy-D-glucose (6DG), which, similar to 3OMG, cannot be phosphorylated by hexokinase due to the absence of oxygen at its 6-carbon (72). Unlike 3OMG that shows specificity mostly to two main GLUT transporters, GLUT1 and GLUT3, 6DG has a good affinity and high specificity for the D-Glc transporter system (73). In vivo 6DG CEST MRI measurements were performed with a Bruker 7T Biospec scanner on implanted orthotopic mammary tumors of mice, using a methodology described previously (29). A representative result is shown in Figure 8. 6DG CEST MRI yielded a significant contrast with a maximum net signal (of ~10% above the baseline) at about 1.2 ppm from the water signal (Figure 8C). As no metabolic products were observed over time, the same CEST effect was achieved for two-time series of Z spectra that were sampled simultaneously and alternately.
Figure 8.
In vivo 6DG CEST MRI measurements in a 4T1 tumor (7T field). (A) A T2-RARE anatomical image before administration of the agent; (B) MTRasym image at 1.2 ppm following treatment with 6DG (2.0 g/kg, IP), overlaid onto the T2 anatomical image; (C) The MTRasym plots for 4T1 tumor before (red curve) and after treatment (green curve) with 6DG. In the inset: full Z spectra for 4T1 tumor at 2 time periods following administration of 6DG. Total estimated time of scan was 80 min for CW pulses of 2 s duration and attenuation of 2.5 µT (106 Hz) at 106 frequencies offsets that were divided into two series and sampled alternately and simultaneously. The mean intensities in the selected ROI in the tumor were used for the MTRasym plot. B0 inhomogeneity corrections were made (Rivlin M, 2018, unpublished results).
In a recent international workshop on CEST imaging [2019], Jin et al. (74) demonstrated that glucoCEST MRI could also be performed with D-xylose, an analog of D-Glc that also lacks the free hydroxyl group at carbon 6 where phosphorylation by hexokinase takes place. They described the uptake of D-xylose in rat brains with a model of 9L tumors at the 9.4T. However, unlike 6DG, which also lacks the free hydroxyl group at carbon 6, D-xylose cannot be considered a nonmetabolized glucose analog. Huntley and Patience (75) reported about several possible routes for D-xylose metabolism:
Oxidation by D-xylose dehydrogenase to D-xylonic acid. D-xylose dehydrogenase has been identified and purified in pig liver as well as in monkey kidney, dog liver, and rabbit lens. The authors point to data supporting the view that xylose oxidation to CO2 can involve conversion to xylonic acid and subsequent decarboxylation.
Reduction of D-xylose by aldose reductase to D-xylitol, which is then converted to D-xylulose and can be metabolized through the pentose phosphate pathway.
Metabolism of xylose to threitol, a urinary metabolite. The authors (75) described healthy patients dosed with D-xylose in whom 15% of the xylose excreted in the urine was recovered as D-threitol within 5 h post-dosing; this proportion rose when the collection time was extended to 24 h. Moreover, no xylose was found in the urine when excretion was delayed. In addition, xylose has been reported to inhibit sucrose activity leading to decreased post-prandial blood glucose and insulin levels.
Romano and Connell (73) reported that the uptake curves of 6DG and D-xylose by 3T3 cells (that mimic connective tissues) were similar, and both reached a steady state level within 10 min following treatment. Nevertheless, while 6DG was well transported in a system of intestinal cells, D-xylose was not, showing a 100-fold decrease in apparent affinity for that cell system (76). Based on these data, only 6DG and not D-xylose by 3T3 cells can serve as a CEST MRI agent for the detection of cancer cells. It should be considered an alternative to 3OMG in those cell systems where 3OMG shows limitations in usefulness.
Another non-phosphorylated glucose analog that was investigated in our lab is 2-O-Methyl-D-glucose (2OMG). Unlike D-Glc, it has less β anomer at equilibrium in natural conditions of pH (77) [essential information for designing in vivo CEST experiments (78)], and there are no detailed studies of its pharmacokinetics. Thus, we performed high-resolution 31P NMR spectroscopy studies to explore its metabolism. Mice bearing 4T1 tumors were sacrificed at about 45 min after 2OMG administration (IV and PO, n=4), and organs were taken for 31P NMR analysis following the procedure of methanol-chloroform-water extraction (28,29). 31P NMR spectroscopy studies displayed its inability to undergo phosphorylation as no phosphorylated products were observed (Figure 9). Phosphorylated products were expected to appear at about 5.1 ppm.
Figure 9.
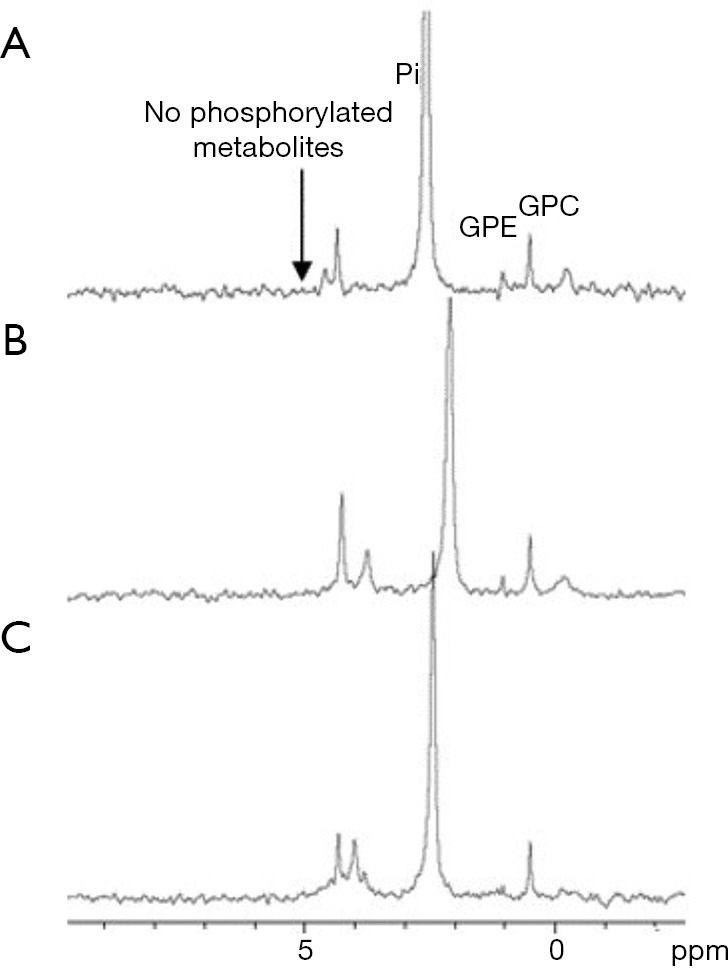
1H-decoupled 31P NMR spectra of extracts from 4T1 tumors (A) untreated and (B) and (C) treated with 2.6 g/kg (PO) and 2.0 g/kg (IV) of 2OMG, respectively. The peaks were assigned according to previously published data (79): GPC, glycerophosphocholine; GPE, glycerophosphoethanolamine; Pi, inorganic phosphate. The spectra were calibrated according to GPC (0.49 ppm). Rivlin M, 2018, unpublished results.
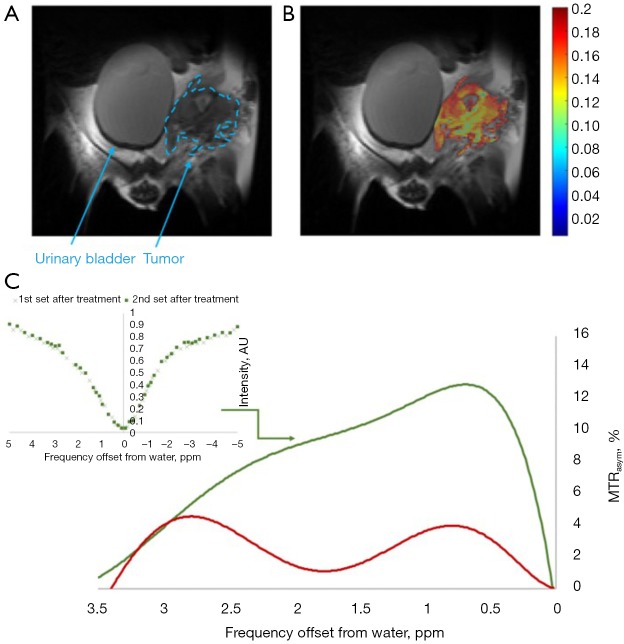
In vivo 2OMG CEST MRI measurements (using the same methodology described above for 6DG) yielded a significant contrast of up to 9% at around 1 ppm from the water signal. A representative result is shown in Figure 10. As no metabolic products were observed over time, like in the case of 6DG, the same CEST effect was achieved for two-time series of Z spectra that were sampled simultaneously and alternately. One of the most prominent advantages of using 2OMG or 6DG CEST MRI stems from their greater sensitivity to regional differences in tumor uptake (only the metabolically active part of the tumor exhibits enhanced CEST effect; examples are shown in Figure 8B and Figure 10B).
Figure 10.
In vivo 2OMG CEST MRI measurements in a 4T1 tumor (7T field). (A) A T2-RARE anatomical image before administration of the agent; (B) MTRasym image at 1.0 ppm following treatment with 2OMG (3 g/kg, IP), overlaid onto the T2 anatomical image; (C) The MTRasym plots for 4T1 tumor before (red curve) and after treatment (green curve) with 2OMG. In the inset: full Z spectra for 4T1 tumor at two-time periods following administration of 2OMG; total estimated time of scan was 80 min (same CEST protocol as described in Figure 8 caption). Rivlin M, 2018, unpublished results.
The available data on the in vivo CEST-MRI of glucose analogs is summarized in Table 1.
Table 1. The available data on the in vivo CEST-MRI of glucose analogs.
| Glucose analog | Model1 | Chemical shift (ppm) | Mode of administration | Administrated dose2 | % CEST | Undergo metabolism | References |
|---|---|---|---|---|---|---|---|
| 2-deoxy-D-glucose (2DG) | Breast tumors D1-DMBA-3 | 1.2 | IV | 2.0 g/kg | 20 | + | (20) |
| Rat brains | 1.2 | IV | 1.0 g/kg | 2 | + | (19) | |
| 2-fluoro-2-deoxy-D-glucose (FDG) | Breast tumors D1-DMBA | 1.2 | IV | 1.0 g/kg | 18 | + | (20) |
| Dextran | Colon tumors CT26 | 0.9 | IV | 0.375 g/kg (10 kD) | 7 | + | (41) |
| Sucralose | 9L glioma | 1.0 | IV | 200 mM, 0.2 mL/min | 4.8 | + | (43) |
| Sucrose | Breast tumors TS/A and B16 | 0.7–1.2 | IV | 1.2 g/kg | 5 | + | (44) |
| Glucosamine (GlcN) | Breast tumors 4T1 | 1.2 | PO | 0.38 g/kg | 4 | + | (29) |
| Breast tumors MCF7 | IV | 1.0 g/kg | 4.5 | ||||
| Breast tumors MCF7 | PO | 1.0 g/kg | 5.5 | ||||
| N-Acetyl glucosamine (GlcNAc) | Breast tumors TS/A and B16 | 0.7–1.2 | IV | 1.2 g/kg | 3.5 | + | (44) |
| Breast tumors 4T1 | 1.2 | IV | 1.1 g/kg | 6.5 | + | (48) | |
| Breast tumors 4T1 | PO | 1.0 g/kg | 6 | (48) | |||
| Kanamycin A | Insufficient in vitro CEST signal | 1.2 | – | + | (Rivlin M, 2018, unpublished results) | ||
| Streptozotocin | Insufficient in vitro CEST signal | 1.2 | – | + | (Rivlin M, 2018, unpublished results) | ||
| 3-amino-3-deoxy-D-glucose | Insufficient in vitro CEST signal | 1.2 | – | + | (Rivlin M, 2018, unpublished results) | ||
| D-xylose | 9L glioma | – | IV | 1.0 g/kg | + | (74) | |
| 3-O-Methyl-D-glucose (3OMG) | Breast tumors D1-DMBA-3 | 1.2 | IP | 1.5 g/kg | 20.7 | − | (20) |
| Breast tumors 4T1 | IV, IP, PO | 0.7 g/kg | 4.0–4.4 | (29) | |||
| Breast tumors 4T1 | PO | 1.0 g/kg | 6 | (29) | |||
| Breast tumors MCF7 | PO | 1.0 g/kg | 5 | (29) | |||
| Breast tumors MDA-MB-231 | PO | 1.0 g/kg | 4 | (29) | |||
| Glioma tumors U87-MG | 1.2 | IV | 3.0 g/kg | 5 | − | (59) | |
| 2-O-methyl-D-glucose (2OMG) | Breast tumors 4T1 | 1.2 | IP | 2.0 g/kg | 10 | − | (Rivlin M, 2018, unpublished results) |
| 6-deoxy-D-glucose (6DG) | Breast tumors 4T1 | 1.0 | IP | 3.0 g/kg | 9 | − | (Rivlin M, 2018, unpublished results) |
1, tumor cells implanted in mice unless specified otherwise; 2, minimal dose tested.
Discussion
There are several reasons to search for glucose analogs for cancer diagnosis in addition to, or as a replacement for glucoCEST with natural glucose. A major one is to enhance the CEST effect by eliminating the rapid conversion to lactic acid by glycolysis. Another is to reduce the effect on insulin levels, removing a barrier to glucoCEST with glucose in many patients.
A main question to be addressed is the safety and lack of adverse effects of the analog. GlcN is a good candidate in this regard: its wide use as a food additive eliminates the need for further toxicity testing, and it showed no effect on insulin levels (50-55), even following IV injection of large doses (50,51). As for the nonmetabolized agents, 3OMG has already been given IV to pediatric patients (64,65) and by oral administration to adult fasting patients (66-68). Because the lack of toxicity of 3OMG is likely to result from the fact that it does not undergo phosphorylation by hexokinase, it is possible to assume that other nonmetabolizable agents such as 2OMG and 6DG will also exhibit no toxicity. Hence, glucose analogs that are not phosphorylated by hexokinase appear to be highly promising for imaging of cancer by the CEST MRI technique.
One advantage of using glucose analogs is their low molecular weight (~200 g/mole) and their solubility in water. Another consideration is the optimal time to perform the glucoCEST examination. The analog needs time to accumulate in sufficient amount in the ROI to generate contrast, after which it should be completely eliminated by being nonmetabolized and excreted through the kidneys, or by metabolism to other metabolites that produce CEST effect such as in the case of GlcN. This is in contrast to the gadolinium-based contrast agents, which showed signs of accumulation following a number of repeated examinations (80). The CEST MRI examination protocol for each glucose analog should be checked independently for its pharmacokinetics and bio-distribution profile, which will depend on the method of administration (IV, or PO) and its particular metabolism.
Conclusions
The findings of the preliminary studies described here point to the potential of CEST MRI with glucose analogs as a highly sensitive and adaptable molecular imaging technology. The noninvasive glucoCEST MRI method offers advantages over currently available clinical imaging modalities, not only for detecting and monitoring the progression of tumors, but also for assessing their response to therapy. Unlike the conventional MRI morphological images, glucoCEST MRI technique enables distinguishing between the active parts of the tumor and visualizing its heterogeneity. The advantage of this method can be clearly seen by monitoring the patient after treatment with, for instance, chemotherapy, and comparing the obtained glucoCEST contrast to pre-treatment glucoCEST scans as well as to nonmalignant/normal tissues, all while avoiding exposing the patient to radiation. The potential translational applications of CEST MRI with glucose analogs hold great promise for cancer disease, and perhaps for other diseases as well.
Acknowledgments
The authors gratefully acknowledge the support of this research by the Israel Science Foundation (ISF), and the European Union Horizon 2020 research and innovation program under Grant Agreement No. 667510. We thank the Strauss Center for Computational Neuroimaging, the Sackler Institute for Biophysics at Tel Aviv University.
Footnotes
Conflicts of Interest: M.R. and G.N. are the inventors listed on patents that develop glucose analogs for CEST MRI techniques: WO-2015145447-A3 and WO2017090047A1.
References
- 1.Warburg O. On the origin of cancer cells. Science 1956;123:309-14. 10.1126/science.123.3191.309 [DOI] [PubMed] [Google Scholar]
- 2.Adekola K, Rosen ST, Shanmugam M. Glucose transporters in cancer metabolism. Curr Opin Oncol 2012;24:650-4. 10.1097/CCO.0b013e328356da72 [DOI] [PMC free article] [PubMed] [Google Scholar]
- 3.Larson SM. F-18-FDG imaging: Molecular or functional? J Nuc Med 2006;47:31-2. [Google Scholar]
- 4.Kelloff GJ, Hoffman JM, Johnson B, Scher HI, Siegel BA, Cheng EY, Cheson BD, O'shaughnessy J, Guyton KZ, Mankoff DA, Shankar L, Larson SM, Sigman CC, Schilsky RL, Sullivan DC. Progress and Promise of FDG-PET Imaging for Cancer Patient Management and Oncologic Drug Development. Clin Cancer Res 2005;11:2785-808. 10.1158/1078-0432.CCR-04-2626 [DOI] [PubMed] [Google Scholar]
- 5.Belhocine T, Spaepen K, Dusart M, Castaigne C, Muylle K, Bourgeois P, Bourgeois D, Dierickx L, Flamen P. 18FDG PET in oncology: the best and the worst. Int J Oncol 2006;28:1249-61. [PubMed] [Google Scholar]
- 6.Kircher MF, Willmann JK. Molecular body imaging: MR imaging, CT, and US. part I. principles. Radiology 2012;263:633-43. 10.1148/radiol.12102394 [DOI] [PMC free article] [PubMed] [Google Scholar]
- 7.Kircher MF, Willmann JK. Molecular body imaging: MR imaging, CT, and US. Part II. Applications. Radiology 2012;264:349-68. 10.1148/radiol.12111703 [DOI] [PubMed] [Google Scholar]
- 8.Ward KM, Aletras AH, Balaban RS. A new class of contrast agents for MRI based on proton chemical exchange dependent saturation transfer (CEST). J Magn Reson 2000;143:79-87. 10.1006/jmre.1999.1956 [DOI] [PubMed] [Google Scholar]
- 9.Jin T, Wang P, Zong X, Kim SG. Magnetic resonance imaging of the Amine–Proton EXchange (APEX) dependent contrast. NeuroImage 2012;59:1218-27. 10.1016/j.neuroimage.2011.08.014 [DOI] [PMC free article] [PubMed] [Google Scholar]
- 10.Cai K, Haris M, Singh A, Kogan F, Greenberg JH, Hariharan H, Detre JA, Reddy R. Magnetic resonance imaging of glutamate. Nat Med 2012;18:302. 10.1038/nm.2615 [DOI] [PMC free article] [PubMed] [Google Scholar]
- 11.Harris RJ, Cloughesy TF, Liau LM, Prins RM, Antonios JP, Li D, Yong WH, Pope WB, Lai A, Nghiemphu PL, Ellingson BM. pH-weighted molecular imaging of gliomas using amine chemical exchange saturation transfer MRI. Neuro Oncol 2015;17:1514-24. 10.1093/neuonc/nov106 [DOI] [PMC free article] [PubMed] [Google Scholar]
- 12.Harris RJ, Cloughesy TF, Liau LM, Nghiemphu PL, Lai A, Pope WB, Ellingson BM. Simulation, phantom validation, and clinical evaluation of fast pH-weighted molecular imaging using amine chemical exchange saturation transfer echo planar imaging (CEST-EPI) in glioma at 3 T. NMR Biomed 2016;29:1563-76. 10.1002/nbm.3611 [DOI] [PubMed] [Google Scholar]
- 13.Sun PZ, Zhou J, Huang J, van Zijl P. Simplified quantitative description of amide proton transfer (APT) imaging during acute ischemia. Magn Reson Med 2007;57:405-10. 10.1002/mrm.21151 [DOI] [PubMed] [Google Scholar]
- 14.McVicar N, Li AX, Gonçalves DF, Bellyou M, Meakin SO, Prado MA, Bartha R. Quantitative Tissue Ph Measurement during Cerebral Ischemia Using Amine and Amide Concentration-Independent Detection (AACID) with MRI. J Cereb Blood Flow Metab 2014;34:690-8. 10.1038/jcbfm.2014.12 [DOI] [PMC free article] [PubMed] [Google Scholar]
- 15.Zu Z, Janve VA, Xu J, Does MD, Gore JC, Gochberg DF. A new method for detecting exchanging amide protons using chemical exchange rotation transfer. Magn Reson Med 2013;69:637-47. 10.1002/mrm.24284 [DOI] [PMC free article] [PubMed] [Google Scholar]
- 16.van Zijl PCM, Jones CK, Ren J, Malloy CR, Sherry AD. MRI detection of glycogen in vivo by using chemical exchange saturation transfer imaging (glycoCEST). Proc Natl Acad Sci U S A 2007;104:4359-64. 10.1073/pnas.0700281104 [DOI] [PMC free article] [PubMed] [Google Scholar]
- 17.Zhou J, Zijl PCMv. Chemical exchange saturation transfer imaging and spectroscopy. Prog Nuc Magn Reson Spect 2006;48:109-36. 10.1016/j.pnmrs.2006.01.001 [DOI] [Google Scholar]
- 18.Walker-Samuel S, Ramasawmy R, Torrealdea F, Rega M, Rajkumar V, Johnson SP, Richardson S, Gonçalves M, Parkes HG, Arstad E, Thomas DL, Pedley RB, Lythgoe MF, Golay X. In vivo imaging of glucose uptake and metabolism in tumors. Nat Med 2013;19:1067-72. 10.1038/nm.3252 [DOI] [PMC free article] [PubMed] [Google Scholar]
- 19.Nasrallah FA, Pages G, Kuchel PW, Golay X, Chuang KH. Imaging brain deoxyglucose uptake and metabolism by glucoCEST MRI. J Cereb Blood Flow Metab 2013;33:1270-8. 10.1038/jcbfm.2013.79 [DOI] [PMC free article] [PubMed] [Google Scholar]
- 20.Rivlin M, Horev J, Tsarfaty I, Navon G. Molecular imaging of tumors and metastases using chemical exchange saturation transfer (CEST) MRI. Sci Rep 2013;3:3045. 10.1038/srep03045 [DOI] [PMC free article] [PubMed] [Google Scholar]
- 21.Jones KM, Pollard AC, Pagel MD. Clinical applications of chemical exchange saturation transfer (CEST) MRI. J Magn Reson Imaging 2018;47:11-27. 10.1002/jmri.25838 [DOI] [PMC free article] [PubMed] [Google Scholar]
- 22.Akhenblit PJ, Hanke NT, Gill A, Persky DO, Howison CM, Pagel MD, Baker AF. Assessing Metabolic Changes in Response to mTOR Inhibition in a Mantle Cell Lymphoma Xenograft Model Using AcidoCEST MRI. Mol Imaging 2016;15:1536012116645439. 10.1177/1536012116645439 [DOI] [PMC free article] [PubMed] [Google Scholar]
- 23.Xu X, Xu J, Knutsson L, Liu J, Liu H, Li Y, Lal B, Laterra J, Artemov D, Liu G, van Zijl PCM, Chan KWY. The effect of the mTOR inhibitor rapamycin on glucoCEST signal in a preclinical model of glioblastoma. Magn Reson Med 2019;81:3798-807. 10.1002/mrm.27683 [DOI] [PMC free article] [PubMed] [Google Scholar]
- 24.Kogan F, Hariharan H, Reddy R. Chemical Exchange Saturation Transfer (CEST) Imaging: Description of Technique and Potential Clinical Applications. Curr Radiol Rep 2013;1:102-14. 10.1007/s40134-013-0010-3 [DOI] [PMC free article] [PubMed] [Google Scholar]
- 25.Liu G, Song X, Chan KWY, McMahon MT. Nuts and bolts of chemical exchange saturation transfer MRI. NMR Biomed 2013;26:810-28. 10.1002/nbm.2899 [DOI] [PMC free article] [PubMed] [Google Scholar]
- 26.Gochberg DF, Gore JC. Chemical exchange saturation transfer imaging: Advances and applications by Michael T. McMahon, Assaf A. Gild, Jeff W. M. Bulte, and Peter C.M. van Zijl Publisher: Pan Stanford Publishing Pte. Ltd., Singapore. Magn Reson Imaging 2017;38:233. 10.1016/j.mri.2017.01.00428089939 [DOI] [Google Scholar]
- 27.Wu B, Warnock G, Zaiss M, Lin C, Chen M, Zhou Z, Mu L, Nanz D, Tuura R, Delso G. An overview of CEST MRI for non-MR physicists. EJNMMI Phys 2016;3:19. 10.1186/s40658-016-0155-2 [DOI] [PMC free article] [PubMed] [Google Scholar]
- 28.Martineau E, Tea I, Loaëc G, Giraudeau P, Akoka S. Strategy for choosing extraction procedures for NMR-based metabolomic analysis of mammalian cells. Anal Bioanal Chem 2011;401:2133. 10.1007/s00216-011-5310-y [DOI] [PubMed] [Google Scholar]
- 29.Rivlin M, Navon G. CEST MRI of 3-O-methyl-D-glucose on different breast cancer models. Magn Reson Med 2018;79:1061-9. 10.1002/mrm.26752 [DOI] [PubMed] [Google Scholar]
- 30.Chan KW, McMahon MT, Kato Y, Liu G, Bulte JW, Bhujwalla ZM, Artemov D, van Zijl PC. Natural D-glucose as a biodegradable MRI contrast agent for detecting cancer. Magn Reson Med 2012;68:1764-73. 10.1002/mrm.24520 [DOI] [PMC free article] [PubMed] [Google Scholar]
- 31.Xu X, Chan KW, Knutsson L, Artemov D, Xu J, Liu G, Kato Y, Lal B, Laterra J, McMahon MT, van Zijl PC. Dynamic glucose enhanced (DGE) MRI for combined imaging of blood-brain barrier break down and increased blood volume in brain cancer. Magn Reson Med 2015;74:1556-63. 10.1002/mrm.25995 [DOI] [PMC free article] [PubMed] [Google Scholar]
- 32.Xu X, Yadav NN, Knutsson L, Hua J, Kalyani R, Hall E, Laterra J, Blakeley J, Strowd R, Pomper M, Barker P, Chan K, Liu G, McMahon MT, Stevens RD, van Zijl PC. Dynamic Glucose-Enhanced (DGE) MRI: Translation to Human Scanning and First Results in Glioma Patients. Tomography 2015;1:105-14. 10.18383/j.tom.2015.00175 [DOI] [PMC free article] [PubMed] [Google Scholar]
- 33.Wang J, Weygand J, Hwang KP, Mohamed AS, Ding Y, Fuller CD, Lai SY, Frank SJ, Zhou J. Magnetic Resonance Imaging of Glucose Uptake and Metabolism in Patients with Head and Neck Cancer. Sci Rep 2016;6:30618. 10.1038/srep30618 [DOI] [PMC free article] [PubMed] [Google Scholar]
- 34.Pelicano H, Martin DS, Xu RH, Huang P. Glycolysis inhibition for anticancer treatment. Oncogene 2006;25:4633. 10.1038/sj.onc.1209597 [DOI] [PubMed] [Google Scholar]
- 35.Stein M, Lin H, Jeyamohan C, Dvorzhinski D, Gounder M, Bray K, Eddy S, Goodin S, White E, Dipaola RS. Targeting tumor metabolism with 2-deoxyglucose in patients with castrate-resistant prostate cancer and advanced malignancies. Prostate 2010;70:1388-94. 10.1002/pros.21172 [DOI] [PMC free article] [PubMed] [Google Scholar]
- 36.Raez LE, Papadopoulos K, Ricart AD, Chiorean EG, Dipaola RS, Stein MN, Rocha Lima CM, Schlesselman JJ, Tolba K, Langmuir VK, Kroll S, Jung DT, Kurtoglu M, Rosenblatt J, Lampidis TJ. A phase I dose-escalation trial of 2-deoxy-D-glucose alone or combined with docetaxel in patients with advanced solid tumors. Cancer Chemother Pharmacol 2013;71:523-30. 10.1007/s00280-012-2045-1 [DOI] [PubMed] [Google Scholar]
- 37.Dwarakanath BS, Singh D, Banerji AK, Sarin R, Venkataramana NK, Jalali R, Vishwanath PN, Mohanti BK, Tripathi RP, Kalia VK, Jain V. Clinical studies for improving radiotherapy with 2-deoxy-D-glucose: Present status and future prospects. J Cancer Res Ther 2009;5 Suppl 1:S21-6. 10.4103/0973-1482.55136 [DOI] [PubMed] [Google Scholar]
- 38.Bessell EM, Courtenay VD, Foster AB, Jones M, Westwood JH. Some in vivo and in vitro antitumour effects of the deoxyfluoro-d-glucopyranoses. Eur J Cancer 1973;9:463-70. 10.1016/0014-2964(73)90128-X [DOI] [PubMed] [Google Scholar]
- 39.Reivich M, Kuhl D, Wolf A, Greenberg J, Phelps M, Ido T, Casella V, Fowler J, Hoffman E, Alavi A, Som P, Sokoloff L. The [18F]fluorodeoxyglucose method for the measurement of local cerebral glucose utilization in man. Circ Res 1979;44:127-37. 10.1161/01.RES.44.1.127 [DOI] [PubMed] [Google Scholar]
- 40.Demetriou E, Story H, Bofinger R, Halies H, Tabor A, Golay X. Effect of Liposomal Encapsulation on the Chemical Exchange Properties of Diamagnetic CEST Agents. J Phys Chem B 2019. doi: . 10.1021/acs.jpcb.9b02280 [DOI] [PMC free article] [PubMed] [Google Scholar]
- 41.Li Y, Qiao Y, Chen H, Bai R, Staedtke V, Han Z, Xu J, Chan KWY, Yadav N, Bulte JWM, Zhou S, van Zijl PCM, Liu G. Characterization of tumor vascular permeability using natural dextrans and CEST MRI. Magn Reson Med 2018;79:1001-9. 10.1002/mrm.27014 [DOI] [PMC free article] [PubMed] [Google Scholar]
- 42.Liu G, Banerjee SR, Yang X, Yadav N, Lisok A, Jablonska A, Xu J, Li Y, Pomper MG, van Zijl P. A dextran-based probe for the targeted magnetic resonance imaging of tumours expressing prostate-specific membrane antigen. Nat Biomed Eng 2017;1:977-82. 10.1038/s41551-017-0168-8 [DOI] [PMC free article] [PubMed] [Google Scholar]
- 43.Bagga P, Haris M, D'Aquilla K, Wilson NE, Marincola FM, Schnall MD, Hariharan H, Reddy R. Non-caloric sweetener provides magnetic resonance imaging contrast for cancer detection. J Transl Med 2017;15:119. 10.1186/s12967-017-1221-9 [DOI] [PMC free article] [PubMed] [Google Scholar]
- 44.Longo DL, Moustaghfir FZ, Zerbo A, Consolino L, Anemone A, Bracesco M, Aime S. EXCI-CEST: Exploiting pharmaceutical excipients as MRI-CEST contrast agents for tumor imaging. Int J Pharm 2017;525:275-81. 10.1016/j.ijpharm.2017.04.040 [DOI] [PubMed] [Google Scholar]
- 45.Ling W, Regatte RR, Navon G, Jerschow A. Assessment of glycosaminoglycan concentration in vivo by chemical exchange-dependent saturation transfer (gagCEST). Proc Natl Acad Sci U S A 2008;105:2266-70. 10.1073/pnas.0707666105 [DOI] [PMC free article] [PubMed] [Google Scholar]
- 46.Shinar H, Battistel MD, Mandler M, Lichaa F, Freedberg DI, Navon G. Sialo-CEST: chemical exchange saturation transfer NMR of oligo- and poly-sialic acids and the assignment of their hydroxyl groups using selective- and HSQC-TOCSY. Carbohydr Res 2014;389:165-73. 10.1016/j.carres.2014.02.008 [DOI] [PubMed] [Google Scholar]
- 47.Song X, Airan RD, Arifin DR, Bar-Shir A, Kadayakkara DK, Liu G, Gilad AA, van Zijl PC, McMahon MT, Bulte JW. Label-free in vivo molecular imaging of underglycosylated mucin-1 expression in tumour cells. Nat Commun 2015;6:6719. 10.1038/ncomms7719 [DOI] [PMC free article] [PubMed] [Google Scholar]
- 48.Rivlin M, Navon G. Glucosamine and N-acetyl glucosamine as new CEST MRI agents for molecular imaging of tumors. Sci Rep 2016;6:32648. 10.1038/srep32648 [DOI] [PMC free article] [PubMed] [Google Scholar]
- 49.Bos R, van Der Hoeven JJ, van Der Wall E, van Der Groep P, van Diest PJ, Comans EF, Joshi U, Semenza GL, Hoekstra OS, Lammertsma AA, Molthoff CF. Biologic Correlates of 18Fluorodeoxyglucose Uptake in Human Breast Cancer Measured by Positron Emission Tomography. J Clin Oncol 2002;20:379-87. 10.1200/JCO.2002.20.2.379 [DOI] [PubMed] [Google Scholar]
- 50.Monauni T, Zenti MG, Cretti A, Daniels MC, Targher G, Caruso B, Caputo M, McClain D, Del Prato S, Giaccari A, Muggeo M, Bonora E, Bonadonna RC. Effects of glucosamine infusion on insulin secretion and insulin action in humans. Diabetes 2000;49:926-35. 10.2337/diabetes.49.6.926 [DOI] [PubMed] [Google Scholar]
- 51.Pouwels MJ, Jacobs JR, Span PN, Lutterman JA, Smits P, Tack CJ. Short-term glucosamine infusion does not affect insulin sensitivity in humans. J Clin Endocrinol Metab 2001;86:2099-103. [DOI] [PubMed] [Google Scholar]
- 52.Tannis AJ, Barban J, Conquer JA. Effect of glucosamine supplementation on fasting and non-fasting plasma glucose and serum insulin concentrations in healthy individuals. Osteoarthritis Cartilage 2004;12:506-11. 10.1016/j.joca.2004.03.001 [DOI] [PubMed] [Google Scholar]
- 53.Yu JG, Boies SM, Olefsky JM. The Effect of Oral Glucosamine Sulfate on Insulin Sensitivity in Human Subjects. Diabetes Care 2003;26:1941-2. 10.2337/diacare.26.6.1941 [DOI] [PubMed] [Google Scholar]
- 54.Scroggie DA, Albright A, Harris MD. The effect of glucosamine-chondroitin supplementation on glycosylated hemoglobin levels in patients with type 2 diabetes mellitus: a placebo-controlled, double-blinded, randomized clinical trial. Arch Intern Med 2003;163:1587-90. 10.1001/archinte.163.13.1587 [DOI] [PubMed] [Google Scholar]
- 55.Simon RR, Marks V, Leeds AR, Anderson JW. A comprehensive review of oral glucosamine use and effects on glucose metabolism in normal and diabetic individuals. Diabetes Metab Res Rev 2011;27:14-27. 10.1002/dmrr.1150 [DOI] [PMC free article] [PubMed] [Google Scholar]
- 56.Bociek S, Franks F. Proton exchange in aqueous solutions of glucose. Hydration of carbohydrates. J Chem Soc. Faraday Trans 1979;7S:262-70. 10.1039/f19797500262 [DOI] [Google Scholar]
- 57.Hwang YY, Kim S-G, Evelhoch JL, Ackerman JJH. Nonglycolytic Acidification of Murine Radiation-induced Fibrosarcoma 1 Tumor via 3-O-Methyl-glucose Monitored by 1H, 2H, 13C, and 31P Nuclear Magnetic Resonance Spectroscopy. Cancer Res 1992;52:1259-66. [PubMed] [Google Scholar]
- 58.Rivlin M, Tsarfaty I, Navon G. Functional molecular imaging of tumors by chemical exchange saturation transfer MRI of 3-O-Methyl-D-glucose. Magn Reson Med 2014;72:1375-80. 10.1002/mrm.25467 [DOI] [PubMed] [Google Scholar]
- 59.Sehgal AA, Li Y, Lal B, Yadav NN, Xu X, Xu J, Laterra J, van Zijl PCM. CEST MRI of 3-O-methyl-D-glucose uptake and accumulation in brain tumors. Magn Reson Med 2019;81:1993-2000. 10.1002/mrm.27489 [DOI] [PMC free article] [PubMed] [Google Scholar]
- 60.Csáky TZ, Glenn JE. Urinary Recovery of 3-Methylglucose Administered to Rats. Am J Physiol 1957;188:159-62. 10.1152/ajplegacy.1956.188.1.159 [DOI] [PubMed] [Google Scholar]
- 61.Jay TM, Dienel GA, Cruz NF, Mori K, Nelson T, Sokoloff L. Metabolic Stability of 3-O-Methyl-d-Glucose in Brain and Other Tissues. J Neurochem 1990;55:989-1000. 10.1111/j.1471-4159.1990.tb04588.x [DOI] [PubMed] [Google Scholar]
- 62.Xu YZ, Krnjevic K. Unlike 2-deoxy-d-glucose, 3-O-methyl-d-glucose does not induce long-term potentiation in rat hippocampal slices. Brain Res 2001;895:250-2. 10.1016/S0006-8993(01)02077-7 [DOI] [PubMed] [Google Scholar]
- 63.Miller LP, Villeneuve JB, Braun LD, Oldendorf WH. Effect of pharmacological doses of 3-o-methyl-D-glucose and 2-deoxy-D-glucose on rat brain glucose and lactate. Stroke 1986;17:957-61. 10.1161/01.STR.17.5.957 [DOI] [PubMed] [Google Scholar]
- 64.Sigalet DL, Martin G, Meddings J. 3–0 methylglucose uptake as a marker of nutrient absorption and bowel length in pediatric patients. JPEN J Parenter Enteral Nutr 2004;28:158-62. 10.1177/0148607104028003158 [DOI] [PubMed] [Google Scholar]
- 65.Martin GR, Meddings J, Sigalet D. 3–0 methylglucose absorption in vivo correlates with nutrient absorption and intestinal surface area in experimental short bowel syndrome. JPEN J Parenter Enteral Nutr 2003;27:65-70. 10.1177/014860710302700165 [DOI] [PubMed] [Google Scholar]
- 66.Frayn KN, Adnitt PI. Estimation of 3-O-methyl-D-glucose in the presence of glucose. J Clin Pathol 1971;24:671-2. 10.1136/jcp.24.7.671 [DOI] [PMC free article] [PubMed] [Google Scholar]
- 67.Kynaston JA, Fleming SC, Laker MF, Pearson AD. Simultaneous quantification of mannitol, 3-O-methyl glucose, and lactulose in urine by HPLC with pulsed electrochemical detection, for use in studies of intestinal permeability. Clin Chem 1993;39:453-6. [PubMed] [Google Scholar]
- 68.Jenkins AP, Menzies IS, Nukajam WS, Creamer B. The effect of ingested lactulose on absorption of L-rhamnose, D-xylose, and 3-O-methyl-D-glucose in subjects with ileostomies. Scand J Gastroenterol 1994;29:820-5. 10.3109/00365529409092517 [DOI] [PubMed] [Google Scholar]
- 69.Nakanishi H, Cruz NF, Adachi K, Sokoloff L, Dienel GA. Influence of Glucose Supply and Demand on Determination of Brain Glucose Content with Labeled Methylglucose. J Cereb Blood Flow Metab 1996;16:439-49. 10.1097/00004647-199605000-00010 [DOI] [PubMed] [Google Scholar]
- 70.Jin T, Mehrens H, Wang P, Kim SG. Chemical exchange-sensitive spin-lock MRI of glucose analog 3-O-methyl-d-glucose in normal and ischemic brain. J Cereb Blood Flow Metab 2018;38:869-80. 10.1177/0271678X17707419 [DOI] [PMC free article] [PubMed] [Google Scholar]
- 71.Zu Z, Jiang X, Xu J, Gore JC. Spin-lock imaging of 3-o-methyl-D glucose (3OMG) in brain tumors. Magn Reson Med 2018;80:1110-7. 10.1002/mrm.27128 [DOI] [PMC free article] [PubMed] [Google Scholar]
- 72.Villadsen D, Smith S. Identification of more than 200 glucose-responsive Arabidopsis genes none of which responds to 3-O-methylglucose or 6-deoxyglucose. Plant Molecular Biology 2004;55:467-77. 10.1007/s11103-004-1050-0 [DOI] [PubMed] [Google Scholar]
- 73.Romano AH, Connell ND. 6-Deoxy-D-glucose and D-xylose: Analogs for the study of D-glucose transport by mouse 3T3 cells. J Cell Physiol 1982;111:77-82. 10.1002/jcp.1041110112 [DOI] [PubMed] [Google Scholar]
- 74.Jin T, Kim SG. CEST and Spin-Lock MRI signals of glucose and glucose analogs. Magn Reson Med 2018;80:488-95. 10.1002/mrm.27183 [DOI] [PMC free article] [PubMed] [Google Scholar]
- 75.Huntley NF, Patience JF. Xylose: absorption, fermentation, and post-absorptive metabolism in the pig. J Anim Sci Biotechnol 2018;9:4. 10.1186/s40104-017-0226-9 [DOI] [PMC free article] [PubMed] [Google Scholar]
- 76.Alvarado F. d-xylose active transport in the hamster small intestine. Biochim Biophys Acta 1966;112:292-306. 10.1016/0926-6585(66)90328-1 [DOI] [PubMed] [Google Scholar]
- 77.Sugiyama H, Usui T. The Anomeric Equilibrium of Glucose in Acidic and Basic Media. Agric Biol Chem 1980;44:3001-2. [Google Scholar]
- 78.Rivlin M, Navon G. 3-O-Methyl-d-glucose mutarotation and proton exchange rates assessed by 13C, 1H NMR and by chemical exchange saturation transfer and spin lock measurements. J Biomol NMR 2018;72:93-103. 10.1007/s10858-018-0209-y [DOI] [PubMed] [Google Scholar]
- 79.Navon G, Lyon RC, Kaplan O, Cohen JS. Monitoring the transport and phosphorylation of 2-deoxy-D-glucose in tumor cells in vivo and in vitro by 13C nuclear magnetic resonance spectroscopy. FEBS Lett 1989;247:86-90. 10.1016/0014-5793(89)81246-3 [DOI] [PubMed] [Google Scholar]
- 80.Sherry AD, Caravan P, Lenkinski RE. Primer on gadolinium chemistry. J Magn Reson Imaging 2009;30:1240-8. 10.1002/jmri.21966 [DOI] [PMC free article] [PubMed] [Google Scholar]


