Abstract
BACKGROUND
Treatments utilizing stems cells often require stem cells to be exposed to inflammatory environments, but the effects of such environments are unknown.
AIM
To examine the effects of inflammatory cytokines on the morphology and quantity of mesenchymal stem cell exosomes (MSCs-exo) as well as the differential expression of microRNAs (miRNAs) in the exosomes.
METHODS
MSCs were isolated from human umbilical tissue by enzymatic digestion. Exosomes were then collected after a 48-h incubation period in a serum-free medium with one of the following the inflammatory cytokines: None (control), vascular cell adhesion molecule-1 (VCAM-1), tumor necrosis factor (TNF) α, and interleukin (IL) 6. The morphology and quantity of each group of MSC exosomes were observed and measured. The miRNAs in MSCs-exo were sequenced. We compared the sequenced data with the miRBase and other non-coding databases in order to detect differentially expressed miRNAs and explore their target genes and regulatory mechanisms. In vitro tube formation assays and Western blot were performed in endothelial cells which were used to assess the angiogenic potential of MSCs-exo after inflammatory cytokine stimulation.
RESULTS
MSCs-exo were numerous, small, and regularly shaped in the VCAM-1 group. TNFα stimulated MSCs to secrete larger and irregular exosomes. IL6 led to a reduced quantity of MSCs-exo. Compared to the control group, the TNFα and IL6 groups had more downregulated differentially expressed miRNAs, particularly angiogenesis-related miRNAs. The angiogenic potential of MSCs-exo declined after IL6 stimulation.
CONCLUSION
TNFα and IL6 may influence the expression of miRNAs that down-regulate the PI3K-AKT, MAPK, and VEGF signaling pathways; particularly, IL6 significantly down-regulates the PI3K-AKT signaling pathway. Overall, inflammatory cytokines may lead to changes in exosomal miRNAs that abnormally impact cellular components, molecular function, and biological processes.
Keywords: Mesenchymal stem cells, Exosomes, MiRNA, Inflammatory cytokines, Angiogenesis
Core tip: The morphology and quantity of mesenchymal stem cell exosomes (MSCs-exo) are impacted in different inflammatory cytokine environments. Inflammatory cytokines impair the ability of MSCs-exo to promote angiogenesis. For instance, the tumor necrosis factor α and interleukin 6 groups exhibited decreased numbers of angiogenesis-related microRNAs (miRNAs), such as miR-196a-5p, miR-17-5p, miR-146b-5p, miR-21-3p, and miR-320. The same groups also had downregulated angiogenesis-related signaling pathways, such as PI3K-AKT and VEGF. Inflammatory cytokines may lead to changes in exosomal miRNAs that abnormally impact cellular components, molecular function, and biological processes, particularly angiogenesis-related miRNAs.
INTRODUCTION
Stem cell transplantation has been developing rapidly and has resulted in breakthroughs for the treatment of various diseases. There is especially an interest in the transplantation of mesenchymal stem cells (MSCs), which are tissue-derived cells with self-renewal abilities. Their exosomes (MSCs-exo) not only contain the unique active components of all stem cells, but also are relatively more safe, are more chemically stable, and have the capacity for targeted delivery to biological pathways of interest[1-4].
Exosomes were first found in vitro in cultured sheep erythrocyte supernatant[5]. They are membranous vesicles with a diameter of 30-150 nm and a density of 1.10-1.18 g/mL. They are able to affect gene regulation by carrying and releasing various bioactive molecules such as microRNAs (miRNAs) and proteins, both of which can then function as paracrine signaling mediators impacting biological pathways relevant to disease processes[6]. MiRNAs are non-coding RNAs 22-25 nucleotides in length[7-10]. Exosomes are especially important in producing miRNAs that impact angiogenesis[11].
There is promising research on using MSCs-exo to encourage wound healing and to treat inflammatory arthritis and ischemic diseases. However, in treating these diseases, MSCs are exposed to microenvironments filled with numerous inflammatory cytokines, such as vascular cell adhesion molecule-1 (VCAM-1), tumor necrosis factor (TNF) α, and interleukin (IL) 6. The effects of these inflammatory cytokines on the morphology and quantity of MSCs-exo and how these effects impact the production of miRNAs and downstream regulatory mechanisms are largely unknown. In this study, we analyzed the effects of VCAM-1, TNFα, and IL6 on the morphology and quantity of MSCs-exo, how these effects enhance differential expression of miRNAs, and how the target genes of these miRNAs and their associated regulatory mechanisms are regulated.
MATERIALS AND METHODS
Cell culture
Human umbilical mesenchymal stem cells were obtained from the Polywin Corporation (Guangzhou, China). The phenotypes of the MSCs were characterized by flow cytometric analysis of cell surface antigens, including tests for the cluster of differentiation (CD)29, CD34, CD44, CD73, and CD105. The MSCs were divided into four groups: Control group: MSCs (1.0 × 10⁵ cells/mL) were cultured in a serum-free DMEM/F12 (Sigma-Aldrich, United States) medium for 48 h; VCAM-1 group: MSCs (1.0 × 10⁵ cells/mL) were cultured in a serum-free DMEM/F12 (Sigma-Aldrich) medium, and VCAM-1 reagent (ADP5, R&D Systems, United States) was added to the medium at a concentration of 20 ng/mL for 48 h; TNFα group: MSCs (1.0 × 10⁵ cells/mL) were cultured in a serum-free DMEM/F12 (Sigma-Aldrich) medium, and TNFα reagent (T6674, Sigma-Aldrich) was added to the medium at a concentration of 20 ng/mL for 48 h; and IL6 group: MSCs (1.0 × 10⁵ cells/mL) were cultured in a serum-free DMEM/F12 (Sigma-Aldrich) medium, and IL6 reagent (200-06-20, PeproTech, United States) was added to the medium at a concentration 20 ng/mL for 48 h. The number, distribution, and morphology of cells in each group were observed under a microscope at 100× or 200× magnification for 48 h.
Exosome isolation
Exosomes were isolated from the culture supernatant by ultracentrifugation according to methods described previously[12,13]. Briefly, the culture medium of each group was collected and centrifuged at 2000 × g for 10 min at 4 °C. The supernatant was then centrifuged at 10000 × g for 10 min at 4 °C. Next, the supernatant was passed through a 0.2-μm filter (Steradisc; Kurabo, Bio-Medical Department, Tokyo, Japan). The filtrate was ultracentrifuged at 100000 × g for 70 min at 4 °C (Type 70Ti ultracentrifuge; Beckman Coulter, Inc., Brea, CA, United States). The precipitate was next rinsed with phosphate buffered saline (PBS) and ultracentrifuged at 100000 × g for 70 min at 4 °C. The exosome-enriched fraction was next reconstituted in PBS for further studies.
Characteristics and distributions of exosomes in each group were observed. The particle size and concentration of exosomes in each group were measured by nanoparticle tracking analysis.
Differential miRNA analysis and target gene and regulatory signal pathway prediction
The miRNAs of MSCs-exo were sequenced by BGISEQ-500 technology in each group. Sequenced data were compared with miRBase and other non-coding databases. Bioinformatics analysis pipeline steps for miRNA sequencing were: (1) Filtering small RNAs: 18-30 nt RNA segments were separated by polyacrylamide gel electrophoresis (PAGE); (2) 3’ adaptor ligation: A 5-adenylated, 3-blocked single-stranded DNA adapter was linked to the 3’ end of selected small RNAs from step 1; (3) Reverse primer annealing: the RT primer was added to the solution from step 2 and cross-linked to the 3’ adapter of the RNAs and to excess free 3’ adapter; (4) 5’ adaptor ligation: a 5’ adaptor was linked to the 5' end of the product from step 3. The adaptor was attached to the end only, not to the 3’ adaptor or RT primer hybrid chain, thus greatly reducing self-ligation; (5) cDNA synthesis: The RT primers in step 3 were reverse extended to synthesize cDNA strands; (6) PCR amplification: High-fidelity polymerase was used to amplify cDNA, and cDNA with both 3’ and 5’ adaptors was enriched; (7) Library fragment selection: The PCR products of 100-120 bp were separated by PAGE to eliminate primer dimers and other byproducts; (8) Library quantitative and pooling cyclization; (9) Eliminating the low-quality reads, adaptors and other contaminants to obtain clean reads; (10) Summarizing the length distribution of the clean tags, common, and specific sequences between samples; (11) Assigning the clean tags to different categories; (12) Predicting novel miRNAs; (13) Function annotation of known miRNAs; and (14) Comparing clean reads to the reference base group and other small RNA databases using AASRA software [14], except that Rfam was compared with cmsearch[15]. We used TPM[16] to standardize miRNA expression levels and predicted target genes using RNAhybrid[17], miRanda[18], and TargetScan[19].
Hierarchical clustering analysis showed differentially expressed miRNAs by functional pheatmap. The P-values obtained from the differential gene expression tests were corrected by controlling the false discovery rate (FDR)[20] as more stringent criteria with smaller FDRs and bigger fold-change values can be used to identify differentially expressed miRNAs.
Gene ontology (GO) enrichment analysis was performed to identify all GO terms that are significantly enriched in a list of target genes of differentially expressed miRNAs, as well as the genes that correspond to specific biological functions.
The hypergeometric test was then used to find significantly enriched GO terms based on this database (http://www.geneontology.org/). Pathway-based analyses were used to discover the biological functions of target genes using KEGG[21] (the major public pathway-related database).
In vitro Matrigel tube formation assay
HUVECs (4.0 × 10⁴, serum-starved overnight) were seeded in a 96-well plate, cultured in 5% CO2 overnight, and then treated with PBS (control), control scrambled MSCs-exo, MSCs-exoTNFα (5 × 10⁹, stimulated with TNFα), or MSCs-exoIL6 (5 × 10⁹, stimulated with IL6). The plates were previously coated with 150 μL of growth factor-reduced Matrigel (356234, Corning, United States) in serum-free medium. Tube formation ability of control or MSCs-exo-treated HUVECs was examined by determining the total number of tubes formed and branching points in 4 to 6 h. Each condition in each experiment was assessed at least in duplicate.
Western blot analysis
HUVECs (4.0 × 10⁴) were treated with PBS (control), control scrambled MSCs-exo, MSCs-exoTNFα (5 × 10⁹, stimulated with TNFα), or MSCs-exoIL6 (5 × 10⁹, stimulated with IL6). The effect of MSCs-exo treatment on PI3K-AKT and MAPK, which are related to angiogenic signaling, was examined by measuring the expression of AKT (1:1000 dilution, 4691S, Cell Signaling Technology, Danvers, MA, United States), phospho-AKT (1:1000 dilution, 13038S, Cell Signaling Technology), phospho-p44/42 MAPK (Erk1/2) (1:2000 dilution, 4370S, Cell Signaling Technology), and p44/42 MAPK (Erk1/2) (1:1000 dilution, 4695S, Cell Signaling Technology) in endothelial cells by Western blot. Each condition in each experiment was assessed at least in triplicate.
Statistical analysis
The data from each group were collected and analyzed using SPSS 11.5 software (IBM SPSS China, Shanghai, china). Numerical data are presented as the mean ± SE; comparisons between groups were evaluated by Student’s t-test or ANOVA, with P < 0.05 considered significant.
RESULTS
Phenotypic characterization of MSCs
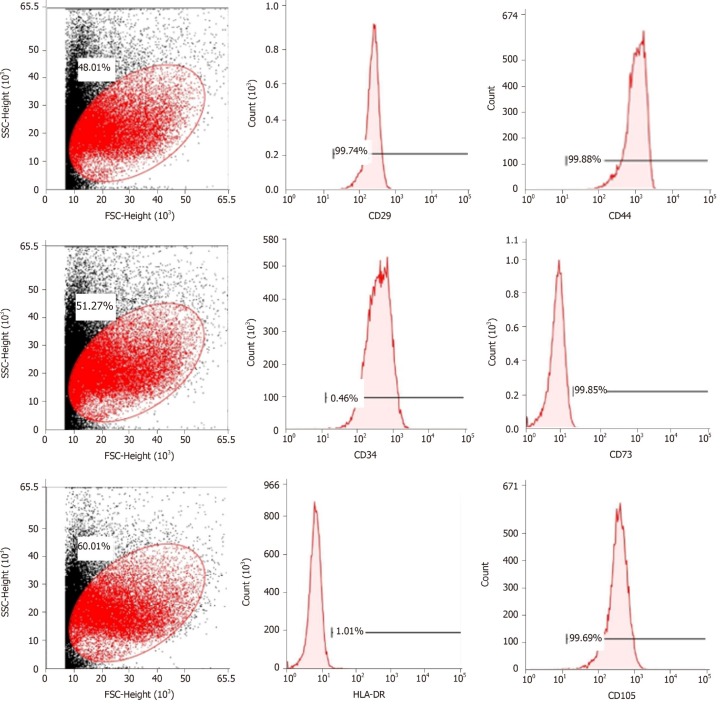
Cell purity (85% to 95%) was determined via flow cytometry. The cells were positive for mesenchymal cell markers such as CD29, CD44, CD73, and CD105 and negative for hematopoietic cell markers such as CD34 and HLA-DR (Figure 1).
Figure 1.
Flow cytometric analysis of mesenchymal stem cell-related cell surface markers. High expression of positive mesenchymal cell markers (CD29, CD44, CD73, and CD105), and low expression of negative cell markers such as CD34 and HLA-DR were observed. n = 3 to 5; P < 0.05,
Effect of inflammatory cytokines on MSCs-exo
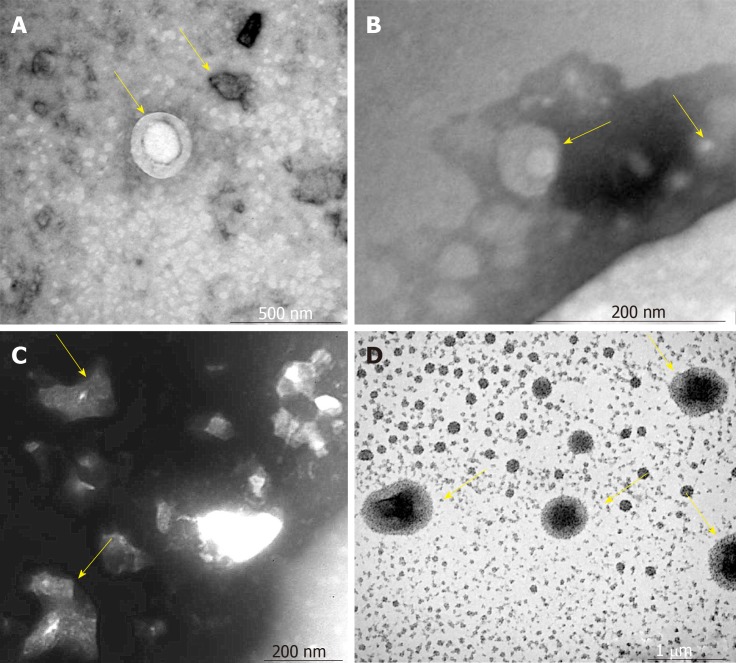
The VCAM-1 group had small regularly shaped MSCs-exo. The TNFα group had large irregularly shaped MSCs-exo. The IL6 group had medium regularly shaped MSCs-exo (Figure 2)
Figure 2.
Morphology of mesenchymal stem cell exosomes (magnification, ×65000). A-D: Mesenchymal stem cell exosomes (MSCs-exo) in (A) the control group (yellow arrow), (B) the vascular cell adhesion molecule-1 group (yellow arrow), (C) the tumor necrosis factor α group (yellow arrow), and (D) the interleukin 6 group (yellow arrow).
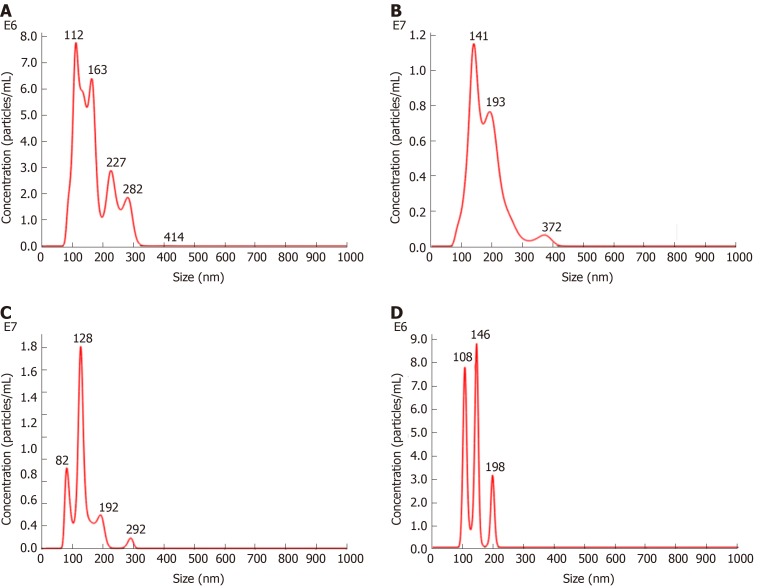
The density of MSCs-exo was 7.42 × 10⁸/mL in the control group, 1.10 × 10⁹/mL in the VCAM-1 group, 7.37 × 10⁸/mL in the TNFα group, and 3.01 × 10⁸/mL in the IL6 group (Figure 3).
Figure 3.
Nanoparticle tracking analysis. A-D: Density of exosomes of different sizes in (A) the control group, (B) the vascular cell adhesion molecule-1 group, (C) the tumor necrosis factor α group, and (D) the interleukin 6 group.
Effect of differential miRNA expression, secondary to inflammatory cytokine exposure, on biological function
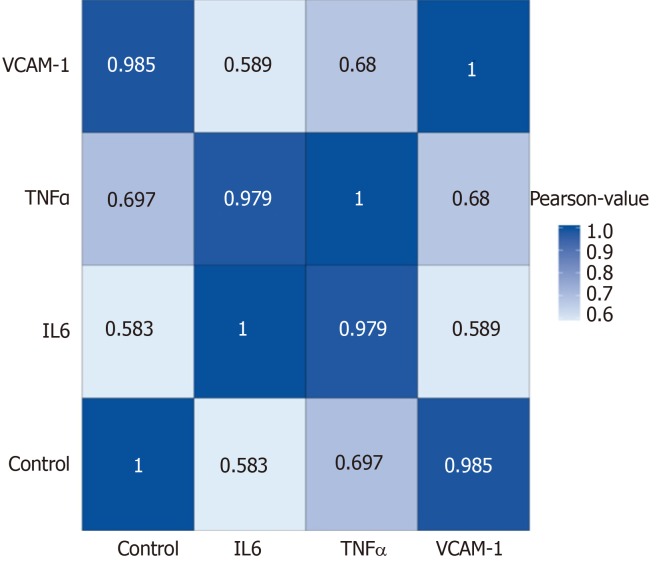
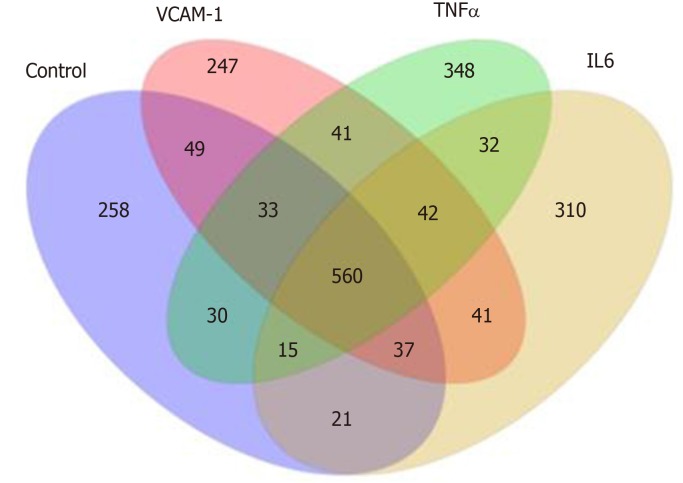
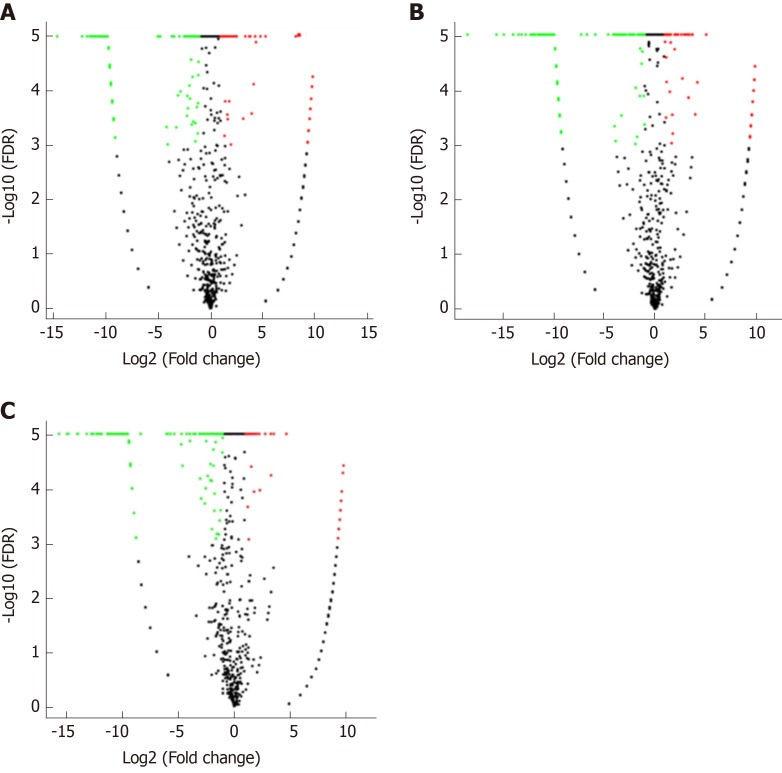
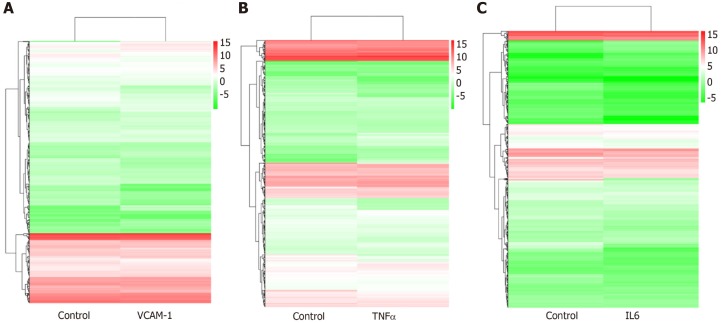
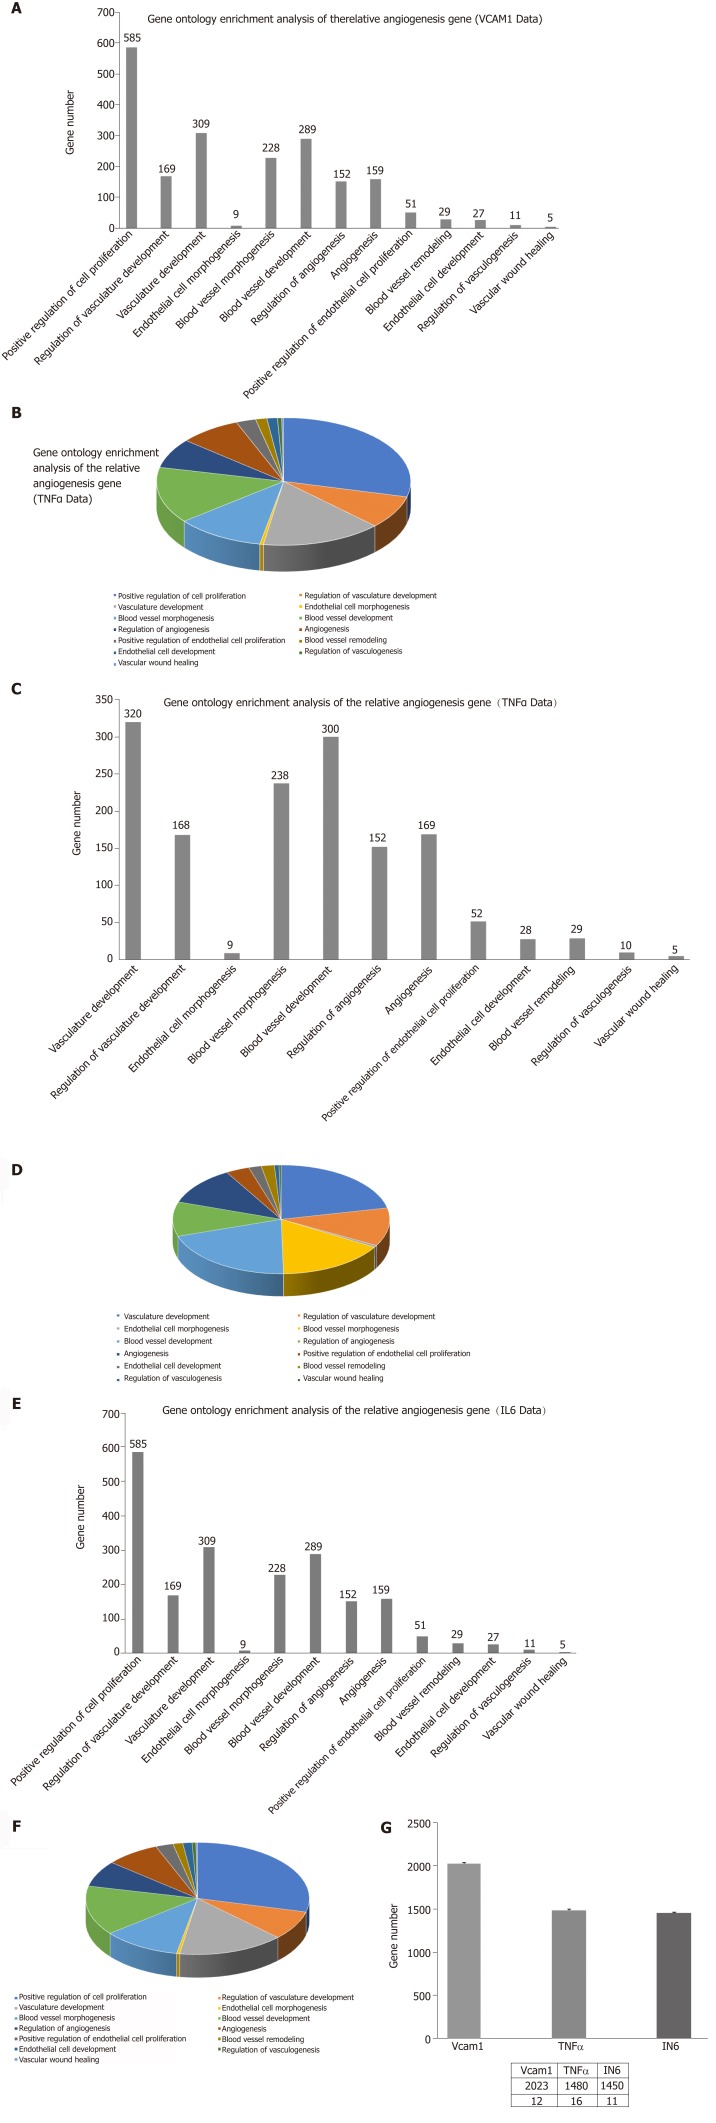
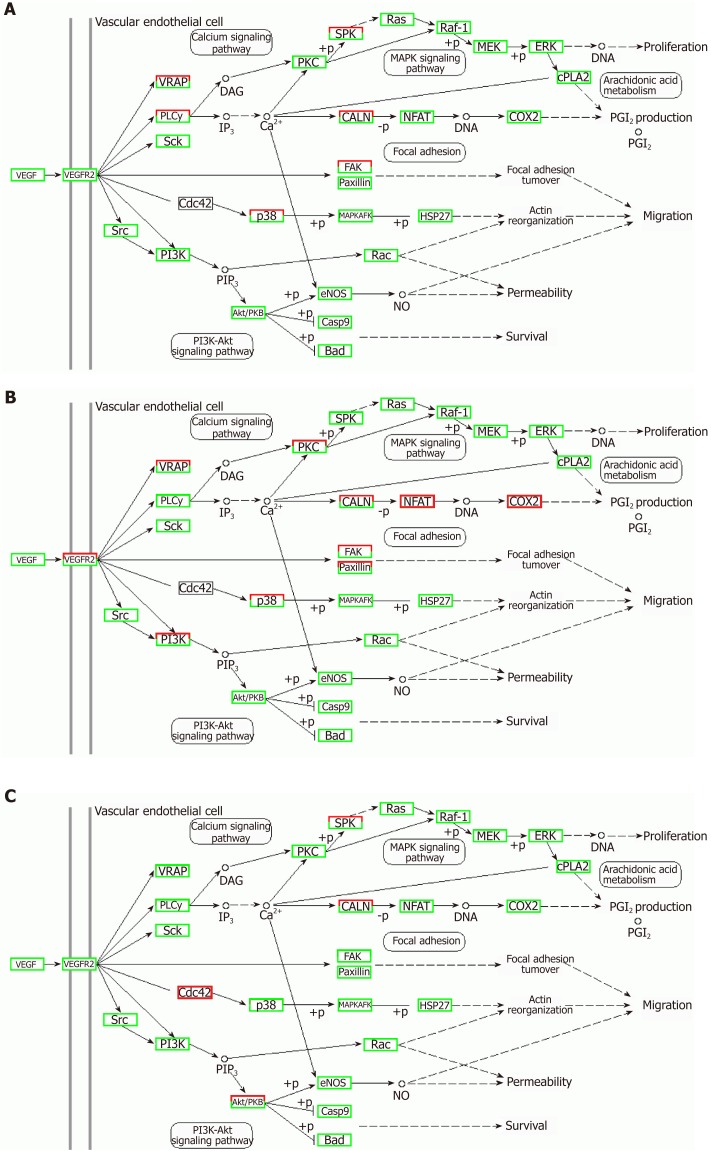
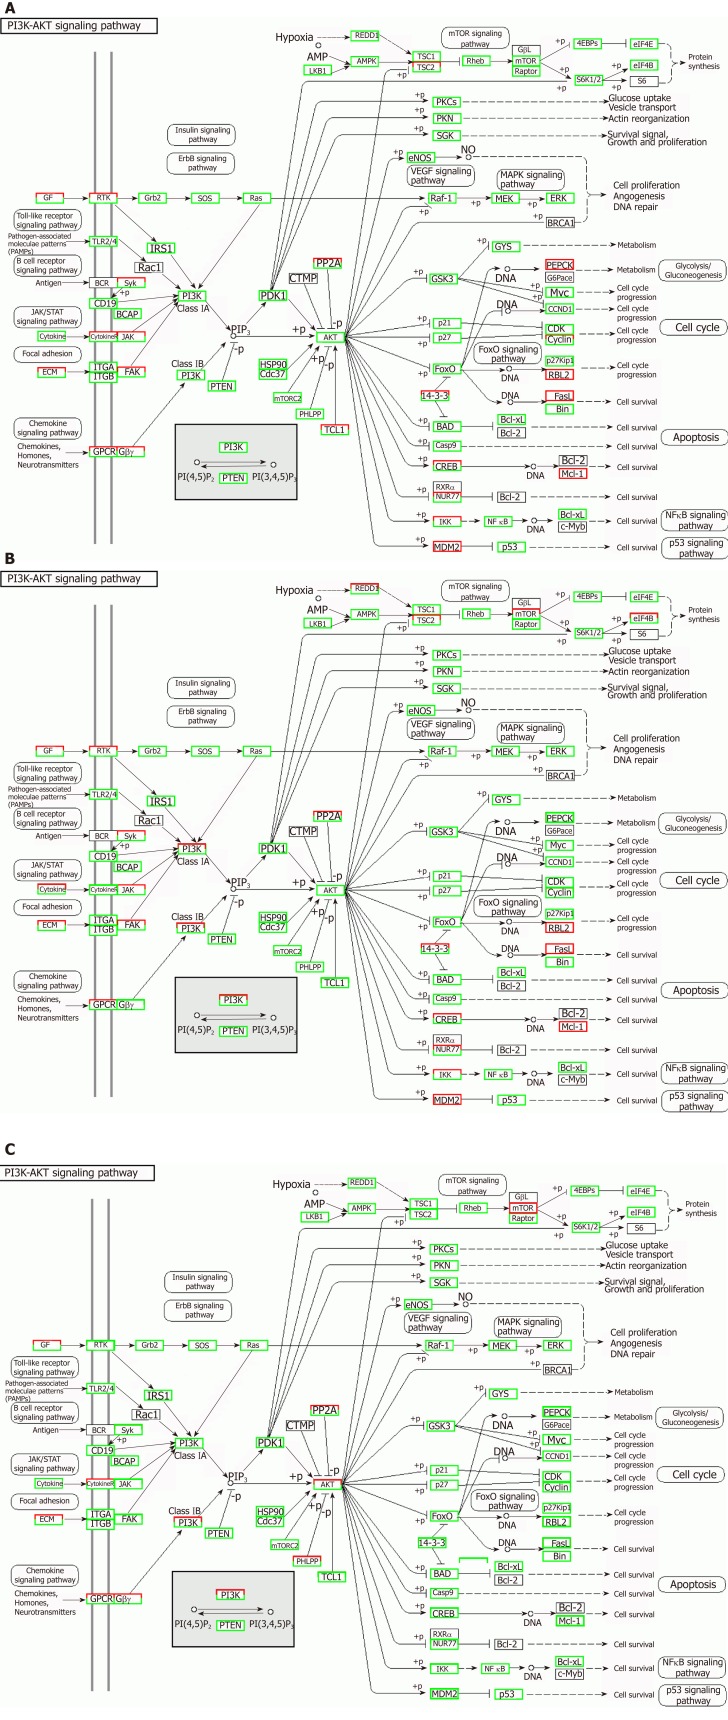
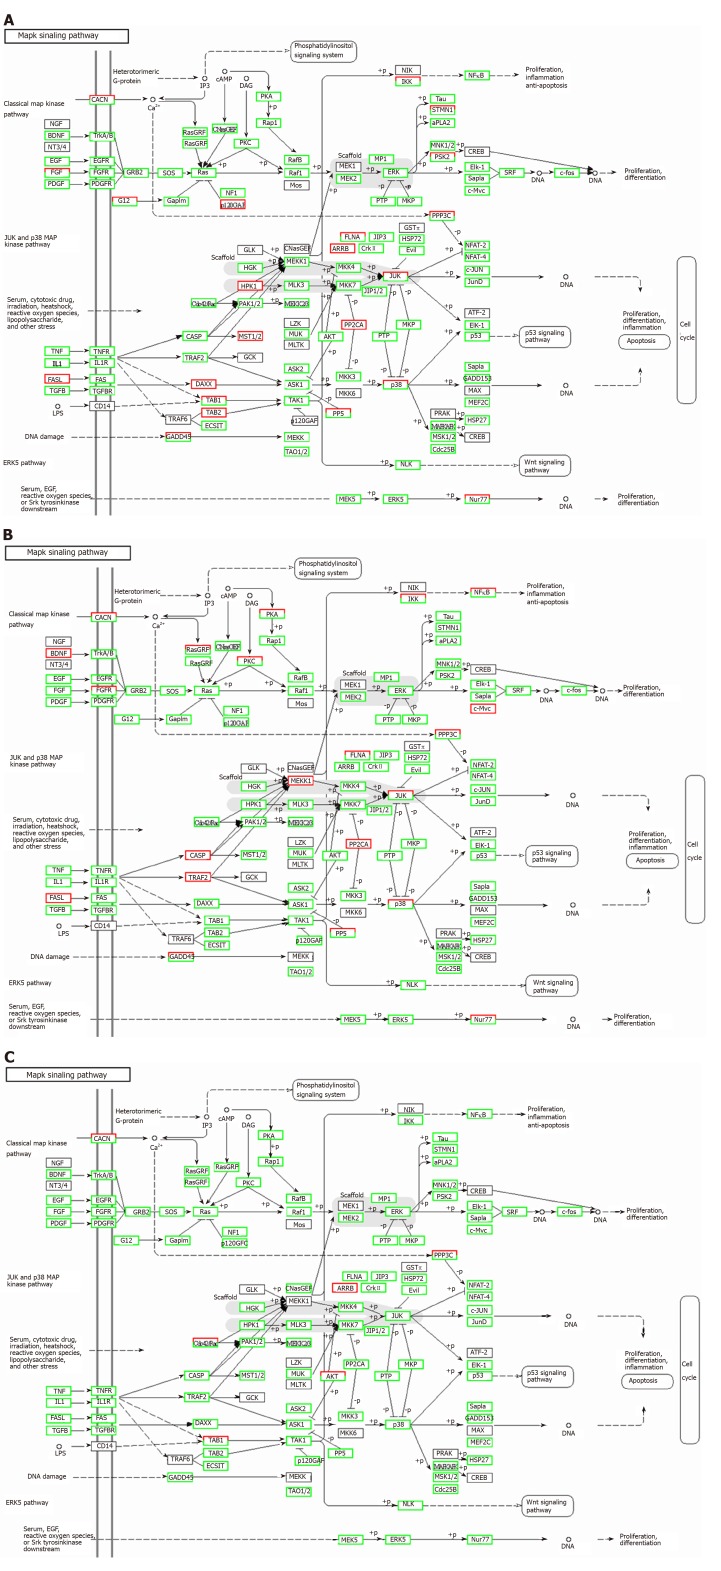
Correlation analyses showed that the miRNA expression profiles in the IL6 group (0.583) and TNFα group (0.697) were more different from that of the control group than that in the VCAM1 group (0.985) (Figures 4 and 5). The top 10 miRNAs in each group are shown in Table 1. Many miRNAs, particularly some important angiogenesis-related miRNAs, were downregulated in the TNFα group and IL6 group compared to the control group (Tables 2-4 and Figure 6). Hierarchical clustering indicated that the expression levels of the majority of miRNAs in the IL6 group were downregulated compared with those of the control group (Figure 7). According to GO enrichment analysis, miRNAs in exosomes exposed to inflammatory cytokines, compared to controls, had a different regulatory effect on cellular components, molecular function, and biological processes (Figure 8). More specifically, pathway enrichment analysis showed that the target genes of the differentially expressed miRNAs, including those related to angiogenesis, differed among the four groups (Figures 9 and 10). The following angiogenesis-related pathways were more down-regulated in the TNFα and IL6 groups than in the control group: The PI3K-AKT signaling pathway (Q = 0.0978197212 and 0.0581120875 in the TNFα group and IL6 group, respectively), the MAPK signaling pathway (Q = 0.5775485 and 0.9837761532 in the TNFα group and IL6 group, respectively), and the VEGF signaling pathway (Q = 0.4082212190 and 0.1711566 in the TNFα group and IL6 group, respectively) (Figures 10-13).
Figure 4.
Correlation analyses between groups. Blue color represents the correlation coefficient (the deeper the blue, the stronger the correlation). VCAM-1: Vascular cell adhesion molecule-1; TNF: Tumor necrosis factor; IL6: Interleukin 6.
Figure 5.
Distribution of differentially expressed miRNAs in different groups. VCAM-1: Vascular cell adhesion molecule-1; TNF: Tumor necrosis factor; IL6: Interleukin 6.
Table 1.
Differentially expressed miRNAs
|
Top 10 differentially expressed miRNAs | ||||||||||
|
Control group |
VCAM-1 group |
In the TNFα group |
In the IL6 group |
|||||||
| sRNA id | Count (16379497) | TPM | sRNA id | Count (23095609) | TPM | sRNA id | Count (20739574) | TPM | sRNA id | Count (32116232) |
| miR-21-5p | 1544110 | 76933.99 | miR-21-5p | 1640334 | 70885.38 | miR-21-5p | 1454726 | 70066.87 | miR-21-5p | 1323387 |
| miR-127-3p | 159283 | 9724.54 | miR-127-3p | 259830 | 11250.19 | miR-100-5p | 408192 | 19681.79 | miR-199a-3p,miR-199b-3p | 317377 |
| miR-199a-3p,miR-199b-3p | 139220 | 8499.65 | miR-199a-3p, miR-199b-3p | 155376 | 6727.51 | miR-127-3p | 321306 | 15492.41 | miR-127-3p | 300549 |
| miR-100-5p | 132865 | 8111.67 | miR-100-5p | 140774 | 6095.27 | miR-199a-3p, miR-199b-3p | 271902 | 13110.3 | miR-100-5p | 265054 |
| miR-222-3p | 89564 | 5468.06 | miR-26a-5p | 107800 | 4667.55 | miR-23a-3p | 140623 | 6780.42 | miR-34a-5p | 178542 |
| miR-26a-5p | 77524 | 4732.99 | miR-34a-5p | 86786 | 3757.68 | miR-222-3p | 129932 | 6264.93 | miR-23a-3p | 144385 |
| miR-34a-5p | 76681 | 4681.52 | miR-451a | 77297 | 3346.83 | miR-146a-5p | 128078 | 6175.54 | miR-222-3p | 111957 |
| miR-181a-5p | 67287 | 4108 | miR-23a-3p | 71930 | 3114.44 | miR-34a-5p | 119952 | 5783.73 | miR-146a-5p | 100038 |
| miR-411-5p | 56606 | 3455.91 | miR-196a-5p | 63939 | 2768.45 | miR-143-3p | 101398 | 4889.11 | miR-26a-5p | 98114 |
| miR-143-3p | 49739 | 3036.66 | miR-181a-5p | 62752 | 2717.05 | miR-26a-5p | 99628 | 4803.76 | miR-181a-5p | 97685 |
Count is the number of mapped tags, and the value in parentheses is the total number. Transcripts per kilobase million is the standardized expression value. VCAM-1: Vascular cell adhesion molecule-1; TNF: Tumor necrosis factor; IL6: Interleukin 6; TPM: Transcripts per kilobase million.
Table 2.
Top 10 differentially expressed miRNAs in each group (Poisson distribution screening)
|
Comparison of top 10 differentially expressed miRNAs |
|||||||||||||||||||||||||||
|
VCAM-1 group vs control group |
TNFα group vs control group |
IL6 group vs control group |
|||||||||||||||||||||||||
| miRNA id | Count (control) | Count (VCAM-1) | TPM (control) | TPM (VCAM-1) | Log2 ratio (VCAM-1/control) | Up/down-regulation (VCAM-1/control) | P | FDR | miRNA id | Count (control) | Count (TNFα) | TPM (control) | TPM (TNFα) | Log2 ratio (TNFα/control) | Up/down-regulation (TNFα/control) | P | FDR | miRNA id | Count (control) | Count (IL6) | TPM (control) | TPM (IL6) | Log2 ratio (IL6/control) | Up/down-Regulation (IL6/control) | P value | FDR | |
| miR-146a-5p | 20510 | 5173 | 1252.18 | 223.98 | -2.483 | Down | 0 | 0 | miR-146a-5p | 20510 | 128078 | 1252.18 | 6175.54 | 2.302123 | Up | 0 | 0 | miR-3529-3p | 473 | 8930 | 28.88 | 278.05 | 3.267202 | Up | 0 | 0 | |
| miR-149-5p | 4558 | 2391 | 278.27 | 103.53 | -1.42644 | Down | 0 | 0 | miR-342-3p | 2117 | 7130 | 129.25 | 343.79 | 1.411363 | Up | 0 | 0 | miR-320c | 1276 | 7983 | 77.9 | 248.57 | 1.673957 | Up | 0 | 0 | |
| miR-222-3p | 89564 | 48444 | 5468.06 | 2097.54 | -1.38233 | Down | 0 | 0 | miR-23a-3p | 42777 | 140623 | 2611.62 | 6780.42 | 1.37643 | Up | 0 | 0 | miR-24-3p | 11151 | 50968 | 680.79 | 1586.99 | 1.221011 | Up | 0 | 0 | |
| miR-29a-3p | 8451 | 5054 | 515.95 | 218.83 | -1.23742 | Down | 0 | 0 | miR-100-5p | 132865 | 408192 | 8111.67 | 19681.79 | 1.278791 | Up | 0 | 0 | miR-7-5p | 16653 | 101 | 1016.7 | 3.14 | -8.33891 | Down | 0 | 0 | |
| miR-451a | 2760 | 77297 | 168.5 | 3346.83 | 4.311975 | Up | 0 | 0 | miR-337-3p | 5655 | 16027 | 345.25 | 772.77 | 1.162398 | Up | 0 | 0 | miR-196a-5p | 26485 | 11440 | 1616.96 | 356.21 | -2.18248 | Down | 0 | 0 | |
| miR-490-5p | 1839 | 475 | 112.27 | 20.57 | -2.44836 | Down | 2.00E-305 | 1.20E-303 | miR-409-3p | 4207 | 11169 | 256.85 | 538.54 | 1.068127 | Up | 0 | 0 | miR-451a | 2760 | 1658 | 168.5 | 51.62 | -1.70675 | Down | 0 | 0 | |
| miR-1246 | 1812 | 6191 | 110.63 | 268.06 | 1.276813 | Up | 1.39E-276 | 8.02E-275 | miR-221-3p | 4067 | 10541 | 248.3 | 508.26 | 1.033482 | Up | 0 | 0 | miR-379-5p | 13430 | 8083 | 819.93 | 251.68 | -1.70391 | Down | 0 | 0 | |
| miR-181a-2-3p | 3400 | 2008 | 207.58 | 86.94 | -1.25558 | Down | 2.31E-219 | 1.18E-217 | miR-7-5p | 16653 | 136 | 1016.7 | 6.56 | -7.27598 | Down | 0 | 0 | miR-196b-5p | 18735 | 15676 | 1143.81 | 488.1 | -1.2286 | Down | 0 | 0 | |
| miR-204-5p | 3116 | 1757 | 190.24 | 76.08 | -1.32223 | Down | 3.36E-218 | 1.66E-216 | miR-196a-5p | 26485 | 8359 | 1616.96 | 403.05 | -2.00425 | Down | 0 | 0 | miR-424-5p | 12774 | 11917 | 779.88 | 371.06 | -1.0716 | Down | 0 | 0 | |
| miR-378e | 2 | 817 | 0.12 | 35.37 | 8.203348 | Up | 4.36E-186 | 2.00E-184 | miR-26b-5p | 6496 | 3410 | 396.59 | 164.42 | -1.27026 | Down | 0 | 0 | miR-26b-5p | 6496 | 6086 | 396.59 | 189.5 | -1.06545 | Down | 0 | 0 | |
P-values were corrected. TPM: Transcripts per kilobase million; FDR: False discovery rate; VCAM-1: Vascular cell adhesion molecule-1; TNF: Tumor necrosis factor; IL6: Interleukin 6.
Table 4.
Comparison of differentially expressed angiogenesis-related miRNAs between the IL6 group and control group
| miRNA id | Count (control) | Count (IL6) | TPM (control) | TPM (IL6) | Log2 ratio (IL6/control) | Up/down-regulation (IL6/control) | P | FDR |
| hsa-miR-196a-5p | 26485 | 11440 | 1616.96 | 356.21 | -2.182484067 | Down | 0 | 0 |
| hsa-miR-17-5p | 252 | 138 | 15.39 | 4.3 | -1.839584667 | Down | 2.24E-35 | 2.98E-34 |
| hsa-miR-146b-5p | 78 | 44 | 4.76 | 1.37 | -1.79678568 | Down | 1.08E-11 | 7.53E-11 |
| hsa-miR-21-3p | 440 | 358 | 26.86 | 11.15 | -1.268415595 | Down | 4.66E-35 | 6.02E-34 |
| hsa-miR-320e | 161 | 153 | 9.83 | 4.76 | -1.046229843 | Down | 1.78E-10 | 1.11E-09 |
P-values were corrected. TPM: Transcripts per kilobase million; FDR: False discovery rate; IL6: Interleukin 6.
Figure 6.
Volcano plots. A-C: Volcano plots of (A) vascular cell adhesion molecule-1 group vs control group, (B) tumor necrosis factor α group vs control group, and (C) interleukin 6 group vs control group. The X axis is the log2(Fold change), and the Y axis is the -log10(FDR), with green points indicating down-regulation [log2(Fold old change) ≤ -1 and FDR ≤ 0.001] and red points indicating upregulation [log2(Fold change) ≥ 1 and FDR ≤ 0.001]. FDR: False discovery rate.
Figure 7.
Hierarchical clustering of differentially expressed miRNAs. A: Vascular cell adhesion molecule-1 group vs control group; B: Tumor necrosis factor α group vs control group; C: Interleukin 6 group vs control group. The X axis represents each pair of differences, and the Y axis represents differentially expressed miRNAs. The colors indicate the fold change, with red showing up-regulation, and blue showing down-regulation. TNF: Tumor necrosis factor; IL6: Interleukin 6.
Figure 8.
Gene ontology enrichment analysis of gene targets of differentially expressed miRNAs. A: Vascular cell adhesion molecule-1 group vs control group; B: Tumor necrosis factor α group vs control group; C: Interleukin 6 group vs control group. The X axis shows the number of differently expressed genes (their square root value), and the Y axis shows GO terms. All GO terms are grouped into three ontologies: Blue indicates biological process, brown indicates cellular components, and red indicates molecular function
Figure 9.
Pathway enrichment analysis of gene targets of differentially expressed miRNAs. A: Comparison of the top 20 enriched pathway terms between vascular cell adhesion molecule-1 (VCAM-1) group and control group; B: Comparison of the Kyoto Encyclopedia of Genes and Genomes (KEGG) classification between VCAM-1 group and control group; C: Comparison of the top 20 enriched pathway terms between tumor necrosis factor (TNF) α group and control group; D: Comparison of the KEGG classification between TNFα group and control group; E: Comparison of the top 20 enriched pathway terms between interleukin 6 (IL6) group and control group; F: Comparison of the KEGG classification between IL6 group and control group. A, C, and E: The top 20 enriched pathway terms displayed as scatterplots. The rich factor is the ratio of target gene numbers annotated in this pathway term to all gene numbers annotated in this pathway term. The greater the rich factor, the greater the degree of enrichment. The Q-value is the corrected P-value and ranges from 0-1; the lower the Q-value, the greater the level of enrichment; B, D, and F: The X axis shows the number of target genes, and the Y axis shows the second KEGG pathway terms. The first pathway terms are indicated using different colors. The second pathway terms are subgroups of the first pathway terms and are grouped together on the X axis on the right side.
Figure 10.
Gene ontology enrichment analysis of angiogenesis-related genes. A: The number of angiogenesis-related genes in the vascular cell adhesion molecule-1 (VCAM-1) group; B: The proportion of angiogenesis-related genes in the VCAM-1 group; C: The number of angiogenesis-related genes in the tumor necrosis factor (TNF) α group; D: The proportion of angiogenesis-related genes in the TNFα group; E: The number of angiogenesis gene distributions in the interleukin 6 (IL6) group; F: The proportion of angiogenesis-related genes in the IL6 group; G: Comparison of the number of angiogenesis-related genes in the three groups to that of the control group.
Figure 13.
Regulatory mechanism of the VEGF signal pathway in different groups. A: Vascular cell adhesion molecule-1 group; B: Tumor necrosis factor α group; C: Interleukin 6 group. Up-regulated genes are marked with red borders and down-regulated genes with green borders. Unchanged genes are marked with black borders.
Table 3.
Comparison of differentially expressed angiogenesis-related miRNAs between the TNFα group and control group
| miRNA id | Count (control) | Count (TNFα) | TPM (control) | TPM (TNFα) | Log2 ratio (TNFα/ control) | Up/ down-regulation (TNFα/ control) | P | FDR |
| hsa-miR-196a-5p | 26485 | 8359 | 1616.96 | 403.05 | -2.004253263 | Down | 0 | 0 |
| hsa-miR-320e | 161 | 46 | 9.83 | 2.22 | -2.14663174 | Down | 5.95E-23 | 6.85E-22 |
P-values were corrected. TPM: Transcripts per kilobase million; FDR: False discovery rate; TNF: Tumor necrosis factor.
Figure 11.
Regulatory mechanism of the PI3K-AKT signal pathway in different groups. A: Vascular cell adhesion molecule-1 group; B: Tumor necrosis factor α group; C: Interleukin 6 group. Up-regulated genes are marked with red borders and down-regulated genes with green borders. Unchanged genes are marked with black borders.
Figure 12.
Regulatory mechanism of the MAPK signal pathway in different groups. A: Vascular cell adhesion molecule-1 group; B: Tumor necrosis factor α group; C: Interleukin 6 group. Up-regulated genes are marked with red borders and down-regulated genes with green borders. Unchanged genes are marked with black borders.
MSCs-exo promote endothelial cell angiogenesis
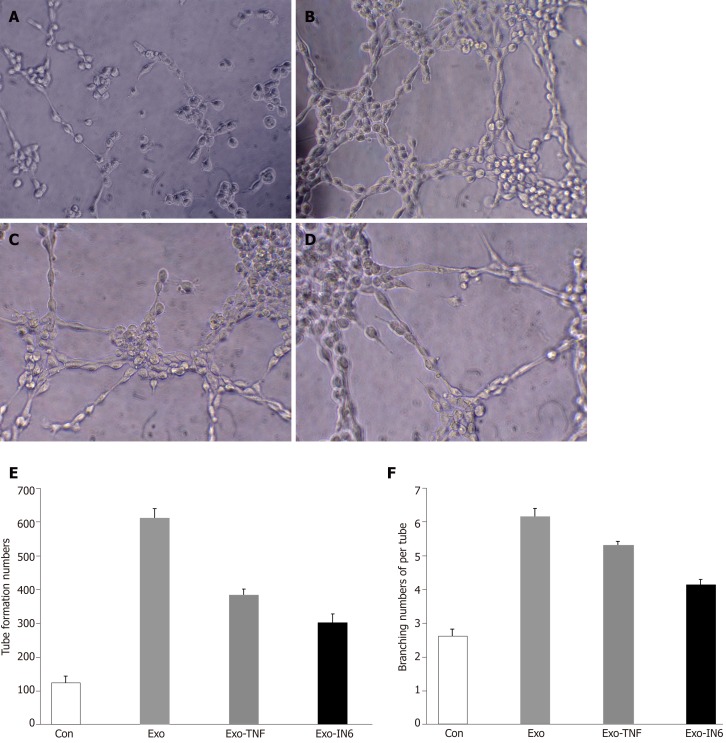
The ability of MSCs-exo to enhance tube formation was assessed using a Matrigel assay. MSCs-exo, on average, caused an increase in tube formation and branching (P < 0.05; Figure 14) compared to the untreated control group. The angiogenesis effect of MSCs-exo stimulated with TNFα and IL6 was lower than that cultured without TNFα or IL6. This finding confirmed that MSCs-exo can promote angiogenesis (Figure 14).
Figure 14.
Tube formation in endothelial cells treated with mesenchymal stem cell exosomes. A: Micrograph showing human umbilical vein endothelial cells (HUVECs) cultured on Matrigel-coated plates in medium with phosphate buffered saline (control); B: Micrograph showing HUVECs cultured on Matrigel-coated plates in medium with mesenchymal stem cell exosomes (MSC-exo); C: Micrograph showing HUVECs cultured on Matrigel-coated plates in medium with MSCs-exo stimulated with tumor necrosis factor α; D: Micrograph showing HUVECs cultured on Matrigel-coated plates in medium with MSCs-exo stimulated with interleukin 6; E: The number of tubes formed in each group; F: The number of branching points in each group.
MSCs-exo stimulated with IL6 inhibit PI3K-AKT signaling pathway activation in endothelial cells
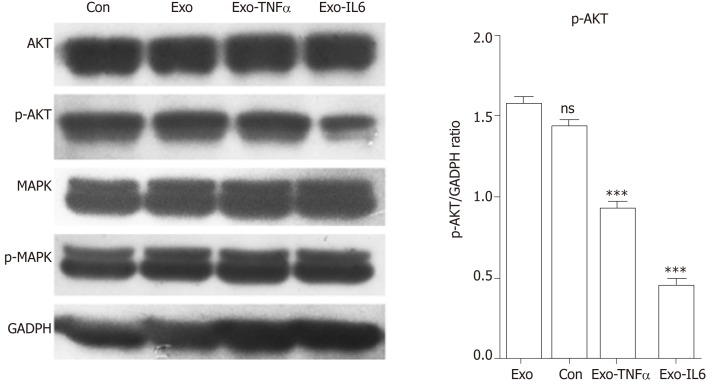
We observed a decline in the expression of phosphorylated AKT (pAKT) in endothelial cells after MSCs-exo were stimulated with IL6, although MSC-EV treatment had no effect on the expression of their unphosphorylated forms (Figure 15).
Figure 15.
Western blot analysis. Western blot was performed to detect the expression of the indicated proteins in endothelial cells treated with phosphate buffered saline (control), mesenchymal stem cell exosomes (MSCs-exo), MSCs-exoTNFα (stimulated with tumor necrosis factor α), MSCs-exoIL6 (stimulated with interleukin 6). GAPDH was used as an internal loading control. TNF: Tumor necrosis factor; IL6: Interleukin 6.
DISCUSSION
MSCs have been used to treat cardiovascular diseases (CVDs) and represent a promising cell-based therapy for regenerative medicine and the treatment of inflammatory and autoimmune diseases[22]. Their treatment efficacy hinges on their ability to alter disease-specific pathways via secreted miRNAs, so it is imperative to understand how disease environments, which often are inflammatory, can impact secreted miRNAs and thus potentially their treatment efficacy. MSCs-exosomes are used for treating CVDs such as acute myocardial infarction, stroke, pulmonary hypertension, and septic cardiomyopathy[23]. Biological properties of MSCs-exo have rendered them as a new strategy for wound regeneration and ischemic disease[24-26]. MSCs-exo exert an anti-inflammatory effect on T and B lymphocytes independently of MSCs priming. The potential therapeutic effects also were demonstrated in inflammatory arthritis[27].
Ischemic diseases, trauma, and immunological diseases are all accompanied by inflammatory reactions, and a large number of inflammatory cytokines including VCAM-1, TNFα, and IL6 are involved in the progression of these diseases. T cells are activated dependent on VCAM-1 interactions[28]. VCAM-1 plays a “backup” role in hASC contact-dependent immune suppression[29]. TNFα is a multifunctional cytokine that acts as a central biological mediator for critical immune functions, including inflammation, infection, and antitumor responses[30]. IL6 plays an important role in the inflammatory response following hypoxic-ischemic encephalopathy[31]. Therefore, the biological properties of MSCs-exos and their therapeutic effects need to be studied together with the inflammatory factors. A large amount of evidence suggests that the effect of MSCs-exo therapeutics will be affected by the inflammatory environment with regard to most of CVDs and ischemic diseases[32-40].
Some previous reports showed[41] the effect of stimulation with cytokines interferon γ and TNFα on adipose MSCs (AMSCs). Pro-inflammatory stimuli could enhance the immunosuppressive functions of AMSC-derived exosomes. There was an increase in the expression of miRNAs (miR-34a-5p, miR21, and miR146a-5p) in exosomes produced by pre-activated AMSCs compared to those released by untreated cells.
The present study also found that the inflammatory cytokines VCAM-1, TNFα, and IL6 impact the size and morphology of MSCs-exo as well as the diversity of miRNAs they can produce, especially miRNAs impacting angiogenesis. According to GO enrichment analysis, miRNAs in exosomes exposed to inflammatory cytokines, compared to controls, had a different regulatory effect on cellular proliferation and differentiation, molecular signal transduction, immunosuppressive functions, angiogenesis and so on.
Some observed effects suggested that inflammatory cytokines impaired the ability of MSCs-exo to promote angiogenesis. For example, the TNFα and IL6 groups exhibited decreased numbers of angiogenesis-related miRNAs, such as miR-196a-5p, miR-17-5p, miR-146b-5p, miR-21-3p, and miR-320. The same groups also had downregulated angiogenesis-related signaling pathways, such as PI3K-AKT, MAPK, and VEGF. However, other effects suggested that inflammatory cytokines may promote the ability of MSCs-exo to encourage angiogenesis. Exosomes contained hsa-mir-4488, hsa-mir-671-5p, and hsa-mir-4446-3p after VCAM-1 stimulation, hsa-mir-4488, hsa-mir-671-5p, and hsa-miR-497-5p after TNFα stimulation, and hsa-mir-4488, hsa-miR-145-5p, and hsa-miR-1260a after IL6 stimulation, all of which promote angiogenesis. More specifically, hsa-miR-671-5p encourages NM_006500.2 to produce the downstream product VEGFb, which activates the VEGF pathway and thereby promotes angiogenesis. Hsa-miR-671-5p also encourages NM_001773.2 to produce CD34, which in turn activates the PI3K-AKT pathway, this promoting cell proliferation and angiogenesis. It is unclear what the ultimate results of these competing effects on angiogenesis would be.
Our study demonstrated that MSCs-exo perhaps induced HUVECs to form capillary-like structures in vitro. The effect of MSCs-exo in promoting angiogenesis would be reduced when the stem cells were subjected to TNFα and IL6 stimulation. Besides endothelial cell angiogenesis-related molecular expression, functional characteristics such as the PI3K-AKT signaling pathway may be down-regulated in MSCs-exo that were stimulated with IL6.
The major limitation of this study is that it was conducted in vitro. Further research needs to be conducted in vivo using an animal model that more closely mirrors the inflammatory environment to which MSCs are exposed when administered for treatment in humans.
In conclusion, inflammatory cytokines may lead to changes in exosomal miRNAs that abnormally impact cellular components, molecular function, and biological processes. Further in vivo research needs to be conducted to explore how the treatment efficacy of MSCs is impacted by these inflammatory-induced changes in exosomes and their miRNAs.
ARTICLE HIGHLIGHTS
Research background
Stem cell transplantation has been developing rapidly and has resulted in breakthroughs for the treatment of various diseases.
Research motivation
Treatments utilizing stems cells often require stem cells to be exposed to inflammatory environments, such as vascular cell adhesion molecule-1, tumor necrosis factor α (TNFα), and interleukin 6 (IL6). Stem cell-derived exosomes are especially important in producing miRNAs that impact angiogenesis.
Research objectives
MicroRNAs (miRNAs) are RNAs 0-20 nucleotides in length, which are derived from hairpin-like precursor miRNAs. They acts as important regulators of mRNA expression. It has been reported that miRNAs play critical roles in some cells and have the potential as diagnostic and therapeutic biomarkers.
Research methods
The morphology and quantity of mesenchymal stem cell (MSC) exosomes (MSCs-exo) are influenced by different inflammatory cytokine environments.
Research results
The morphology and quantity of each group of MSC exosomes were observed and measured. The miRNAs in MSCs-exo were sequenced. Differential expression of miRNAs and their target genes as well as the related regulatory mechanisms were researched.
Research conclusions
TNFα and IL6 may influence the expression of miRNAs that down-regulate the PI3K-AKT, MAPK, and VEGF signaling pathways; particularly, IL6 significantly down-regulates the PI3K-AKT signaling pathway.
Research perspectives
Overall, inflammatory cytokines may lead to changes in exosomal miRNAs that abnormally impact cellular components, molecular function, and biological process, particularly angiogenesis.
ACKNOWLEDGEMENTS
The authors would like to thank all members of the Jinan University Biomedical Translational Research Institute Laboratory who provided us with critical comments and support.
Footnotes
Conflict-of-interest statement: The authors declare that they have no conflict of interest.
Manuscript source: Unsolicited manuscript
Peer-review started: January 29, 2019
First decision: March 14, 2019
Article in press: July 30, 2019
Specialty type: Cell and tissue engineering
Country of origin: China
Peer-review report classification
Grade A (Excellent): A
Grade B (Very good): B, B, B
Grade C (Good): 0
Grade D (Fair): D
Grade E (Poor): E
P-Reviewer: Grawish ME, Labusca L, Li SC, Micheu MM, Saeki K, Vladimir H S-Editor: Ji FF L-Editor: Wang TQ E-Editor: Xing YX
Contributor Information
Chen Huang, Department of Minimally Invasive Interventional Radiology, Guangzhou Panyu Central Hospital, Guangzhou 511400, Guangdong Province, China; Jinan University, Guangzhou 510632, Guangdong Province, China; Medical Imaging Institute of Panyu, Guangzhou 511400, Guangdong Province, China.
Wen-Feng Luo, Department of Minimally Invasive Interventional Radiology, Guangzhou Panyu Central Hospital, Guangzhou 511400, Guangdong Province, China; Medical Imaging Institute of Panyu, Guangzhou 511400, Guangdong Province, China.
Yu-Feng Ye, Department of Minimally Invasive Interventional Radiology, Guangzhou Panyu Central Hospital, Guangzhou 511400, Guangdong Province, China; Medical Imaging Institute of Panyu, Guangzhou 511400, Guangdong Province, China.
Li Lin, Jinan University Biomedical Translational Research Institute, Jinan University, Guangzhou 510632, Guangdong Province, China.
Zhe Wang, Department of Pharmacy, the First Affiliated Hospital of Guangdong Pharmaceutical University, Guangzhou 510080, Guangdong Province, China.
Ming-Hua Luo, Department of Radiology, Shiyan People’s Hospital, Shenzhen 518108, Guangdong Province, China.
Qi-De Song, Department of Minimally Invasive Interventional Radiology, Guangzhou Panyu Central Hospital, Guangzhou 511400, Guangdong Province, China.
Xue-Ping He, Department of Minimally Invasive Interventional Radiology, Guangzhou Panyu Central Hospital, Guangzhou 511400, Guangdong Province, China.
Han-Wei Chen, Department of Minimally Invasive Interventional Radiology, Guangzhou Panyu Central Hospital, Guangzhou 511400, Guangdong Province, China; Jinan University, Guangzhou 510632, Guangdong Province, China; Medical Imaging Institute of Panyu, Guangzhou 511400, Guangdong Province, China.
Yi Kong, Department of Pharmacy, the First Affiliated Hospital of Guangdong Pharmaceutical University, Guangzhou 510080, Guangdong Province, China.
Yu-Kuan Tang, Department of Minimally Invasive Interventional Radiology, Guangzhou Panyu Central Hospital, Guangzhou 511400, Guangdong Province, China. tyk20126@126.com.
References
- 1.Ong SG, Lee WH, Huang M, Dey D, Kodo K, Sanchez-Freire V, Gold JD, Wu JC. Cross talk of combined gene and cell therapy in ischemic heart disease: role of exosomal microRNA transfer. Circulation. 2014;130:S60–S69. doi: 10.1161/CIRCULATIONAHA.113.007917. [DOI] [PMC free article] [PubMed] [Google Scholar]
- 2.Wang Y, Zhang L, Li Y, Chen L, Wang X, Guo W, Zhang X, Qin G, He SH, Zimmerman A, Liu Y, Kim IM, Weintraub NL, Tang Y. Exosomes/microvesicles from induced pluripotent stem cells deliver cardioprotective miRNAs and prevent cardiomyocyte apoptosis in the ischemic myocardium. Int J Cardiol. 2015;192:61–69. doi: 10.1016/j.ijcard.2015.05.020. [DOI] [PMC free article] [PubMed] [Google Scholar]
- 3.Phinney DG, Di Giuseppe M, Njah J, Sala E, Shiva S, St Croix CM, Stolz DB, Watkins SC, Di YP, Leikauf GD, Kolls J, Riches DW, Deiuliis G, Kaminski N, Boregowda SV, McKenna DH, Ortiz LA. Mesenchymal stem cells use extracellular vesicles to outsource mitophagy and shuttle microRNAs. Nat Commun. 2015;6:8472. doi: 10.1038/ncomms9472. [DOI] [PMC free article] [PubMed] [Google Scholar]
- 4.Xu L, Yang BF, Ai J. MicroRNA transport: a new way in cell communication. J Cell Physiol. 2013;228:1713–1719. doi: 10.1002/jcp.24344. [DOI] [PubMed] [Google Scholar]
- 5.Kourembanas S. Exosomes: vehicles of intercellular signaling, biomarkers, and vectors of cell therapy. Annu Rev Physiol. 2015;77:13–27. doi: 10.1146/annurev-physiol-021014-071641. [DOI] [PubMed] [Google Scholar]
- 6.Li P, Kaslan M, Lee SH, Yao J, Gao Z. Progress in Exosome Isolation Techniques. Theranostics. 2017;7:789–804. doi: 10.7150/thno.18133. [DOI] [PMC free article] [PubMed] [Google Scholar]
- 7.Ha M, Kim VN. Regulation of microRNA biogenesis. Nat Rev Mol Cell Biol. 2014;15:509–524. doi: 10.1038/nrm3838. [DOI] [PubMed] [Google Scholar]
- 8.Condorelli G, Latronico MV, Cavarretta E. microRNAs in cardiovascular diseases: current knowledge and the road ahead. J Am Coll Cardiol. 2014;63:2177–2187. doi: 10.1016/j.jacc.2014.01.050. [DOI] [PubMed] [Google Scholar]
- 9.Saraiya AA, Li W, Wang CC. Transition of a microRNA from repressing to activating translation depending on the extent of base pairing with the target. PLoS One. 2013;8:e55672. doi: 10.1371/journal.pone.0055672. [DOI] [PMC free article] [PubMed] [Google Scholar]
- 10.Valinezhad Orang A, Safaralizadeh R, Kazemzadeh-Bavili M. Mechanisms of miRNA-Mediated Gene Regulation from Common Downregulation to mRNA-Specific Upregulation. Int J Genomics. 2014;2014:970607. doi: 10.1155/2014/970607. [DOI] [PMC free article] [PubMed] [Google Scholar]
- 11.György B, Szabó TG, Pásztói M, Pál Z, Misják P, Aradi B, László V, Pállinger E, Pap E, Kittel A, Nagy G, Falus A, Buzás EI. Membrane vesicles, current state-of-the-art: emerging role of extracellular vesicles. Cell Mol Life Sci. 2011;68:2667–2688. doi: 10.1007/s00018-011-0689-3. [DOI] [PMC free article] [PubMed] [Google Scholar]
- 12.Tooi M, Komaki M, Morioka C, Honda I, Iwasaki K, Yokoyama N, Ayame H, Izumi Y, Morita I. Placenta Mesenchymal Stem Cell Derived Exosomes Confer Plasticity on Fibroblasts. J Cell Biochem. 2016;117:1658–1670. doi: 10.1002/jcb.25459. [DOI] [PubMed] [Google Scholar]
- 13.Théry C, Amigorena S, Raposo G, Clayton A. Isolation and characterization of exosomes from cell culture supernatants and biological fluids. Curr Protoc Cell Biol. 2006;Chapter 3:Unit 3.22. doi: 10.1002/0471143030.cb0322s30. [DOI] [PubMed] [Google Scholar]
- 14.Tang C, Xie Y, Yan W. AASRA: An Anchor Alignment-Based Small RNA Annotation Pipeline. Bioinformatics. 2008;24:i112–118. [Google Scholar]
- 15.Nawrocki EP, Eddy SR. Infernal 1.1: 100-fold faster RNA homology searches. Bioinformatics. 2013;29:2933–2935. doi: 10.1093/bioinformatics/btt509. [DOI] [PMC free article] [PubMed] [Google Scholar]
- 16.'t Hoen PA, Ariyurek Y, Thygesen HH, Vreugdenhil E, Vossen RH, de Menezes RX, Boer JM, van Ommen GJ, den Dunnen JT. Deep sequencing-based expression analysis shows major advances in robustness, resolution and inter-lab portability over five microarray platforms. Nucleic Acids Res. 2008;36:e141. doi: 10.1093/nar/gkn705. [DOI] [PMC free article] [PubMed] [Google Scholar]
- 17.Krüger J, Rehmsmeier M. RNAhybrid: microRNA target prediction easy, fast and flexible. Nucleic Acids Res. 2006;34:W451–W454. doi: 10.1093/nar/gkl243. [DOI] [PMC free article] [PubMed] [Google Scholar]
- 18.John B, Enright AJ, Aravin A, Tuschl T, Sander C, Marks DS. Human MicroRNA targets. PLoS Biol. 2004;2:e363. doi: 10.1371/journal.pbio.0020363. [DOI] [PMC free article] [PubMed] [Google Scholar]
- 19.Agarwal V, Bell GW, Nam JW, Bartel DP. Predicting effective microRNA target sites in mammalian mRNAs. Elife. 2015:4. doi: 10.7554/eLife.05005. [DOI] [PMC free article] [PubMed] [Google Scholar]
- 20.Benjamini Y, Yekutieli D. The control of the false discovery rate in multiple testing under dependency. Ann Stat. 2001;29:1165–1188. [Google Scholar]
- 21.Kanehisa M, Araki M, Goto S, Hattori M, Hirakawa M, Itoh M, Katayama T, Kawashima S, Okuda S, Tokimatsu T, Yamanishi Y. KEGG for linking genomes to life and the environment. Nucleic Acids Res. 2008;36:D480–D484. doi: 10.1093/nar/gkm882. [DOI] [PMC free article] [PubMed] [Google Scholar]
- 22.de Araújo Farias V, Carrillo-Gálvez AB, Martín F, Anderson P. TGF-β and mesenchymal stromal cells in regenerative medicine, autoimmunity and cancer. Cytokine Growth Factor Rev. 2018;43:25–37. doi: 10.1016/j.cytogfr.2018.06.002. [DOI] [PubMed] [Google Scholar]
- 23.Suzuki E, Fujita D, Takahashi M, Oba S, Nishimatsu H. Therapeutic Effects of Mesenchymal Stem Cell-Derived Exosomes in Cardiovascular Disease. Adv Exp Med Biol. 2017;998:179–185. doi: 10.1007/978-981-10-4397-0_12. [DOI] [PubMed] [Google Scholar]
- 24.Goodarzi P, Larijani B, Alavi-Moghadam S, Tayanloo-Beik A, Jahani F, Ranjbaran N, Payab M, Falahzadeh K, Mousavi M, Arjmand B. Mesenchymal Stem Cells-Derived Exosomes for Wound Regeneration. Adv Exp Med Biol. 2018:1–13. doi: 10.1007/5584_2018_251. [DOI] [PubMed] [Google Scholar]
- 25.Komaki M, Numata Y, Morioka C, Honda I, Tooi M, Yokoyama N, Ayame H, Iwasaki K, Taki A, Oshima N, Morita I. Exosomes of human placenta-derived mesenchymal stem cells stimulate angiogenesis. Stem Cell Res Ther. 2017;8:219. doi: 10.1186/s13287-017-0660-9. [DOI] [PMC free article] [PubMed] [Google Scholar]
- 26.Gangadaran P, Rajendran RL, Lee HW, Kalimuthu S, Hong CM, Jeong SY, Lee SW, Lee J, Ahn BC. Extracellular vesicles from mesenchymal stem cells activates VEGF receptors and accelerates recovery of hindlimb ischemia. J Control Release. 2017;264:112–126. doi: 10.1016/j.jconrel.2017.08.022. [DOI] [PubMed] [Google Scholar]
- 27.Cosenza S, Toupet K, Maumus M, Luz-Crawford P, Blanc-Brude O, Jorgensen C, Noël D. Mesenchymal stem cells-derived exosomes are more immunosuppressive than microparticles in inflammatory arthritis. Theranostics. 2018;8:1399–1410. doi: 10.7150/thno.21072. [DOI] [PMC free article] [PubMed] [Google Scholar]
- 28.Majumdar MK, Keane-Moore M, Buyaner D, Hardy WB, Moorman MA, McIntosh KR, Mosca JD. Characterization and functionality of cell surface molecules on human mesenchymal stem cells. J Biomed Sci. 2003;10:228–241. doi: 10.1007/BF02256058. [DOI] [PubMed] [Google Scholar]
- 29.Rubtsov Y, Goryunov К, Romanov А, Suzdaltseva Y, Sharonov G, Tkachuk V. Molecular Mechanisms of Immunomodulation Properties of Mesenchymal Stromal Cells: A New Insight into the Role of ICAM-1. Stem Cells Int. 2017;2017:6516854. doi: 10.1155/2017/6516854. [DOI] [PMC free article] [PubMed] [Google Scholar]
- 30.Zaka M, Abbasi BH, Durdagi S. Novel Tumor Necrosis Factor-α (TNF-α) Inhibitors from Small Molecule Library Screening for their Therapeutic Activity Profiles against Rheumatoid Arthritis using Target-Driven Approaches and Binary QSAR Models. J Biomol Struct Dyn. 2018:1–26. doi: 10.1080/07391102.2018.1491423. [DOI] [PubMed] [Google Scholar]
- 31.Gillani Q, Ali M, Iqbal F. Effect of GABAB receptor antagonists (CGP 35348 and CGP 55845) on serum interleukin 6 and 18 concentrations in albino mice following neonatal hypoxia ischemia insult. Pak J Pharm Sci. 2016;29:1503–1508. [PubMed] [Google Scholar]
- 32.Wang N, Chen C, Yang D, Liao Q, Luo H, Wang X, Zhou F, Yang X, Yang J, Zeng C, Wang WE. Mesenchymal stem cells-derived extracellular vesicles, via miR-210, improve infarcted cardiac function by promotion of angiogenesis. Biochim Biophys Acta Mol Basis Dis. 2017;1863:2085–2092. doi: 10.1016/j.bbadis.2017.02.023. [DOI] [PubMed] [Google Scholar]
- 33.Zhang J, Chen C, Hu B, Niu X, Liu X, Zhang G, Zhang C, Li Q, Wang Y. Exosomes Derived from Human Endothelial Progenitor Cells Accelerate Cutaneous Wound Healing by Promoting Angiogenesis Through Erk1/2 Signaling. Int J Biol Sci. 2016;12:1472–1487. doi: 10.7150/ijbs.15514. [DOI] [PMC free article] [PubMed] [Google Scholar]
- 34.Hashemzadeh MR. Role of micro RNAs in stem cells, cardiac differentiation and cardiovascular diseases J. Gene Reports. 2017;8:11–16. [Google Scholar]
- 35.Xu J, Wu W, Zhang L, Dorset-Martin W, Morris MW, Mitchell ME, Liechty KW. The role of microRNA-146a in the pathogenesis of the diabetic wound-healing impairment: correction with mesenchymal stem cell treatment. Diabetes. 2012;61:2906–2912. doi: 10.2337/db12-0145. [DOI] [PMC free article] [PubMed] [Google Scholar]
- 36.Moura LI, Cruz MT, Carvalho E. The effect of neurotensin in human keratinocytes--implication on impaired wound healing in diabetes. Exp Biol Med (Maywood) 2014;239:6–12. doi: 10.1177/1535370213510665. [DOI] [PubMed] [Google Scholar]
- 37.Harting MT, Srivastava AK, Zhaorigetu S, Bair H, Prabhakara KS, Toledano Furman NE, Vykoukal JV, Ruppert KA, Cox CS, Jr, Olson SD. Inflammation-Stimulated Mesenchymal Stromal Cell-Derived Extracellular Vesicles Attenuate Inflammation. Stem Cells. 2018;36:79–90. doi: 10.1002/stem.2730. [DOI] [PubMed] [Google Scholar]
- 38.Li H, Liu J, Wang Y, Fu Z, Hüttemann M, Monks TJ, Chen AF, Wang JM. MiR-27b augments bone marrow progenitor cell survival via suppressing the mitochondrial apoptotic pathway in Type 2 diabetes. Am J Physiol Endocrinol Metab. 2017;313:E391–E401. doi: 10.1152/ajpendo.00073.2017. [DOI] [PMC free article] [PubMed] [Google Scholar]
- 39.Brennan E, Wang B, McClelland A, Mohan M, Marai M, Beuscart O, Derouiche S, Gray S, Pickering R, Tikellis C, de Gaetano M, Barry M, Belton O, Ali-Shah ST, Guiry P, Jandeleit-Dahm KAM, Cooper ME, Godson C, Kantharidis P. Protective Effect of let-7 miRNA Family in Regulating Inflammation in Diabetes-Associated Atherosclerosis. Diabetes. 2017;66:2266–2277. doi: 10.2337/db16-1405. [DOI] [PubMed] [Google Scholar]
- 40.Mathiyalagan P, Liang Y, Kim D, Misener S, Thorne T, Kamide CE, Klyachko E, Losordo DW, Hajjar RJ, Sahoo S. Angiogenic Mechanisms of Human CD34+ Stem Cell Exosomes in the Repair of Ischemic Hindlimb. Circ Res. 2017;120:1466–1476. doi: 10.1161/CIRCRESAHA.116.310557. [DOI] [PMC free article] [PubMed] [Google Scholar]
- 41.Domenis R, Cifù A, Quaglia S, Pistis C, Moretti M, Vicario A, Parodi PC, Fabris M, Niazi KR, Soon-Shiong P, Curcio F. Pro inflammatory stimuli enhance the immunosuppressive functions of adipose mesenchymal stem cells-derived exosomes. Sci Rep. 2018;8:13325. doi: 10.1038/s41598-018-31707-9. [DOI] [PMC free article] [PubMed] [Google Scholar]


