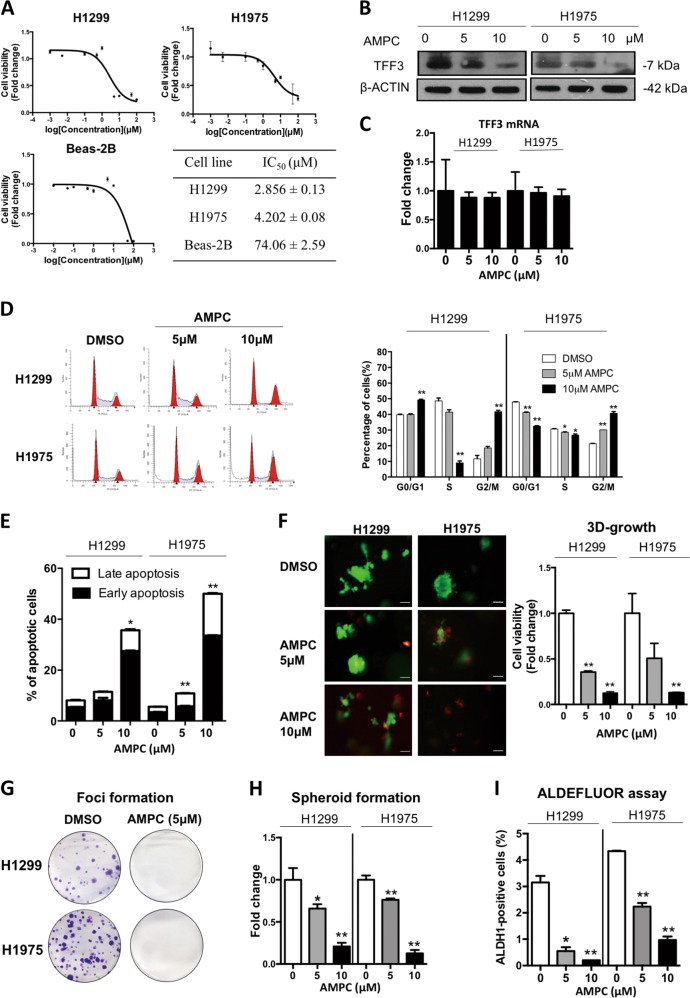
Fig. 3. Inhibition of TFF3 by AMPC decreases oncogenicity of H1299 and H1975 cells.
a Cell viability IC50 of AMPC in H1299, H1975, and BEAS-2B cells (Bronchial epithelial cells from normal lung). b TFF3 protein levels after AMPC treatment were analyzed by western blot analysis. β-ACTIN was used as an input control. c TFF3 mRNA expression levels after AMPC treatment were analyzed by qPCR. β-ACTIN was used as an input control. d Cell-cycle analysis after 24 h AMPC treatment. The percentages of cells in each cell-cycle phase are plotted, and statistical significance in the difference in the percentages of AMPC- and vehicle DMSO-treated cells in each phase is shown. e Annexin-V/PI apoptotic cell death was determined after 24 h AMPC treatment. The percentages of early apoptotic (Annexin-V-positive/PI-negative) and late apoptotic (Annexin-V-positive/PI-positive) cells are plotted, and statistical significance in the difference in the percentages of apoptotic cells between AMPC- and vehicle DMSO-treated cells is shown. f 3D Matrigel growth. Cells were cultured in 5% FBS medium containing 4% Matrigel for 4 days prior to treatment with AMPC for 6 days. Live cells were stained by calcein-AM (green color), and dead cells were stained by PI (red color). Scale bar: 100 μm. The fold change in cell viability after AMPC treatment is shown in the histogram. g Foci formation. Cells were seeded in six-well plates, and treated with the indicated concentrations of AMPC for a period of 12 days. The resulting foci formed are fixed and stained with crystal violet. h Spheroid-formation assay. Cells were seeded in ultralow attachment plates in spheroid growth media, and treated with the indicated concentrations of AMPC. After 14 days, spheroid growth was measured by AlamarBlue. The fold change in cell viability after AMPC treatment is shown in the histogram. i ALDEFLUORTM assay. H1299 and H1975 cells were treated with AMPC for 24 h. The cells were incubated with ALDEFLOUR substrate (BAAA, BoDIPY®-aminoacetaldehyde) to define the ALDH1-positive population while a specific inhibitor of ALDH1 (DEAB) was used to establish baseline fluorescence. The percentages of ALDH1-positive cells after AMPC treatment were determined by flow cytometry. The data are expressed as mean ± S.E.M. *p < 0.05; **p < 0.01

