Abstract
As an immune checkpoint, Tim-3 plays roles in the regulation of both adaptive and innate immune cells including macrophages and is greatly involved in chronic liver diseases. However, the precise roles of Tim-3 in nonalcoholic steatohepatitis (NASH) remain unstated. In the current study, we analyzed Tim-3 expression on different subpopulations of liver macrophages and further investigated the potential roles of Tim-3 on hepatic macrophages in methionine and choline-deficient diet (MCD)-induced NASH mice. The results of flow cytometry demonstrated the significantly increased expression of Tim-3 on all detected liver macrophage subsets in MCD mice, including F4/80+CD11b+, F4/80+CD68+, and F4/80+CD169+ macrophages. Remarkably, Tim-3 knockout (KO) significantly accelerated MCD-induced liver steatosis, displaying higher serum ALT, larger hepatic vacuolation, more liver lipid deposition, and more severe liver fibrosis. Moreover, compared with wild-type C57BL/6 mice, Tim-3 KO MCD mice demonstrated an enhanced expression of NOX2, NLRP3, and caspase-1 p20 together with increased generation of IL-1β and IL-18 in livers. In vitro studies demonstrated that Tim-3 negatively regulated the production of reactive oxygen species (ROS) and related downstream pro-inflammatory cytokine secretion of IL-1β and IL-18 in macrophages. Exogenous administration of N-Acetyl-L-cysteine (NAC), a small molecular inhibitor of ROS, remarkably suppressed caspase-1 p20 expression and IL-1β and IL-18 production in livers of Tim-3 KO mice, thus significantly reducing the severity of steatohepatitis induced by MCD. In conclusion, Tim-3 is a promising protector in MCD-induced steatohepatitis by controlling ROS and the associated pro-inflammatory cytokine production in macrophages.
Key words: macrophage, NASH, ROS, Tim-3
Introduction
As the most common chronic liver disease, nonalcoholic fatty liver disease (NAFLD) affects human health worldwide.1 While most patients with NAFLD remain asymptomatic, 20% progress to develop nonalcoholic steatohepatitis (NASH), a more serious condition that is widely defined as steatosis accompanied by inflammation. NASH can in turn result in cirrhosis and hepatocellular carcinoma (HCC).2 The process and pathogenesis of NAFLD is extremely complex, multifactorial, and only partially understood. Massive liver fat accumulation or hepatic steatosis is the first step and the typical symptom of NAFLD, but itself does not cause NASH.3 Multiple hits, mainly including insulin resistance, oxidative stress owing to excessive production of reactive oxygen species (ROS), and inflammation, account for severe liver injury in NASH.4 As a risk factor, oxidative stress initiates the generation of inflammatory cytokines, leading to inflammation and a fibrogenic response in NASH.5 Thus, identifying a key regulator that can interfere with ROS-mediated liver inflammation in NASH mice is of great importance.
Accumulated evidence suggests that innate immune dysfunction contributes to the aggravation of liver damage in NAFLD.6 As the most abundant hepatic innate immune cells, Kupffer cells (KCs) are roughly 20% of hepatic nonparenchymal cells, and they greatly contribute to the pathogenesis of NAFLD.7 Activated KCs generate various mediators, including ROS and pro-inflammatory cytokines that directly lead to hepatocyte injury and affect the outcome of NASH.8 Indeed, liver macrophages contribute to the activation of the inflammasome and to the production of interleukin (IL)-1β in NASH.9 Antagonizing monocyte chemotactic protein 1 efficiently diminishes the infiltration of liver macrophages and reduces steatohepatitis in NASH mice.10 Therefore, targeting macrophages, especially the ROS/inflammation axis in macrophages, is a possible treatment strategy.
T-cell immunoglobulin and mucin-domain-containing protein-3 (Tim-3) was first identified as a specific cell surface marker of Th1 cells,11 and it is responsible for the exhaustion of T cells in either chronic virus infection or tumorigenesis.12, 13 The accumulated data have shown the expression of Tim-3 on innate immune cells such as NKT cells, NK cells, and macrophages, where Tim-3 displays diverse regulatory roles.14 Tim-3 is constitutively expressed on monocytes and macrophages and can be regulated by different stimuli. Abundant Tim-3 expression could be detected on either a THP-1 cell line or on human peripheral CD14+ monocytes in a quiescent state with low cytokine secretion,15 while lipopolysaccharide (LPS) and TLR4/7 ligands decrease the expression of Tim-3 and increase the secretion of IL-12 in macrophages.16 By interacting with the local microenvironment, Tim-3 on macrophages plays distinct functions in diverse disease models. tumor growth factor-β in the tumor microenvironment promotes Tim-3 expression and suppresses classical macrophage activation, leading to the progression of tumor growth.17 Tim-3+CD14+ monocytes have a positive correlation with serum alanine transaminase (ALT) in individuals with chronic HBV infection.18 In contrast, Tim-3 in microglia is distinctly increased, and Tim-3 blockade alleviates hypoxia-induced brain damage, indicating that Tim-3 acts as a linker between inflammation and ischemia-induced brain damage.19 However, whether Tim-3 regulates macrophage-derived ROS and ROS-mediated liver inflammation in NASH mice induced by methionine and choline-deficient diet (MCD) remains completely unknown. Here, in the present study, we displayed enhanced Tim-3 expression in different subpopulations of hepatic macrophages in MCD mice and showed evidence supporting the critical role of Tim-3 in alleviating liver injury by regulating ROS production and pro-inflammatory cytokine secretion from macrophages after MCD treatment.
Materials and methods
Animal experiments
C57BL/6 mice were offered by Shandong University Experimental Animal Center. Tim-3 TALEN (Tim-3 KO) mice were generated by Sidansai Biotechnology Company. A MCD and high-fat diet (HFD) were utilized to build NASH animal models. Briefly, 8–10-week-old male mice were fed the MCD (MD12052, Medicience, Yangzhou, China) for 2 or 3 weeks, while 4-week-old male mice were fed with HFD (MD12032, Medicience) for 24 weeks. N-Acetyl-L-cysteine (NAC; A9165, Sigma, St. Louis, MO, USA) was administered as 150 mg/kg i.p. twice a week to eliminate ROS in MCD mice. All mice were raised under specific pathogen-free conditions, following the procedures approved by the Animal Care and Use Committee of Shandong University.
Transmission electron microscopy
The ultrastructures of hepatocytes from wild-type (WT) and Tim-3 KO mice were analyzed after 3 weeks of MCD diet. The tissues were sliced into cubes ≤1 m3 and were immersed into 2.5% glutaraldehyde before they were sent to WeiYa company (Jinan, Shandong China) for transmission electron microscopy (TEM) analysis.
Masson staining
Liver fibrosis was accessed using Masson staining with liver tissue sections of WT and KO mice after a 3-week MCD treatment. A Masson Stain Kit was offered by Wuhan Servicebio Technology Company (G1006, Wuhan, China).
Fluorescent immunohistochemistry
Fluorescent immunohistochemistry was performed to judge the relevance of Tim-3 in human hepatic macrophages with NASH. Fixed paracancerous HCC tissue sections were obtained from the Department of Pathology from Qilu Hospital of Shandong University. Tissue sections were divided into two groups: tissues with hepatic vacuolation indicating potential lipid deposition (n = 10) and tissues without hepatic vacuolation (n = 8). As described before,20 Tim-3 expression on CD68+ human hepatic macrophages was detected. Antibodies and reagents were as follows: anti-Tim-3 (dilution: 1:100, mAb, 45208, CST, Boston, USA), anti-CD68 (dilution: 1:100, mAb, ab955, Abcam, Southampton, UK), DAPI (dilution: 1:1000, #4083, CST), and Tyramide (TSA)-conjugated fluorophore (dilution: 1:100, NEL791001KT, PerkinElmer, T20950, Life Technologies). The images were snapped by a Mantra system and were analyzed using inForm. 2.1 software.
Macrophage preparation and stimulation
Macrophages were prepared from liver, bone marrow, and peritoneal fluid of C57BL/6 mice as described previously.17, 21 For hepatic macrophage preparation, hepatic mononuclear cells were first separated by 40% Percoll gradients and then cultured at 37 °C with 5% CO2 for 2 h to allow the macrophages to adhere. After the non-adherent cells were removed, the hepatic macrophages were collected for further studies.21 Bone marrow-derived macrophages (BMDMs) were isolated from the femur bone and were induced by 100 ng/ml M-CSF for maturation.17 Peritoneal macrophages were starch-induced in vivo and were cultured for 4 h at 37 °C with 5% CO2 in vitro for adherence.22 To analyze the characteristics of fat-induced macrophages in vitro, freshly isolated macrophages were stimulated with either oleic acid (OA; O1383, Sigma) or palmitic acid (PA; P5585, Sigma). In addition, liver homogenate was used to stimulate macrophages, mimicking the NASH liver microenvironment. Briefly, mice were killed after treatment with MCD for 2 weeks and HFD for 6 months, and liver homogenates were prepared and mixed with fresh total culture medium at a ratio of 1:3. In addition, LPS was used at 1 μg/ml, and the cultured macrophages were harvested at 6 h for cFCM analysis and at 12 h for ELISA or western blot analysis.
Western blot and ELISA
Western blot analysis was performed with antibodies as follows: anti-NLRP3 (dilution: 1:1000, mAb, AG-20B-0014, Adipogen, San Diego, CA, USA), anti-Tim-3 (dilution: 1:500, pAb, ab185703, Abcam), anti-NOX2 (dilution: 1:400, pAb, BA2811, Boster, Wuhan, China), anti-caspase-1 p20 (dilution: 1:1000, mAb, AG-20B-0042, Adipogen), and anti-beta actin (dilution: 1:5000, mAb, 66009-1g-Ig, ProteinTech Group Inc., Chicago, USA). HRP-conjugated Affinipure Goat Anti-Mouse IgG(H+L) (dilution: 1:10000, SA00001-1, ProteinTech Group Inc.) and horseradish peroxidase (HRP)-conjugated Affinipure Goat Anti-Rabbit IgG (H+L; dilution: 1:10,000, SA00001-2, ProteinTech Group Inc.) were used as secondary antibodies. ELISA test kits were used to detect IL-1β (DKW12-2012-096, DAKEWE, Shenzhen, China), TNFα (DKW12-2720-96, DAKEWE), and IL-18 (CODE 7625, MBL, Nagoya, Japan) in cell culture supernatants and mouse liver homogenates.
Flow cytometry
Tim-3 and other surface markers of liver macrophages were analyzed by flow cytometry (FCM). Antibodies are indicated as follows: anti-mouse F4/80 PE-eFlour610 (61-4801-82, eBioscience, San Diego, CA, USA), anti-mouse CD11b APC (17-0112-82, eBioscience), anti-mouse CD68 PerCP-Cy5.5 (137010, Biolegend, San Diego, CA, USA), anti-mouse CD169 PE-Cy7 (142411, Biolegend), anti-mouse Tim-3 PE (12-5870-82, eBioscience), anti-mouse Tim-3 APC (119706, Biolegend), and anti-mouse NK1.1 PE-Cy7 (552878, BD Pharmingen, NJ, USA). FCM was performed according to the protocol. Briefly, liver mononuclear cells were isolated and aliquotted to 1 × 10⁶ cells/100 μl in FACS tubes. Thereafter, liver mononuclear cells were blocked with IgG (1 μg IgG/106 cells) for 10 min at room temperature. For identification of cell surface markers, the antibodies were incubated with liver mononuclear cells at 4 °C for 30 min and were washed with cold 1 × PBS thereafter. To determine the specificity of the FCM results, fluorescence-minus-one controls were performed according to the approaches as described.23, 24 The tests were detected by a Beckman CytoFLEX FCM, and the data were analyzed using CytExpert 2.0 software.
ROS detection
DCFH-DA (1 µM, S0033, Beyotime, China) or mitosox red (5 µM, M360008, Invitrogen, Carlsbad, CA, USA) was loaded into 1 × 10⁶ cells/100 μl, incubated at 37 °C for 20 min and washed twice with 1× PBS. ROS and mitochondrial ROS production were detected with Beckman CytoFLEX FCM and were analyzed using CytExpert 2.0 software.
PCR and real-time PCR
RNA was prepared with Trizol (15596-018, Invitrogen) and reversed-transcribed into cDNA. The primers used for PCR were as follows: Tim-3 forward primer 5′-ACTGGTGACCCTCCATAATAACA-3′, reverse primer 5′-ATTTTCCTCAGAGCGAATCCT-3′; β-actin forward primer 5′-TGCGTGACATCAAAGAGAAG-3′, reverse primer 5′-TCCATACCCAAGAAGGAAGG-3′; Acta2 forward primer 5′-GACGTACAACTGGTATTGTG-3′, reverse primer 5′-TCAGGATCTTCATGAGGTAG-3′; Mef2c forward primer 5′-TGTCCAGCCATAACAGTTTGG-3′, reverse primer 5′-GGTTGCCGTATCCATTCCCT-3′. PCR was performed using Taqman Universal PCR Master Mix, and RT-PCR was analyzed with a BIO-RAD RT-PCR CFX96 detecting system.
Oil Red O Staining
Frozen sections from WT or KO mice were stained with 0.3% Oil Red O staining reagent for 20 min and were counterstained with hematoxylin for 1 min.
Statistical analysis
The data are displayed as mean values ± SEM. In vitro and in vivo experiments were assessed in at least three independent experiments. Differences were evaluated using GraphPad Prism. Statistical significance was set at a p value < 0.05.
Results
Tim-3 is significantly increased in livers from MCD-induced NASH mice, and it acts as a protective factor
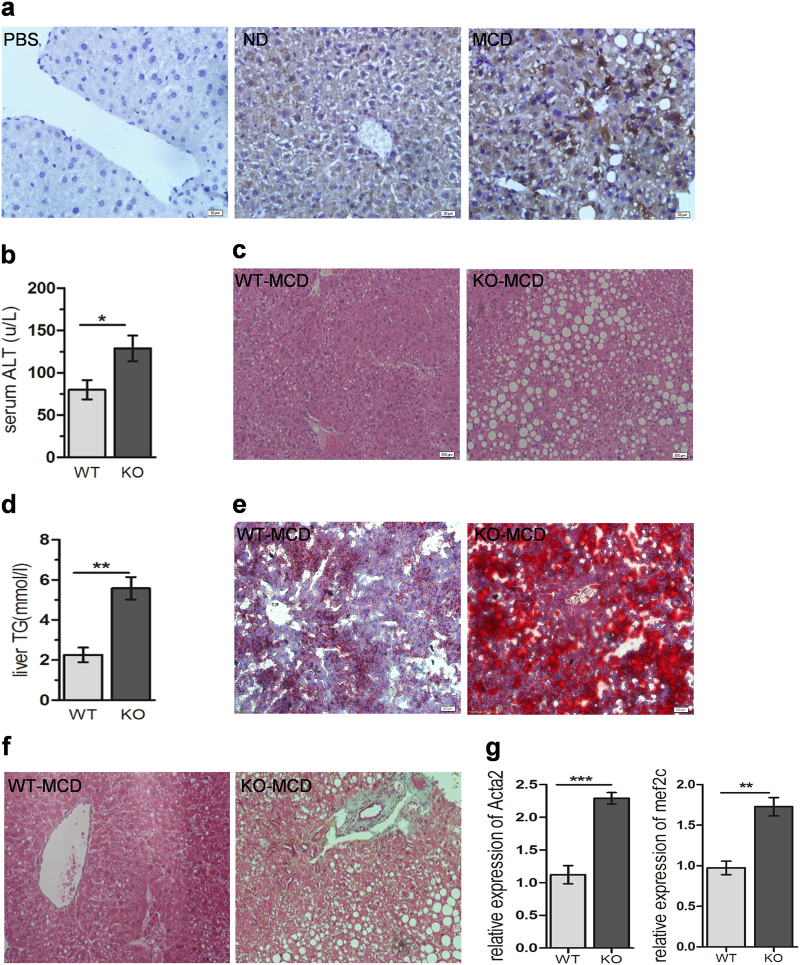
To evaluate the possible implication of Tim-3 in NASH, Tim-3 levels in liver tissues of MCD and HFD mice were assessed by IHC staining and western blot. Compared with mice with normal diet (ND), both MCD mice (Fig. 1a) and HFD mice (Supplementary Figure S1A) showed significantly enhanced Tim-3 expression in liver tissues. To determine whether Tim-3 plays a role in NASH, Tim-3 KO mice were fed with MCD to induce NASH. Fig. S6 demonstrated the significantly decreased Tim-3 expression in F4/80+ hepatic macrophages from Tim-3 KO mice, suggesting that the knockout (KO) was successful. Two weeks after MCD treatment, Tim-3 KO mice displayed more aggravated liver damage than control WT mice, as indicated by increased serum ALT (Fig. 1b), enlarged hepatic vacuolization (Fig. 1c), and more lipid accumulation in livers (Fig. 1d, e), suggesting that Tim-3 protects mice from MCD-induced liver steatohepatitis. In accordance, Masson staining of liver tissues from Tim-3 KO mice treated with 3 weeks of MCD showed more collagen fibers than MCD-treated WT mice (Fig. 1f). In addition, qPCR detected much higher expression of α-SMA (encoded by Acta2) and Mef2c, well-known markers of liver fibrosis, in Tim-3 KO mice treated with 3 weeks of MCD (Fig. 1g). This liver injury was further verified in the hepatic ultrastructure detected by TEM, which showed larger lipid droplets, greater swelling of mitochondria, and more lysosomes in hepatocytes from Tim-3 KO mice (Supplementary Figure S1B, C). More collagen bundles appeared in Tim-3 KO mice than in WT control mice (Supplementary Fig S1,D). Collectively, the data presented above suggest that Tim-3 alleviates liver steatohepatitis in MCD mice.
Fig. 1.
Augmented Tim-3 expression protected mice from MCD-induced liver injury. (a) Tim-3 expression in liver tissues of MCD mice was detected by IHC. b–e Compared with the WT group (n = 4), more severe liver damage was observed in Tim-3 KO (n = 4) mice after 2 weeks of MCD. b Colorimetric method analysis of ALT in serum from WT and Tim-3 KO mice. c HE-stained liver tissues from Tim-3 KO mice and WT mice. d Levels of TG in liver homogenate from WT and Tim-3 KO MCD mice were detected by enzymatic analysis. e ORO staining was applied to detect the lipid composition in liver tissues of WT and Tim-3 KO mice. f Masson staining and g qPCR results showed more collagen fibers in Tim-3 KO mice after 3 weeks of MCD treatment. The bars represent the mean values and the S.E.M.s. *p < 0.05, **p < 0.01. NASH nonalcoholic steatohepatitis, ND normal diet, MCD methionine-choline-deficient diet, WT wild type, Tim-3 KO Tim-3 TALEN, ORO oil red O, TG triglyceride
Tim-3 expression is significantly augmented in different subpopulations of hepatic macrophages in MCD mice, and OA serves as a potential inducer
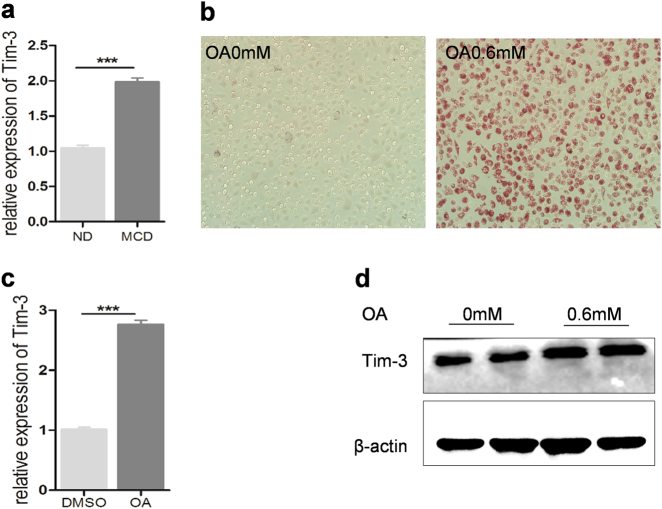
As a well-known immune checkpoint, Tim-3 is responsible for T-cell exhaustion and is also widely expressed on different innate immune cells, including macrophages, NK cells, and NKT cells,17, 18, 25 all of which are abundant in the liver. We then evaluated the existence of hepatic innate immune cells and their Tim-3 expression. Flow cytometry results showed that, compared with control mice, MCD mice displayed a significantly increased number of hepatic NK cells and macrophages (Supplementary Figure S2). However, Tim-3 expression was enhanced in hepatic adherent macrophages but not in NK cells in MCD mice (Supplementary Figure S2). Consistently, Tim-3 expression in peritoneal macrophages could be induced by liver homogenate from MCD mice (Fig. 2a), indicating that the microenvironment in NASH liver or the overload of lipids drives Tim-3 expression. This hypothesis was further verified with oleic acid-stimulated macrophages. As shown in Fig. 2, OA significantly enhanced lipid accumulation and increased Tim-3 expression in peritoneal macrophages (Fig. 2b, c) and BMDMs (Fig. 2d).
Fig. 2.
Oleic acid triggered Tim-3 upregulation in macrophages. a Peritoneal macrophages were stimulated with liver homogenate derived from ND or MCD mice; qPCR was used to evaluate Tim-3 expression. b–d BMDMs and peritoneal macrophages were treated with oleic acid at the indicated concentration. b Oil red O staining results showed increased lipid accumulation in peritoneal macrophages after oleic acid treatment. c qPCR was used to detect Tim-3 expression in peritoneal macrophages, and d western blot analysis was used to evaluate Tim-3 expression in BMDMs stimulated by oleic acid. BMDM bone marrow-derived macrophage
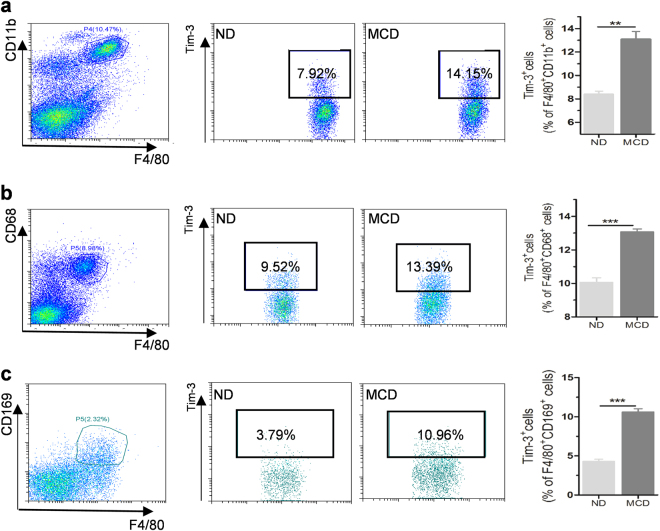
Since liver macrophages are heterogeneous, we next estimated Tim-3 expression on different subgroups of liver macrophages, including F4/80+CD68+KCs, F4/80+CD11b+motile liver macrophages derived from bone marrow, and F4/80+CD169+ residential liver macrophages.26 As displayed in Fig. 3, Tim-3 expression was significantly enhanced on all three of the detected subpopulations of hepatic macrophages after MCD treatment. Similarly, increased Tim-3 expression appeared on liver macrophages from HFD mice (Supplementary Figure S3A and B). Interestingly, compared with that of HCC paracancerous liver tissues without vacuolation, augmented expression of Tim-3 was also displayed on CD68+ hepatic macrophages from HCC tissue sections showing hepatic vacuolation (as a sign of potential lipid deposition; Supplementary Figure S3C). On the basis of these findings, although the specific roles of different subpopulations of liver macrophages may be slightly different, it seems that Tim-3 is expressed on different populations of liver macrophages and that it plays an important regulatory role in the pathogenesis of NASH.
Fig. 3.
Tim-3 was increased on different subpopulations of hepatic macrophages in MCD mice. FCM analysis of Tim-3+ cells gated in (a) F4/80+CD11b+, (b) F4/80+CD68+, and (c) F4/80+CD169+ liver macrophages isolated from ND and MCD mice (n ≥ 3). Representative data are shown in the left panels, and statistical data are displayed in the right panels. The results were analyzed by a two-tailed test. Significance is shown as **p < 0.01, ***p < 0.001
Tim-3 inhibits ROS generation in macrophages
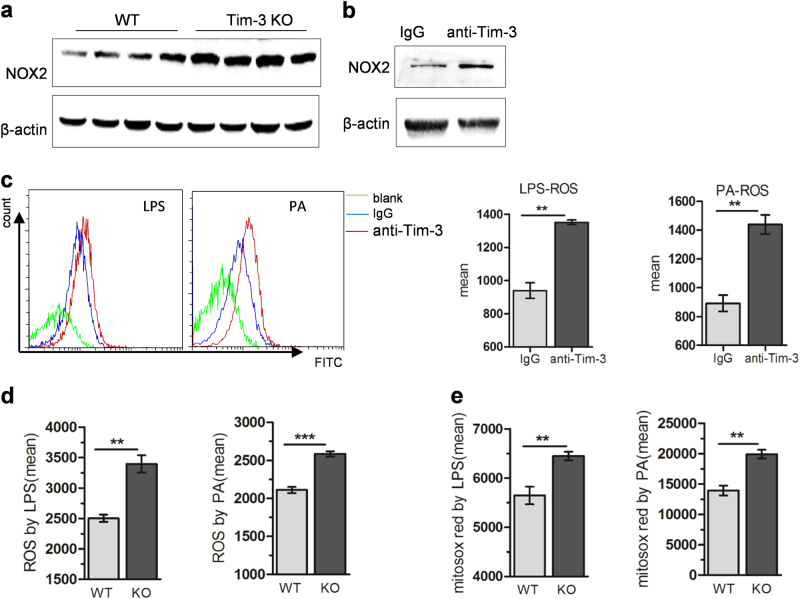
Oxidative stress is one of the key factors promoting the progression from initial steatosis to NASH. Targeting ROS is, therefore, suggested as an efficient treatment strategy in NASH patients.27 In accordance with a previous study that reported the crucial role of ROS generated from liver macrophages in NASH,28 we also detected significantly increased ROS production from liver macrophages in NASH mice (Supplementary Figure S5). To assay whether Tim-3 plays a role in ROS production from macrophages, both Tim-3-neutralizing antibody and Tim-3 KO mice were used. As shown in Fig. 4a, Tim-3 KO significantly enhanced NOX2 expression in livers of MCD mice. In addition, blocking Tim-3 with neutralizing antibody significantly increased NOX2 expression in BMDMs (Fig. 4b), suggesting that Tim-3 may inhibit ROS production in macrophages. This inhibition of ROS was further verified with macrophages in vitro. Compared with the control groups, BMDMs pretreated with neutralizing antibody and peritoneal macrophages derived from Tim-3 KO mice produced higher levels of ROS after LPS or PA treatment (Fig. 4c, d). Similar results were obtained when mitochondrial ROS was analyzed (Fig. 4e) in peritoneal macrophages derived from Tim-3 KO mice. Collectively, the above results supported the assumption that ROS were negatively controlled by Tim-3 in macrophages.
Fig. 4.
Tim-3 inhibited ROS generation in macrophages. a NOX2 expression was analyzed by western blot in liver tissues of WT and Tim-3 KO mice after MCD treatment. b Western blotting was performed to analyze NOX2 expression in BMDMs pretreated with anti-Tim-3-neutralizing antibody. BMDMs were pretreated with anti-Tim-3-neutralizing antibody following LPS or PA stimulation (c). Peritoneal macrophages prepared from Tim-3 KO or WT mice were treated with LPS or PA (d, e). ROS (c, d) and mitochondrial ROS (e) were assayed with DCFH-DA or mitosox red as described in the Materials and methods. **p < 0.01, ***p < 0.001
Tim-3 suppresses ROS-mediated liberation of pro-inflammatory cytokines in macrophages
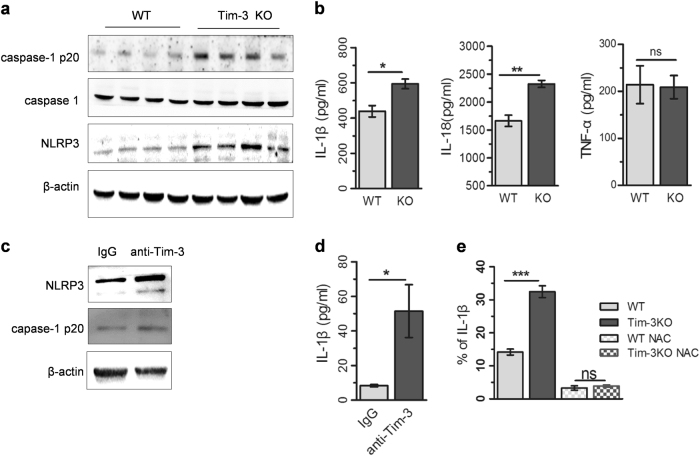
As the important mediators of liver inflammation, ROS have recently been identified as a “bonfire” or “trigger” for the activation of NLRP3 inflammasomes, which results in more production of IL-1β and IL-18.29, 30 To determine whether Tim-3 contributes to NLRP3 activation, we detected the expression of NLRP3 in livers of Tim-3 KO mice with MCD treatment. Western blot results demonstrated significant enhancement of NLRP3 and caspase-1 p20 in livers of Tim-3 KO mice, suggesting that Tim-3 repressed the expression of NLRP3, which in turn led to inactivation of the inflammasome (Fig. 5a). ELISA analysis confirmed that the concentrations of IL-1β and IL-18 were significantly enhanced in liver homogenate from Tim-3 KO mice, while the TNFα level remained unchanged (Fig. 5b). Similar results were obtained with Tim-3-neutralizing antibody in vitro. Blocking Tim-3 with neutralizing antibody significantly increased LPS-triggered expression of NLRP3, caspase-1 p20 (Fig. 5c), and IL-1 β generation (Fig. 5d) in BMDMs. Furthermore, the administration of NAC, a small molecule inhibitor of ROS, efficiently reversed the enhancement of IL-1β generation in peritoneal macrophages derived from Tim-3 KO mice compared to that of WT mice (Fig. 5e). All of the above data suggested that Tim-3 regulated IL-1β release in a ROS-dependent way.
Fig. 5.
Tim-3 regulated ROS-mediated pro-inflammatory cytokine liberation in macrophages. a, b Livers were isolated from MCD-treated Tim-3 KO and WT mice (n = 4). a Western blots were applied for the detection of NLRP3 and caspase-1 p20 in the liver tissues. b ELISA was used to detect the levels of IL-1β, IL-18, and TNFα in the liver homogenates. c, d BMDMs were pretreated with anti-Tim-3-neutralizing antibody (IgG as a control) and then stimulated by LPS. Western blot (c) and ELISA (d) were employed to detect the expression of the indicated proteins. e FCM analysis was used to analyze IL-1β generation in NAC-pretreated, HFD liver homogenate-stimulated peritoneal macrophages derived from WT or Tim-3 KO mice. The results were assessed by Student’s t-test. *p < 0.05, **p < 0.01, ***p < 0.001
Tim-3 alleviates liver injury in NASH mice via inhibiting ROS generation
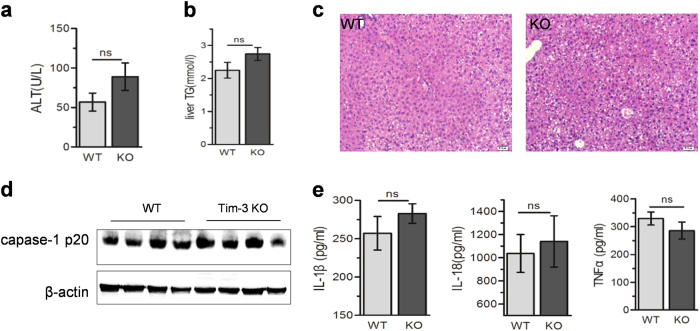
As displayed previously, Tim-3 protected MCD mice from liver injury in vivo and inhibited ROS production in cultured macrophages, leading to lower inflammasome activation and reduced IL-1β. To verify the critical role of ROS in Tim-3-initiated protection of liver injury, NAC was administered to MCD mice to inhibit ROS. As shown in Fig. 6, NAC distinctly reduced the difference in liver damage between WT and Tim-3 KO mice. In other words, with NAC treatment, MCD failed to induce severe liver injury in Tim-3 KO mice. The serum ALTs (Fig. 6a), liver lipid accumulation (Fig. 6b) and hepatic vacuolization (Fig. 6c) showed no statistical difference between WT and Tim-3 KO mice after MCD treatment. Consequently, Tim-3 KO mice displayed comparable levels of hepatic caspase-1 p20 (Fig. 6d), IL-1β and IL-18 in liver tissues (Fig. 6e) as those of WT mice with MCD treatment. Collectively, the data presented above confirm that Tim-3 can be highlighted as a protector against NASH by inhibiting oxidative stress and related inflammation in macrophages.
Fig. 6.
Tim-3 alleviated liver injury by inhibiting ROS generation in NASH mice. WT and Tim-3 KO mice fed with MCD were administered with NAC as described in the Materials and methods (n = 4). Serum ALT (a) and liver TG (b) were tested. c HE was applied to determine the hepatic vacuolation. d Caspase-1 p20 expression was analyzed by western blot. e ELISAs were applied to detect the levels of IL-1β, IL-18, and TNFα in liver homogenates
Discussion
NASH is a growing epidemic worldwide, worsening the quality of life in adults. Clinical and experimental findings indicate that ROS production and the related inflammatory response induced by innate immune cells, especially triggered by KCs, are critically involved in the pathogenesis of NASH.31 The identification of ROS regulators in macrophages seems to be a matter of great importance for understanding the pathogenesis of NASH, which is critical for developing new therapeutic strategies. Herein, for the first time, we supplied evidence suggesting that Tim-3 is a key negative regulator of ROS/inflammation in macrophages and therefore alleviates liver injury in NASH mice.
Increased evidence demonstrated the dynamic expression and diverse functions of Tim-3 in different disease models, especially in liver diseases including viral hepatitis, acute alcohol hepatitis, and HCC.17, 32, 33 Our present study demonstrated that Tim-3 expression in fatty livers of NASH mice was significantly increased and acted as a modulator in the process of NASH (Fig. 1). Further analysis detected augmented Tim-3 expression on liver macrophages. This increased expression might be due to the local microenvironment in fatty liver. As demonstrated in Fig. 2, not only the fatty liver homogenate but also OA triggered Tim-3 expression. More interestingly, increased Tim-3 expression was found in distinct subpopulations of hepatic macrophages, including F4/80+CD11b+, F4/80+CD68+, and F4/80+CD169+ macrophages, in both MCD and HFD mice (Fig. 3; Fig.S3), implying that Tim-3 on liver macrophages plays a role in NASH. However, whether the functions of Tim-3 are diverse in different subgroups of liver macrophages still needs further investigation.
Tim-3 not only works as a checkpoint of T-cell activation but also plays important roles in macrophage functions by regulating cytokine release, cell activation, and apoptotic body capture, contributing to the progression of various diseases.15, 34 Using Tim-3-neutralizing antibody and Tim-3 KO mice, we clearly showed that Tim-3 suppressed ROS production, especially the mitochondrial ROS in macrophages (Fig. 4). As far as we know, this is the first report demonstrating the involvement of Tim-3 in modulating ROS production in macrophages. In support of Tim-3 regulation of ROS production, western blot assays indicated that Tim-3 is a negative regulator of NOX2 expression (Fig. 4), which is the dominant superoxide-generating enzyme in macrophages.35 This finding explains the Tim-3-mediated inhibition of ROS; however, the detailed mechanisms need to be further investigated.
Clinical and animal studies demonstrated that ROS inhibitors or antioxidant reagents are effective treatment strategies for NASH,27, 36 strongly suggesting that ROS and the related inflammation are the major signal promoting the progression of fatty liver disease. Despite the direct cellular damage caused by oxygen-containing free radical molecules, excessive ROS accumulation instigates oxidant-sensitive transcription factor nuclear factor-κB, upregulating the generation of pro-inflammatory cytokines including IL-1β and TNFα.37, 38 A recent study reported that ROS contribute to NLRP3 activation, resulting in more IL-1β and IL-18 liberation.39 Herein, we detected significantly increased NLRP3, caspase-1 p20 expression, and IL-1β and IL-18 generation in livers of Tim-3 KO mice. Consistent with these findings, the blocking assay showed that Tim-3 inhibited ROS-mediated NLRP3 activation and the release of the pro-inflammatory cytokines IL-1β and IL-18 in macrophages (Fig. 5). Although a crosstalk exists between TNFα and ROS in inflammation,40 TNFα expression showed no significant difference in our experiments (Fig. 5b), indicating to us that Tim-3 suppressed inflammation via downregulating ROS and NLRP3-primed inflammasome activation. Injection of NAC efficiently alleviated NASH, downregulated caspase-1 p20 overexpression, and decreased IL-1β and IL-18 generation in livers of Tim-3 KO mice (Fig. 6), further providing evidence suggesting that Tim-3 alleviates liver injury by inhibiting ROS and the related cytokine release. Our findings somehow are consistent with the previous work in a peritonitis model,41 which targeted the function of Tim-3 in NLRP3 activation (Fig. 7).
Fig. 7.
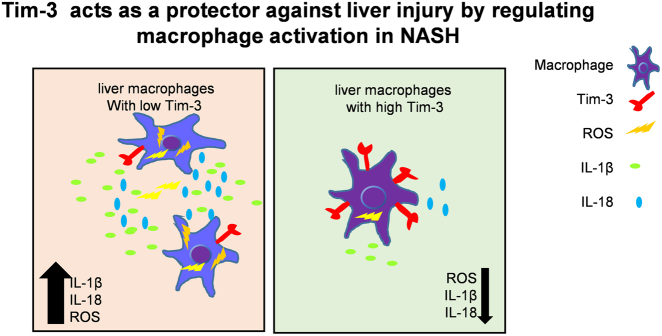
Tim-3 protects against liver injury by regulating macrophage activation in NASH
It is well known that innate immune cells, including NK, NKT, and macrophages, are key factors in liver diseases, and all of them abundantly express Tim-36. Although we focused our work on Tim-3 expression on macrophages, we are currently unable to rule out the functional possibilities of Tim-3 in other immune cells in NASH. Previous reports demonstrated the increased hepatic NK cells and KCs in NASH mice,42, 43 while NKT cells were selectively decreased in number in fatty livers.44 Similarly, our data showed that NK and macrophages were significantly increased, while the proportion of NKT cells was reduced in livers of MCD mice. Tim-3 expression on liver NK cells showed no significant difference between ND and MCD mice in our experiment. We also detected a higher amount of Tim-3 on hepatic NKT cells in NASH mice (data not shown), which was consistent with Tang’s study.45 Using Tim-3 ligand Galectin 9 (Gal-9), Tang ascribed the NKT cell depletion in NASH mice to increased Tim-3 by inducing cell apoptosis. However, as they reported, gal-9 might promote apoptosis by other pathways than Tim-3. In fact, previous reports demonstrated the Tim-3-independant functions of Gal-9, including the differentiation of pDC-like macrophages and Th17 development46, 47. Therefore, the exact role of NK and NKT cells expressing Tim-3 in NASH needs further studies.
Collectively, our data describe the potential roles of Tim-3 on macrophages as a protector against liver injury in NASH. Tim-3 can inhibit macrophage activation through regulating ROS generation and downstream cytokine release, which highlights Tim-3 on macrophages as a negative regulator in maintaining immune homeostasis in NASH mice.
Electronic supplementary material
Acknowledgements
This work was supported by the National Key Research and Development Program of China (2016YFE0127000), the National Natural Science Fund for Outstanding Youth Fund (81425012), the National Nature Science Foundation of China (91529305 and 81371831), and the Program for 2016ZDJS07A17.
Competing interests
The authors declare no competing interests.
Electronic supplementary material
Supplementary information accompanies this paper at (10.1038/s41423-018-0032-0).
References
- 1.Loomba R, Sanyal AJ. The global NAFLD epidemic. Nat. Rev. Gastroenterol. Hepatol. 2013;10:686–690. doi: 10.1038/nrgastro.2013.171. [DOI] [PubMed] [Google Scholar]
- 2.Tacke F, Yoneyama H. From NAFLD to NASH to fibrosis to HCC: role of dendritic cell populations in the liver. Hepatology. 2013;58:494–496. doi: 10.1002/hep.26405. [DOI] [PubMed] [Google Scholar]
- 3.Tilg H, Moschen AR. Evolution of inflammation in nonalcoholic fatty liver disease: the multiple parallel hits hypothesis. Hepatology. 2010;52:1836–1846. doi: 10.1002/hep.24001. [DOI] [PubMed] [Google Scholar]
- 4.Paradies G, Paradies V, Ruggiero FM, Petrosillo G. Oxidative stress, cardiolipin and mitochondrial dysfunction in nonalcoholic fatty liver disease. World J. Gastroenterol. 2014;20:14205–14218. doi: 10.3748/wjg.v20.i39.14205. [DOI] [PMC free article] [PubMed] [Google Scholar]
- 5.Spahis S, Delvin E, Borys JM, Levy E. Oxidative stress as a critical factor in nonalcoholic fatty liver disease pathogenesis. Antioxid. Redox Signal. 2017;26:519–541. doi: 10.1089/ars.2016.6776. [DOI] [PubMed] [Google Scholar]
- 6.Arrese M, Cabrera D, Kalergis AM, Feldstein AE. Innate Immunity and Inflammation in NAFLD/NASH. Dig. Dis. Sci. 2016;61:1294–1303. doi: 10.1007/s10620-016-4049-x. [DOI] [PMC free article] [PubMed] [Google Scholar]
- 7.Duarte N, et al. How Inflammation Impinges on NAFLD: A Role for Kupffer Cells. BioMed. Res. Int. 2015;2015:984578. doi: 10.1155/2015/984578. [DOI] [PMC free article] [PubMed] [Google Scholar]
- 8.Baffy G. Kupffer cells in non-alcoholic fatty liver disease: the emerging view. J. Hepatol. 2009;51:212–223. doi: 10.1016/j.jhep.2009.03.008. [DOI] [PMC free article] [PubMed] [Google Scholar]
- 9.Miura K, et al. Toll-like receptor 2 and palmitic acid cooperatively contribute to the development of nonalcoholic steatohepatitis through inflammasome activation in mice. Hepatology. 2013;57:577–589. doi: 10.1002/hep.26081. [DOI] [PMC free article] [PubMed] [Google Scholar]
- 10.Baeck C, et al. Pharmacological inhibition of the chemokine CCL2 (MCP-1) diminishes liver macrophage infiltration and steatohepatitis in chronic hepatic injury. Gut. 2012;61:416–426. doi: 10.1136/gutjnl-2011-300304. [DOI] [PubMed] [Google Scholar]
- 11.Monney L, et al. Th1-specific cell surface protein Tim-3 regulates macrophage activation and severity of an autoimmune disease. Nature. 2002;415:536–541. doi: 10.1038/415536a. [DOI] [PubMed] [Google Scholar]
- 12.Jin HT, et al. Cooperation of Tim-3 and PD-1 in CD8 T-cell exhaustion during chronic viral infection. Proc. Natl Acad. Sci. Usa. 2010;107:14733–14738. doi: 10.1073/pnas.1009731107. [DOI] [PMC free article] [PubMed] [Google Scholar]
- 13.Huang YH, et al. CEACAM1 regulates TIM-3-mediated tolerance and exhaustion. Nature. 2015;517:386–390. doi: 10.1038/nature13848. [DOI] [PMC free article] [PubMed] [Google Scholar]
- 14.Han G, Chen G, Shen B, Li Y. Tim-3: an activation marker and activation limiter of innate immune cells. Front Immunol. 2013;4:449. doi: 10.3389/fimmu.2013.00449. [DOI] [PMC free article] [PubMed] [Google Scholar]
- 15.Ocana-Guzman R, Torre-Bouscoulet L, Sada-Ovalle I. TIM-3 regulates distinct functions in macrophages. Front Immunol. 2016;7:229. doi: 10.3389/fimmu.2016.00229. [DOI] [PMC free article] [PubMed] [Google Scholar]
- 16.Zhang Y, et al. Tim-3 negatively regulates IL-12 expression by monocytes in HCV infection. PLoS ONE. 2011;6:e19664. doi: 10.1371/journal.pone.0019664. [DOI] [PMC free article] [PubMed] [Google Scholar]
- 17.Yan W, et al. Tim-3 fosters HCC development by enhancing TGF-beta-mediated alternative activation of macrophages. Gut. 2015;64:1593–1604. doi: 10.1136/gutjnl-2014-307671. [DOI] [PubMed] [Google Scholar]
- 18.Rong YH, et al. Tim-3 expression on peripheral monocytes and CD3+ CD16/CD56+ natural killer-like T cells in patients with chronic hepatitis B. Tissue Antigens. 2014;83:76–81. doi: 10.1111/tan.12278. [DOI] [PubMed] [Google Scholar]
- 19.Koh HS, et al. The HIF-1/glial TIM-3 axis controls inflammation-associated brain damage under hypoxia. Nat. Commun. 2015;6:6340. doi: 10.1038/ncomms7340. [DOI] [PMC free article] [PubMed] [Google Scholar]
- 20.Feng Z, et al. Multispectral imaging of T and B cells in murine spleen and tumor. J. Immunol. 2016;196:3943–3950. doi: 10.4049/jimmunol.1502635. [DOI] [PMC free article] [PubMed] [Google Scholar]
- 21.Alabraba EB, et al. A new approach to isolation and culture of human Kupffer cells. J. Immunol. Methods. 2007;326:139–144. doi: 10.1016/j.jim.2007.06.014. [DOI] [PubMed] [Google Scholar]
- 22.Zhang T, et al. Anti-oxidant and anti-apoptotic effects of luteolin on mice peritoneal macrophages stimulated by angiotensin II. Int. Immunopharmacol. 2014;20:346–351. doi: 10.1016/j.intimp.2014.03.018. [DOI] [PubMed] [Google Scholar]
- 23.Young YK, Bolt AM, Ahn R, Mann KK. Analyzing the tumor microenvironment by flow cytometry. Methods Mol. Biol. 2016;1458:95–110. doi: 10.1007/978-1-4939-3801-8_8. [DOI] [PubMed] [Google Scholar]
- 24.Maecker HT, Trotter J. Flow cytometry controls, instrument setup, and the determination of positivity. Cytometry A. 2006;69:1037–1042. doi: 10.1002/cyto.a.20333. [DOI] [PubMed] [Google Scholar]
- 25.Ju Y, et al. T cell immunoglobulin- and mucin-domain-containing molecule-3 (Tim-3) mediates natural killer cell suppression in chronic hepatitis B. J. Hepatol. 2010;52:322–329. doi: 10.1016/j.jhep.2009.12.005. [DOI] [PubMed] [Google Scholar]
- 26.Davies LC, Jenkins SJ, Allen JE, Taylor PR. Tissue-resident macrophages. Nat. Immunol. 2013;14:986–995. doi: 10.1038/ni.2705. [DOI] [PMC free article] [PubMed] [Google Scholar]
- 27.Khoshbaten M, et al. N-acetylcysteine improves liver function in patients with non-alcoholic fatty liver disease. Hepat. Mon. 2010;10:12–16. [PMC free article] [PubMed] [Google Scholar]
- 28.Del Ben M, et al. NOX2-generated oxidative stress is associated with severity of ultrasound liver steatosis in patients with non-alcoholic fatty liver disease. BMC Gastroenterol. 2014;14:81. doi: 10.1186/1471-230X-14-81. [DOI] [PMC free article] [PubMed] [Google Scholar]
- 29.Arifa RD, et al. Inflammasome activation is reactive oxygen species dependent and mediates irinotecan-induced mucositis through IL-1beta and IL-18 in mice. Am. J. Pathol. 2014;184:2023–2034. doi: 10.1016/j.ajpath.2014.03.012. [DOI] [PubMed] [Google Scholar]
- 30.Zhang X, et al. Reactive oxygen species-induced TXNIP drives fructose-mediated hepatic inflammation and lipid accumulation through NLRP3 inflammasome activation. Antioxid. Redox Signal. 2015;22:848–870. doi: 10.1089/ars.2014.5868. [DOI] [PMC free article] [PubMed] [Google Scholar]
- 31.Ye D, et al. Toll-like receptor-4 mediates obesity-induced non-alcoholic steatohepatitis through activation of X-box binding protein-1 in mice. Gut. 2012;61:1058–1067. doi: 10.1136/gutjnl-2011-300269. [DOI] [PubMed] [Google Scholar]
- 32.Liu Y, Gao LF, Liang XH, Ma CH. Role of Tim-3 in hepatitis B virus infection: an overview. World J. Gastroenterol. 2016;22:2294–2303. doi: 10.3748/wjg.v22.i7.2294. [DOI] [PMC free article] [PubMed] [Google Scholar]
- 33.Markwick LJ, et al. Blockade of PD1 and TIM3 restores innate and adaptive immunity in patients with acute alcoholic hepatitis. Gastroenterology. 2015;148:590–602.e10. doi: 10.1053/j.gastro.2014.11.041. [DOI] [PubMed] [Google Scholar]
- 34.Zhao D, et al. Frontline science: Tim-3-mediated dysfunctional engulfment of apoptotic cells in SLE. J. Leukoc. Biol. 2017;102:1313–1322. doi: 10.1189/jlb.3HI0117-005RR. [DOI] [PubMed] [Google Scholar]
- 35.Trocme C, et al. Macrophage-specific NOX2 contributes to the development of lung emphysema through modulation of SIRT1/MMP-9 pathways. J. Pathol. 2015;235:65–78. doi: 10.1002/path.4423. [DOI] [PMC free article] [PubMed] [Google Scholar]
- 36.Ali MH, Messiha BA, Abdel-Latif HA. Protective effect of ursodeoxycholic acid, resveratrol, and N-acetylcysteine on nonalcoholic fatty liver disease in rats. Pharm. Biol. 2016;54:1198–1208. doi: 10.3109/13880209.2015.1060247. [DOI] [PubMed] [Google Scholar]
- 37.Tilg H, Diehl AM. Cytokines in alcoholic and nonalcoholic steatohepatitis. N. Engl. J. Med. 2000;343:1467–1476. doi: 10.1056/NEJM200011163432007. [DOI] [PubMed] [Google Scholar]
- 38.Feldstein AE, et al. Free fatty acids promote hepatic lipotoxicity by stimulating TNF-alpha expression via a lysosomal pathway. Hepatology. 2004;40:185–194. doi: 10.1002/hep.20283. [DOI] [PubMed] [Google Scholar]
- 39.Li X., et al. Helicobacter pylori induces IL-1beta and IL-18 production in human monocytic cell line through activation of NLRP3 inflammasome via ROS signaling pathway. Pathog. Dis.73, ftu024 (2015). [DOI] [PubMed]
- 40.Blaser H, Dostert C, Mak TW, Brenner D. TNF and ROS crosstalk in inflammation. Trends Cell Biol. 2016;26:249–261. doi: 10.1016/j.tcb.2015.12.002. [DOI] [PubMed] [Google Scholar]
- 41.Wang W, et al. Negative regulation of Nod-like receptor protein 3 inflammasome activation by T cell Ig mucin-3 protects against peritonitis. Immunology. 2017;153:71–83. doi: 10.1111/imm.12812. [DOI] [PMC free article] [PubMed] [Google Scholar]
- 42.Tosello-Trampont AC, et al. NKp46(+) natural killer cells attenuate metabolism-induced hepatic fibrosis by regulating macrophage activation in mice. Hepatology. 2016;63:799–812. doi: 10.1002/hep.28389. [DOI] [PMC free article] [PubMed] [Google Scholar]
- 43.Gadd VL, et al. The portal inflammatory infiltrate and ductular reaction in human nonalcoholic fatty liver disease. Hepatology. 2014;59:1393–1405. doi: 10.1002/hep.26937. [DOI] [PubMed] [Google Scholar]
- 44.Li Z, Soloski MJ, Diehl AM. Dietary factors alter hepatic innate immune system in mice with nonalcoholic fatty liver disease. Hepatology. 2005;42:880–885. doi: 10.1002/hep.20826. [DOI] [PubMed] [Google Scholar]
- 45.Tang ZH, et al. Tim-3/galectin-9 regulate the homeostasis of hepatic NKT cells in a murine model of nonalcoholic fatty liver disease. J. Immunol. 2013;190:1788–1796. doi: 10.4049/jimmunol.1202814. [DOI] [PMC free article] [PubMed] [Google Scholar]
- 46.Kadowaki T, et al. Galectin-9 signaling prolongs survival in murine lung-cancer by inducing macrophages to differentiate into plasmacytoid dendritic cell-like macrophages. Clin. Immunol. 2012;142:296–307. doi: 10.1016/j.clim.2011.11.006. [DOI] [PubMed] [Google Scholar]
- 47.Oomizu S, et al. Galectin-9 suppresses Th17 cell development in an IL-2-dependent but Tim-3-independent manner. Clin. Immunol. 2012;143:51–58. doi: 10.1016/j.clim.2012.01.004. [DOI] [PubMed] [Google Scholar]
Associated Data
This section collects any data citations, data availability statements, or supplementary materials included in this article.


