Abstract
Purpose
Most studies on intraocular pressure (IOP) to monitor IOP “fluctuations” in glaucoma patients have been performed with snapshot tonometry techniques that obtain IOP measurements at single time points weeks to months apart. However, IOP telemetry has shown that IOP varies from second-to-second due to blinks, saccades, and systolic vascular filling. The purpose of this study was to characterize the cyclic pattern of baseline IOP and transient IOP fluctuations in 3 nonhuman primates (NHPs).
Methods
Bilateral IOP was measured using a proven implantable telemetry system and recorded 500 times per second, 24 hours a day, up to 451 continuous days in 3 male rhesus macaques aged 4 to 5 years old. The IOP transducers were calibrated every two weeks via anterior chamber cannulation manometry and all data were continuously corrected for signal drift via software, filtered for signal noise and dropout, and peaks and troughs were quantified and counted using a finite impulse response filter; waking hours were defined as 6:00–18:00 hours based on room light cycle.
Results
Fourier transform analyses of baseline IOP and the hourly mean frequency of transient IOP fluctuations > 0.6 mmHg, 0.6–5 mmHg and > 5 mmHg above baseline during waking hours exhibited an approximate 16- to 91-day cyclic pattern in all NHPs. There were no measured environmental or experimental factors associated with this cyclical pattern.
Conclusions
While the importance of the cyclic pattern identified in IOP and its fluctuations is unknown at this time, it is plausible that this pattern is relevant to both homeostasis and pathophysiology of the ONH, corneoscleral shell, and aqueous outflow pathways.
1. Introduction
Glaucoma is one of the leading causes of irreversible blindness worldwide, and intraocular pressure (IOP) is a major risk factor for disease onset and progression.1–4 IOP has been studied extensively in healthy, ocular hypertensive and glaucomatous subjects, although most previous studies have assessed IOP in patients with snapshot tonometry techniques that obtain IOP measurements at single time points hours, days, weeks or months apart to monitor IOP “fluctuations”. Thus, while IOP is the only clinically modifiable risk factor for glaucoma 1–4, the true dynamic nature of IOP in patients is largely unknown. IOP telemetry has shown that IOP varies from second-to-second due to blinks, saccades, and systolic vascular filling5–9, and the common snapshot IOP tonometry techniques largely ignore these dynamic aspects of IOP. It has been hypothesized that these transient IOP fluctuations may increase with stiffening of the corneoscleral shell.10 Stiffening of the ocular coat has been demonstrated with age and glaucoma, presumably due to corneoscleral shell remodeling.11–17 Moreover, age-related stiffening of the sclera is more pronounced in persons of African descent compared to donors of European descent.13,14,18 As a result, the elderly and persons of African heritage should have larger transient IOP fluctuations, which may be related to the greater susceptibility to glaucomatous injury seen in these at-risk populations. To date however, it remains unknown if transient IOP fluctuations play an important role in glaucoma pathogenesis and/or progression.
The factors that influence IOP change and interoffice-visit IOP “fluctuation” have been extensively studied to determine differences by geographic region and race.19–25 These studies identified a seasonal cyclic pattern in snapshot IOP, where IOP was significantly higher during winter months in humans,19–21,23–26 as well as rabbits27–30. However, these studies did not obtain IOP measurements at the same time of day across days, the number of repeated IOP measurements vary, and the seasonal IOP measurements were not consistently performed across studies.1–12 The seasonal photoperiod effects of temperature and light have also been assessed in humans and rabbits; IOP was higher when temperatures were colder and during seasonal periods of less light.22,26,27,31
The purpose of this study was to characterize the cyclic pattern of both baseline IOP and transient IOP fluctuations > 0.6 mmHg, 0.6–5 mmHg and > 5 mmHg above baseline observed using continuous IOP telemetry in 3 nonhuman primates (NHPs) exposed to uniform temperatures and consistent 12-hour light/dark cycles. It is important to note that this study assessed both mean baseline IOP, as well as the transient IOP fluctuations > 0.6 mmHg, 0.6–5 mmHg and > 5 mmHg above baseline.
1. Methods
2.1. Animals
All animals were treated in accordance with the National Institutes of Health guide for the care and use of Laboratory animals (NIH Publications No. 8023, revised 1978), under a protocol approved and monitored by the Institutional Animal Care and Use Committee of the University of Alabama at Birmingham. This ancillary study uses data collected for a larger NIH-funded study aimed at determining the independent contribution of transient IOP fluctuations to glaucoma onset and progression. Three male rhesus macaques with no ocular abnormalities, aged four to five years old, were used for data collection for this study. Animal 0804025 was monitored for 451 consecutive days OU, 9160 was monitored for 412 consecutive days OU, and 9028 was monitored for 125 consecutive days OU. All animals were kept on a 6AM-6PM light-dark cycle, fed at approximately 6AM and 2PM daily, and received ad libitum water through a continuous feed. Food and water intake were not measured for this study. Daily temperature was collected and logged using the FisherBrand Traceable Digital Thermometer (Fisher Scientific, Pittsburgh, PA) in the NHP holding room, which showed that mean temperatures were 73.1 ± 1.1°F throughout the entire data collection period (451 consecutive days).
2.2. Bilateral IOP Telemetry System
We have developed and validated an implantable telemetry system that wirelessly records 500 measurements of IOP per second for up to 2–1/2 years.5 The study protocol mandates a minimum 4-week recovery time following telemetry system implantation surgery. Using an enhanced version of this system, continuous bilateral IOP, bilateral electro-oculogram (EOG), aortic blood pressure and body temperature were recorded continuously at 500Hz for 125 – 451 days in four NHPs. The IOP transducers were calibrated approximately every two weeks via anterior chamber manometry as described below 5, and all data were continuously corrected for signal drift via software, filtered for signal noise and dropout, and peaks and troughs were quantified and counted based on a 2-stage finite impulse response filter.32 Bilateral IOP was recorded continuously while the NHPs were awake and behaving.
2.3. IOP Sensor Calibration
Bilateral IOP sensor calibration was performed every two weeks. Intramuscular injections of Ketamine (3 mg/kg) with dexmedetomidine (50 mcg/kg) were used as the induction anesthetic for all calibration procedures, followed by Isoflurane inhalant anesthesia (1–3%) for maintenance. All NHPs were kept warm with a warming blanket and systemically monitored for heart rate, SpO2, end tidal CO2 volume, EKG, and temperature with documentation every 15 minutes during all procedures. A topical analgesic (Proparacaine HCl, 0.5% ophthalmic solution) was applied to each eye, and the anterior chamber of both eyes was cannulated at the limbus with a sterile 27-gauge needle connected to a sterile isotonic saline solution via a sterile infusion set fitted with an in-line digital pressure gauge (model XP2i; Crystal Engineering, San Luis Obispo, CA). The saline manometer bottle height was set such that IOP was 5 mmHg and increased to 40 mmHg in increments of 5 mmHg; IOP was given time to stabilize and the sensor measurement at each true IOP increment was recorded. The telemetry sensor and pressure gauge IOP values were used to quantify the IOP transducer sensor signal drift and linearity, and the IOP telemetry data were corrected continuously in time via software between calibration sessions. It was assumed the IOP signal drifted linearly during the two weeks between transducer calibration tests, and the data were continuously offset by the drift calculated during the calibration test for that two-week period. Typically, IOP transducer drift was less than 2 mmHg every two weeks.5
2.4. Finite Impulse Response Filtering to Identify Transient IOP Fluctuations
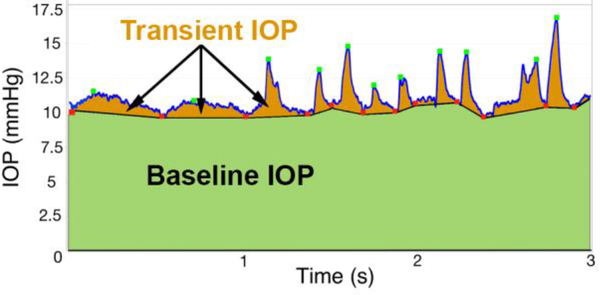
As shown in Figure 1, we quantified transient IOP by smoothing the raw IOP data with a 7-sample, 14 ms running average to remove noise. A dual-band finite impulse response (FIR) filter in a low- and high-frequency range was used to identify transient IOP fluctuation peaks and troughs, as previously described by Markert, et al.32 The low-band FIR filter (0.5–3 Hz) identifies the peaks and troughs of transient IOP fluctuations of 0.3–2 seconds duration, while the high-band FIR filter (5–10 Hz) identifies high frequency transient IOP fluctuations of 0.1–0.3 second duration. The FIR filter identified the troughs in IOP, and the peaks were identified as the largest IOP value between adjacent troughs. Transient IOP fluctuation magnitude was quantified as the difference between the largest IOP value (peak) between two troughs and the average of the two IOP troughs.32 The FIR filter was tuned such that the troughs and peaks were accurately identified for transient IOP fluctuations of varying magnitude and duration; the low-band FIR filter identifies ocular pulse amplitude (OPA) and the high-band FIR filter identifies IOP fluctuations associated with blinks and saccades.32 Filter performance was verified in all NHPs across multiple random samples for each animal, as assessed by at least two observers (JCD and DCT). Once counted and sorted by magnitude, the numbers of transient IOP fluctuations >0.6 mmHg, from 0.6–5 mmHg, and >5 mmHg were averaged for each day in each eye of each NHP, then plotted and analyzed for all days. The IOP sensor has a measurement noise of ±0.2 mmHg, so we set the lower limit of transient IOP fluctuation magnitudes we report at 0.6 mmHg. Prior observation has indicated that OPA ranges from ~1–3.5 mmHg, so the middle bin cutoff was set to 5 mmHg. Baseline IOP, or the portion of IOP excluding the transient IOP fluctuations (Figure 1), was also averaged for each day during waking hours.
Figure 1.
Screenshot of 3 seconds of raw IOP telemetry data showing the identification of troughs (red dots) and peaks (green dots) of the transient IOP fluctuations detected by the FIR filter. Baseline IOP, defined as the portion of the total IOP excluding transient IOP fluctuations, was calculated as the area under the IOP versus time curve bounded by the transient IOP fluctuation troughs (green area), and then averaged during waking hours. Adapted from Markert, et. al.32 with permission.
2.5. Temporal Data Analysis
After the transient IOP fluctuation amplitudes for each eye were identified by dual-band FIR filtering over 125 – 451 days, the mean hourly frequency of transient IOP fluctuations >0.6, 0.6–5, and >5 mmHg above baseline during waking hours were analyzed by temporal autocorrelation to identify any cyclic pattern. Mean body temperature (telemetry), mean room temperature, and mean baseline IOP during waking hours (defined as the portion of IOP excluding the transient IOP fluctuations; Figure 1) were also analyzed similarly as follows. First, any linear trend in the data was removed, then an autocorrelation was performed by shifting the data temporally, one day at a time, and performing a correlation between the original data and the temporally-shifted data. The temporal autocorrelation coefficients are then plotted against temporal shifts of X number of days in an autocorrelogram, and when the shift generates a strong correlation, it indicates that there is a repeating pattern in the data that occurs with a period of X days.33 The resulting autocorrelation coefficient curve identifies any autocorrelation pattern that is repeatable.33 On day zero, the autocorrelation coefficient is one because the data are the same and are therefore perfectly autocorrelated.
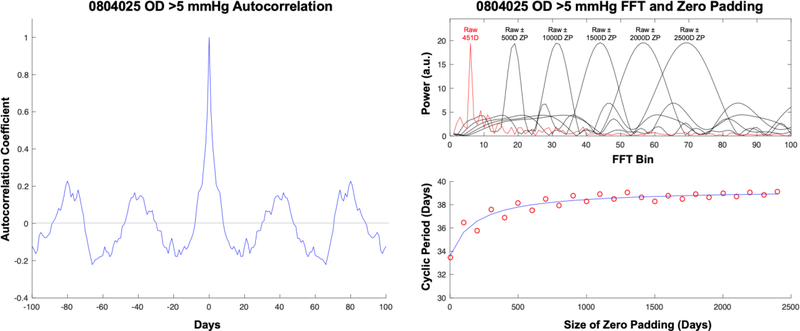
To quantify the magnitude of the cyclic pattern in the autocorrelation results, a fast Fourier transform (FFT) was performed on the autocorrelation coefficients.34 The autocorrelation and FFT analyses, as well as the raw data randomization described below in the Statistical Analysis section, were performed using standard MATLAB functions (Ver. R2016A, The MathWorks, Inc, Natick, MA). As shown in Figure 2, all data were analyzed in both raw form (just the collected data itself) and with zero padding, wherein additional days of zero amplitude data are added both before and after the raw data to improve the temporal resolution of the FFT period estimate. Using this approach, the period associated with the power peaks in the FFTs will converge to a steady value as additional days of zero data are added to the raw data, after which zero padding with additional days doesn’t improve the period estimate (Figure 2). Zero padding with 2500 days was used for all reported values to ensure period estimate convergence.
Figure 2.
(Left) Example of an autocorrelogram (autocorrelation coefficient curve) for the number of transient IOP fluctuations >5 mmHg in magnitude for one eye, and the corresponding FFT analysis (right). The upper right panel shows the FFT power peaks associated with the raw data alone (red line) and those associated with 500–2500 days (D) of zero padding (ZP). The bottom right panel shows the cyclic period of the dominant peak associated with increasing days of zero padding of the raw data, and the convergence to the cyclic period at 2500 days of zero padding (blue line).
The pattern of experimental procedures and solar and lunar cycles were compared with the cyclic patterns of the IOP-related parameters. Experimental procedures occur every 14±1 days in each NHP, lunar and solar events occur on ~28-day cycles, cage cleaning and feeding occurs at the same times every day, 7-days-a-week. All NHPs in this study were housed in the same room during data collection, and so were subjected to identical environmental stimuli.
2.6. Statistical Analysis
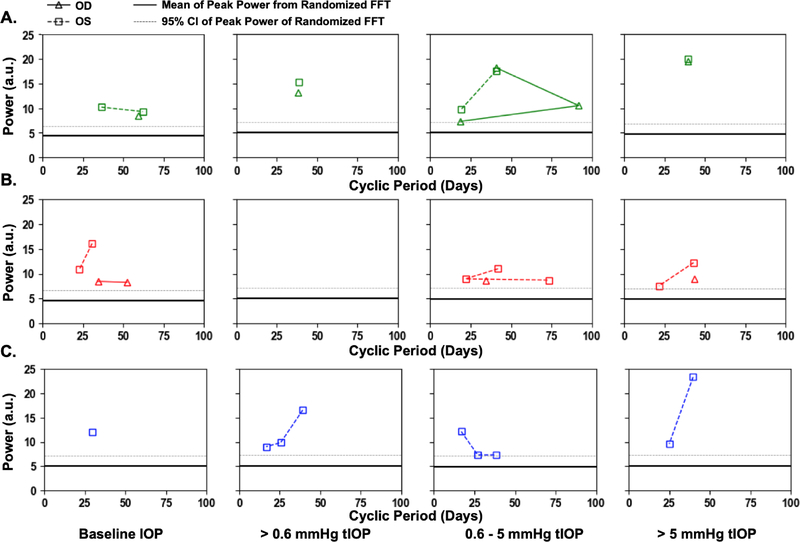
To assess the likelihood that the power peaks generated by the FFTs of the autocorrelation coefficients are significant, a series of secondary analyses were conducted on randomized raw data for each variable in each eye, in which the raw data were randomized, any linear trend was removed, the autocorrelation was performed, and the FFT was performed on the autocorrelation coefficients as described above. This process was repeated 1000 times for each variable in each eye and the maximum power peak was quantified in each run. This produces a distribution of 1000 maximum power peaks for the randomized data, from which the mean and standard deviation were calculated. We set the cutoff for significance of the FFT power peaks as the mean of the 1000 maximum power peaks for the randomized data plus 1.96 standard deviations, which estimates the 95% confidence interval for power peaks in random data, above which any FFT power peak detected in the raw data are 95% likely to represent a significant cyclic pattern.
3. Results
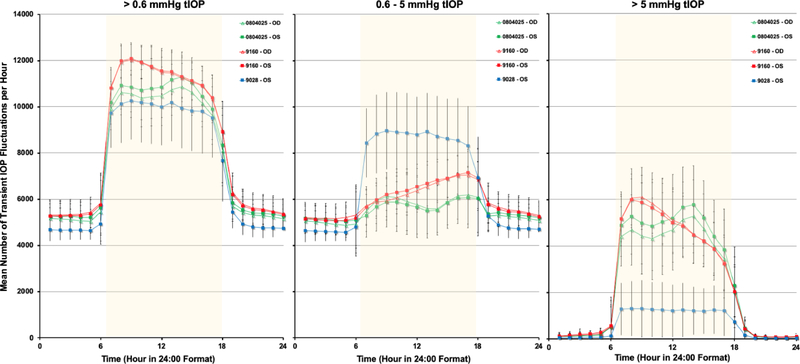
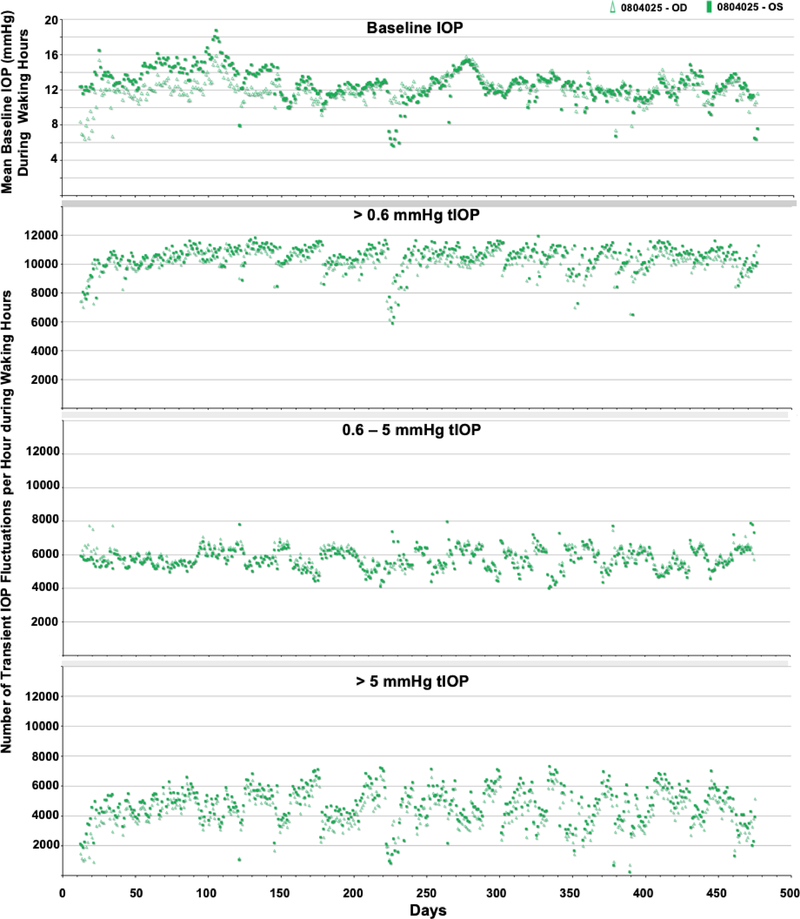
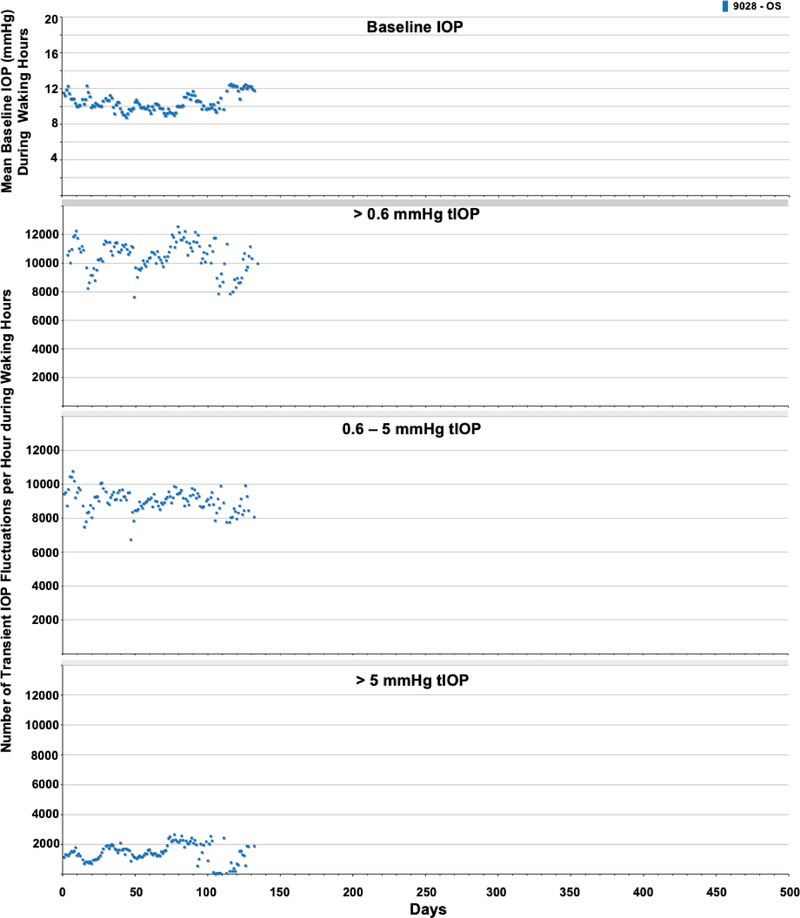
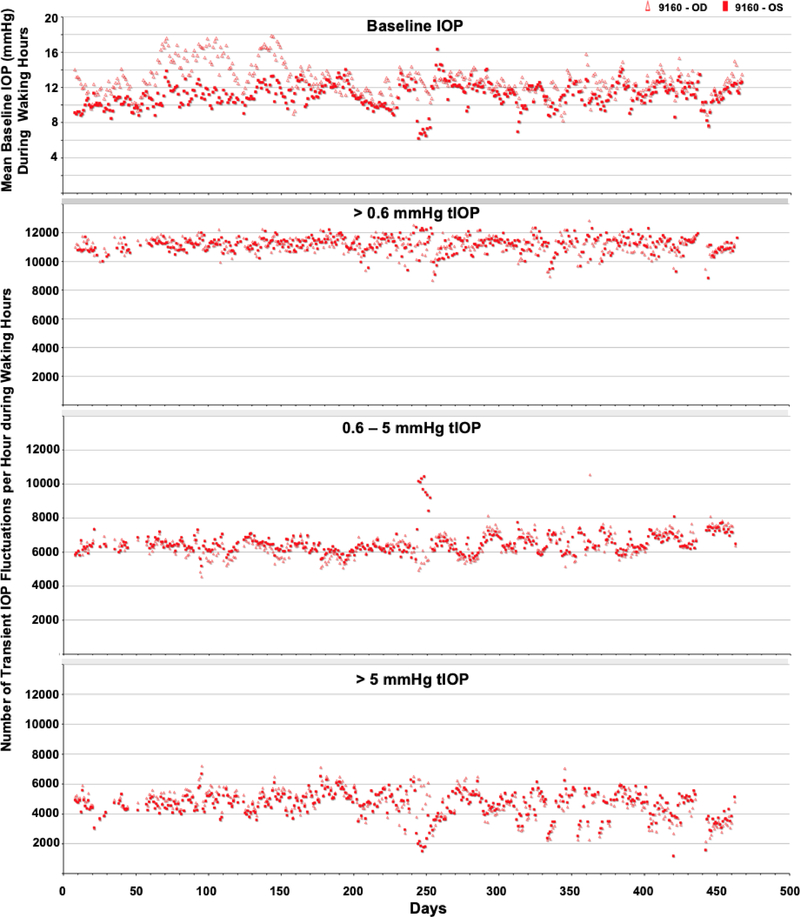
The average number of transient IOP fluctuations > 0.6 mmHg above baseline, 0.6–5 mmHg and >5 mmHg above momentary baseline IOP were much greater during waking hours (6:00–18:00) than during sleeping hours (18:00–6:00) in all seven eyes of four NHPs (Figure 3). Hence, only data from waking hours were analyzed. Figures 4–6 show the daily mean number of transient IOP fluctuations > 0.6 mmHg, 0.6–5 mmHg and >5 mmHg above baseline per hour during waking hours only, as well as mean baseline IOP during waking hours, plotted by day for each NHP.
Figure 3.
Mean number of transient IOP fluctuations per hour >0.6 mmHg, 0.6–5 mmHg, and > 5 mmHg above baseline, all plotted on a 24-hour time scale. Waking hours are 6:00–18:00, represented by the yellow overlay.
Figure 4.
Daily average baseline IOP and number of transient IOP fluctuations per hour within varying magnitude bins during waking hours (6AM-6PM) for animal 0804025.
Figure 6.
Daily average baseline IOP and number of transient IOP fluctuations per hour within varying magnitude bins during waking hours (6AM-6PM) for animal 9028.
The periodic autocorrelation function of both daily mean baseline IOP and the average number of transient IOP fluctuations > 0.6 mmHg, 0.6–5 mmHg and > 5 mmHg per hour during waking hours exhibited a significant 16- to 91-day cyclic patterns in all eyes of all NHPs (Figure 7). The lone exception to this is the lack of a significant cyclic pattern in the number of transient IOP fluctuations 0.6–5 mmHg in magnitude per hour during waking hours in both eyes of NHP 9160. As mentioned previously, there can be multiple significant cyclic periods in each variable in each eye due to the fact that the repeating pattern is not a perfect sinusoid, but the dominant cyclic pattern can be discerned by sorting the magnitudes of FFT peak power. Hence the range of dominant cyclic pattern periods across eyes for each variable are: baseline IOP (29–59 days), and 38–39, 16–42, and 39–43 days for the frequency of transient IOP fluctuations in the >0.6, 0.6–5, and >5 mmHg magnitude bins, respectively. There was at least a 100% change in the daily mean number of transient IOP fluctuations per hour > 0.6 mmHg, 0.6–5 mmHg and > 5 mmHg at the peak of the cycle compared to periods at the trough of the cycle (Figures 4–6). The strongest cyclic patterns were observed in animal 0804025, whereas the weakest cyclic patterns, although still significant in all but the 0.6–5 mmHg magnitude bin, were observed in animal 9160. Fellow eyes within animals showed a similar cyclic pattern of transient IOP fluctuations and the difference in the cyclic pattern is much greater between animals than between fellow eyes within animals (Figure 7).
Figure 7.
Significant FFT power peaks and cyclic periods for baseline IOP, and the frequency of transient IOP fluctuations >0.6, 0.6–5, and >5 mmHg above baseline for each eye in animals A) 0804025 (green), B) 9160 (red), and C) 9028 (blue). The dark line in each plot represents the mean of the largest power peak from 1000 FFTs of randomized raw data, and the dotted grey line represents the 95% confidence limit of the peak power from randomized raw data.
Body temperature (measured via telemetry) and animal holding room temperature did not show a significant cyclic pattern, either in individual animals or overall. Seasonal, solar, lunar, feeding and cage cleaning cycles were not correlated to the cyclic patterns reported for the IOP-related parameters.
4. Discussion
A significant, ~40-day cyclic pattern in the number of transient IOP fluctuations was identified in five eyes of three male NHPs in which IOP was monitored continuously for 125–451 days using continuous telemetry. A concomitant dominant cyclic pattern of 29–59 days was also found in mean baseline IOP, which is the portion of IOP excluding the transient IOP fluctuations. The FFT method identified the strength of the temporal autocorrelation pattern within each eye, showing the cyclic pattern of transient IOP fluctuations is significant but variable across eyes. Previous studies have identified a seasonal change in mean IOP, but this is the first study to characterize the pattern of transient IOP fluctuations over time or demonstrate a cyclic pattern.
The structural stiffness of the ocular coat is a factor in modulating the amplitude of IOP fluctuations.35,36 The ocular coat of the eye acts as an elastic shock absorber that serves to decrease the amplitude IOP fluctuations due to ocular perturbations such as blink, saccade, and systolic vascular filling. Hence, when the ocular coat is stiff, transient IOP fluctuation magnitude will be greater due to the eye’s inability to elastically expand and absorb the perturbation. Recurring insults on the eye can be caused by internal forces (ocular pulse due to systolic filling and capillary filling), or external forces (blinks, saccades, eye rubs).8,9,37 Based on this, higher ocular coat stiffness will result in larger transient IOP fluctuations.15,38 Also, larger transient IOP fluctuations can occur at normal IOP mean levels in stiffer eyes or the transient IOP fluctuations can be smaller at higher IOPs in compliant eyes. The cyclic pattern in transient IOP fluctuation identified herein likely drives a cyclical pattern in mechanical stress and strain of the tissues in the ocular coats and optic nerve head as well, which has been identified as the site of axonal damage in glaucoma.39–46 Transient IOP fluctuations could also affect the homeostasis of the trabecular meshwork and aqueous outflow regulation pathways, providing a direct feedback loop with dynamic IOP.43,47–49
There is no obvious explanation as to why the number of transient IOP fluctuations would follow a cyclic pattern, what the mechanism behind such a pattern might be, and if the observed cyclic pattern in transient IOP fluctuation frequency is related to cyclic changes in ocular coat stiffness. Experiments with NHPs of different ages would show if ocular coat stiffness changes with age are related to transient IOP fluctuation magnitude and/or frequency, and if a cyclic pattern in transient IOP fluctuation magnitude exists in older animals.
There are no obvious external factors governing the timing of the cyclic pattern of transient IOP fluctuations observed in this study. The seasonal, lunar and solar pattern was assessed as possible correlates, but the neither the baseline IOP or transient IOP fluctuation cycles are related. The schedule of the animals’ calibration and anesthesia schedule was also assessed, and there was no correlation found between the cyclic pattern in transient IOP fluctuations and the timing of experimental procedures. The temperature of the animal holding room for the data collection period was maintained in a tight range (73.1 ± 1.1°F), and the NHPs were exposed to a constant 12-hour light/dark cycle via automatic timer, so neither of these variables are likely to engender the observed results. Following the study period, a calibrated digital temperature and humidity logger (DicksonWare Model TP425, Dickson Data Solutions, Addison, IL) was placed in the animal holding room; the daily temperature matches the same range collected during the study period by the animal care staff, confirming the temperature and humidity does not change appreciably within the animal holding room. Hence, there are no obvious environmental or experimental factors related to the cyclic pattern identified in each of these animals’ transient IOP fluctuations.
The 0.6–5 mmHg bin represents OPA, as this is the range that OPA is detected within the signal, whereas the >5 mmHg bin represents the largest spikes of transient IOP, such as resulting from blinks and saccadic eye movements. The >0.6 mmHg bin shows all of the transient IOP fluctuations observed from all sources. It is possible that there is a correlation between cyclic pattern of transient IOP fluctuations and cyclic hormone changes. Further, we hypothesize that cyclical fluctuations in hormone levels either: 1) cause the animals to be more active and blink and/or move their eyes more frequently during peak periods, which leads to larger numbers of transient IOP fluctuations in the > 0.6–5 mmHg and > 5 mmHg above baseline bands, and/or 2) cause cyclical stiffening of the corneoscleral shell, resulting in a larger number of transient IOP fluctuations that exceed the > 5mmHg threshold. In pregnancy for example, the cervix and joints of females become more compliant through hormonal changes; only male NHPs were used in this study, but it is possible that males exhibit a cyclic pattern of hormone changes that alter connective tissue compliance. A cyclic pattern in transient IOP fluctuation frequency was observed in all three magnitude bands, which suggests that increased general ocular activity and/or increased corneoscleral shell stiffness could underlie these findings.
Mean baseline IOP also exhibits a significant cyclic pattern. It is unclear if baseline IOP would be correlated to changes in corneoscleral shell material properties, as it should be driven primarily by aqueous inflow/outflow dynamics. It has been shown however that corneoscleral shell stiffness is higher at higher baseline IOPs due to the hyperelastic nature of the tissues10,35,36, and therefore the higher number of large magnitude transient IOP fluctuations >5 mmHg could be driven by higher baseline IOP. That said, cyclic changes in baseline IOP and/or corneoscleral shell mechanical properties cannot explain the cyclic pattern seen in the total number of transient IOP fluctuations >0.6 mmHg, as ocular rigidity would affect the magnitude but not the total number of transient IOP fluctuations. Hence, we would expect that cyclic increases in corneoscleral stiffness and/or baseline IOP could drive the cyclic increases in the frequency of transient IOP fluctuations >5 mmHg while simultaneously decreasing their frequency in the 0.6–5 mmHg bin. However, it is not likely that changes in corneoscleral shell compliance and/or baseline IOP are driving the cyclic pattern seen in the total number of transient IOP fluctuations >0.6 mmHg, and therefore a different mechanism likely underlies that finding. Of note, transient IOP fluctuations from blinks are generally of larger magnitude (>5 mmHg), so increased blinking frequency alone is unlikely to underlie the reported cyclic pattern. Future analysis of transient IOP fluctuations in female NHPs would determine if these patterns are dependent on sex. Periodic hormonal testing, coupled with continuous IOP and OPP telemetry may be needed to determine a relationship between hormonal changes and IOP fluctuations. These data could allow us to gain a better understanding of hormone changes with seasonal, stress, and/or a circadian rhythm change and inform ocular physiology and clinical studies of transient IOP fluctuations.
This study has the following limitations. First, all three NHPs were male and the same age, which preclude testing any hypotheses based on sex and age. Also, the results presented herein were observational in nature and discovered only after the data were collected, precluding any experiments designed to identify the sources of the reported cyclic pattern in transient IOP fluctuation frequencies other than data that could be assessed retrospectively. As a result, we did not measure hormone levels, the intake of water and food, or the urine and feces output in the animals, and so future studies will be required to elucidate the effects of these variables on transient IOP fluctuations.
5. Conclusion
In conclusion, there is an ~29- to 59-day cyclic pattern in mean baseline IOP, and a ~16- to 43-day cyclic pattern the number of transient IOP fluctuations during waking hours > 0.6 mmHg, 0.6–5 mmHg, and >5mmHg above baseline in male NHPs. The etiology of these fluctuations in unknown, but does not appear to be related to any measured experimental or environmental factors. Further work is needed to determine the cause of the fluctuation and any potential impact on ocular physiology and homeostasis. While the importance of the cyclic pattern identified in transient IOP fluctuations is unknown at this time, it is plausible that this pattern is relevant to both homeostasis and pathophysiology of the ONH, corneoscleral shell, and aqueous outflow pathways.
Figure 5.
Daily average baseline IOP and number of transient IOP fluctuations per hour within varying magnitude bins during waking hours (6AM-6PM) for animal 9160.
Acknowledgement
Funding: This work was supported by the National Institutes of Health R01 EY024732 (JCD), EY026035 (JCD) and P30 EY003039 (Pittler; UAB NEI Core Infrastructure Grant); EyeSight Foundation of Alabama (Unrestricted Funds); Research to Prevent Blindness (Unrestricted Funds). The authors sincerely thank Dr. Lawrence Sincich for his invaluable assistance with the autocorrelation and FFT analyses. We also thank Lisa Hethcox, LVT for her invaluable help in the both the care of the NHPs and data acquisition, and Chester Calvert for his invaluable assistance in data procurement and processing.
Funding Information
National Institutes of Health [R01 EY024732 (JCD), EY026035 (JCD) and P30 EY003039 (Pittler; UAB NEI Core Infrastructure Grant)]; EyeSight Foundation of Alabama [Unrestricted Funds]; Research to Prevent Blindness [Unrestricted Funds]
Footnotes
Declaration of Interest
The authors report no conflicts of interest and have no proprietary interest in any of the materials mentioned in this article.
References
- 1.Station W Predictive Factors for Open-Angle Glaucoma among Patients with Ocular Hypertension in the European Glaucoma Prevention Study. Ophthalmology. 2007;114(1):3–9. [DOI] [PubMed] [Google Scholar]
- 2.Leske MC, Wu SY, Hennis A, Honkanen R, Nemesure B. Risk Factors for Incident Open-angle Glaucoma. The Barbados Eye Studies. Ophthalmology. 2008;115(1):85–93. [DOI] [PubMed] [Google Scholar]
- 3.Leske MC, Heijl A, Hyman L, Bengtsson B, Dong L, Yang Z. Predictors of Long-term Progression in the Early Manifest Glaucoma Trial. Ophthalmology. 2007;114(11):1965–72. [DOI] [PubMed] [Google Scholar]
- 4.Gordon MO. The Ocular Hypertension Treatment Study. Arch Ophthalmol. 2002;120(6):714 Available from: http://archopht.jamanetwork.com/article.aspx?articleid=270929 [DOI] [PubMed] [Google Scholar]
- 5.Downs JC, Burgoyne CF, Seigfreid WP, Reynaud JF, Strouthidis NG, Sallee V. 24-hour IOP telemetry in the nonhuman primate: implant system performance and initial characterization of IOP at multiple timescales. Invest Ophthalmol Vis Sci. 2011. September;52(10):7365–75. Available from: http://www.ncbi.nlm.nih.gov/pubmed/21791586 [DOI] [PMC free article] [PubMed] [Google Scholar]
- 6.Seigfreid WP, Burgoyne CF, Reynaud J, Downs JCC. IOP Telemetry In Non-human Primates: IOP Fluctuations Due To Blink and Saccade. Invest Ophthalmol Vis Sci. 2011. April 22;52(14):656 Available from: http://dx.doi.org/ [DOI] [PMC free article] [PubMed] [Google Scholar]
- 7.Coleman DJ, Trokel S. Direct-recorded intraocular pressure variations in a human subject. Arch Ophthalmol. 1969. November;82(5):637–40. Available from: http://www.ncbi.nlm.nih.gov/pubmed/5357713 [DOI] [PubMed] [Google Scholar]
- 8.Dastiridou AI, Ginis HS, de Brouwere D, Tsilimbaris MK, Pallikaris IG. Ocular rigidity, ocular pulse amplitude, and pulsatile ocular blood flow: The effect of intraocular pressure. Invest Ophthalmol Vis Sci. 2009;50(12):5718–22. [DOI] [PubMed] [Google Scholar]
- 9.Kaufmann C, Bachmann LM, Robert YC, Thiel M a. Ocular pulse amplitude in healthy subjects as measured by dynamic contour tonometry. Arch Ophthalmol. 2006;124:1104–8. [DOI] [PubMed] [Google Scholar]
- 10.Downs JC. IOP telemetry in the nonhuman primate. Exp Eye Res. 2015. December;141:91–8. [DOI] [PMC free article] [PubMed] [Google Scholar]
- 11.Albon J, Purslow PP, Karwatowski WS, Easty DL. Age related compliance of the lamina cribrosa in human eyes. Br J Ophthalmol. 2000;84:318–23. [DOI] [PMC free article] [PubMed] [Google Scholar]
- 12.Girard MJA, Suh JKF, Bottlang M, Burgoyne CF, Downs JC. Scleral biomechanics in the aging monkey eye. Invest Ophthalmol Vis Sci. 2009;50(11):5226–37. [DOI] [PMC free article] [PubMed] [Google Scholar]
- 13.Fazio MA, Grytz R, Morris JS, Bruno L, Gardiner SK, Girkin CA, et al. Age-related changes in human peripapillary scleral strain. Biomech Model Mechanobiol. 2014;13(3):551–63. [DOI] [PMC free article] [PubMed] [Google Scholar]
- 14.Grytz R, Fazio MA, Libertiaux V, Bruno L, Gardiner S, Girkin CA, et al. Age-and race-related differences in human scleral material properties. Invest Ophthalmol Vis Sci. 2014;55(12):8163–72. [DOI] [PMC free article] [PubMed] [Google Scholar]
- 15.Girard MJA, Francis Suh JK, Bottlang M, Burgoyne CF, Crawford Downs J. Biomechanical changes in the sclera of monkey eyes exposed to chronic IOP elevations. Invest Ophthalmol Vis Sci. 2011;52(8):5656–69. [DOI] [PMC free article] [PubMed] [Google Scholar]
- 16.Cartwright NEK, Tyrer JR, Marshall J. Age-related differences in the elasticity of the human cornea. Invest Ophthalmol Vis Sci. 2011;52(7):4324–9. [DOI] [PubMed] [Google Scholar]
- 17.Girkin CA, McGwin G, Xie A, Deleon-Ortega J. Differences in optic disc topography between black and white normal subjects. Ophthalmology. 2005;112(1):33–9. [DOI] [PubMed] [Google Scholar]
- 18.Fazio MA, Grytz R, Morris JS, Bruno L, Girkin CA, Downs JC. Human scleral structural stiffness increases more rapidly with age in donors of African descent compared to donors of European descent. Invest Ophthalmol Vis Sci. 2014;55(11):7189–98. [DOI] [PMC free article] [PubMed] [Google Scholar]
- 19.Schwartz B, Talusan AG. Spontaneous trends in ocular pressure in untreated ocular hypertension. Arch Ophthalmol. 1980. January;98(1):105–11. [DOI] [PubMed] [Google Scholar]
- 20.Qureshi IA, Xiao RX, Yang BH, Zhang J, Xiang DW, Hui JL. Seasonal and diurnal variations of ocular pressure in ocular hypertensive subjects in Pakistan. Singapore Med J. 1999. May;40(5):345–8. [PubMed] [Google Scholar]
- 21.Qureshi IA, Xi XR, Lu HJ, Wu XD, Huang YB, Shiarkar E. Effect of seasons upon intraocular pressure in healthy population of China. Korean J Ophthalmol. 1996. Jun;10(1):29–33. [DOI] [PubMed] [Google Scholar]
- 22.Stoupel E, Goldenfeld M, Shimshoni M, Siegel R. Intraocular pressure (IOP) in relation to four levels of daily geomagnetic and extreme yearly solar activity. Int J Biometeorol. 1993. February;37(1):42–5. [DOI] [PubMed] [Google Scholar]
- 23.Cheng J, Xiao M, Xu H, Fang S, Chen X, Kong X, et al. Seasonal changes of 24-hour intraocular pressure rhythm in healthy Shanghai population. Medicine. 2016. Aug;95(31):e4453. [DOI] [PMC free article] [PubMed] [Google Scholar]
- 24.Bengtsson B Some factors affecting the distribution of intraocular pressures in a population. Acta Ophthalmol. 1972;50(1):33–46. [DOI] [PubMed] [Google Scholar]
- 25.Gardiner SK, Demirel S, Gordon MO, Kass MA. Seasonal changes in visual field sensitivity and intraocular pressure in the ocular hypertension treatment study. Ophthalmology. 2013. April;120(4):724–30. [DOI] [PMC free article] [PubMed] [Google Scholar]
- 26.Blumenthal M, Blumenthal R, Peritz E, Best M. Seasonal variation in intraocular pressure. Am J Ophthalmol. 1970. April;69(4):608–10. [DOI] [PubMed] [Google Scholar]
- 27.Bar-Ilan A Diurnal and seasonal variations in intraocular pressure in the rabbit. Exp Eye Res. 1984. August;39(2):175–81. [DOI] [PubMed] [Google Scholar]
- 28.Takahashi T, Inamochi K, Masuda K, Sawa M. Circadian rhythms in aqueous protein concentration and intraocular pressure in rabbits. Jpn J Ophthalmol. 1995;39(1):49–54. [PubMed] [Google Scholar]
- 29.Douarec L Diurnal and Seasonal Variations in Intraocular the Rabbit Pressure in. 1984;(1964).
- 30.Vareilles P, Conquet P, Le Douarec JC. A method for the routine intraocular pressure (IOP) measurement in the rabbit: range of IOP variations in this species. Exp Eye Res. 1977. April;24(4):369–75. [DOI] [PubMed] [Google Scholar]
- 31.Bronson FH. Are humans seasonally photoperiodic? J Biol Rhythms. 2004. June;19(3):180–92. [DOI] [PubMed] [Google Scholar]
- 32.Markert JE, Jasien J V, Turner DC, Huisingh C, Girkin CA, Downs JC. IOP, IOP transient impulse, ocular perfusion presssure, and mean arterial pressure relationships in nonhuman primates instrumented with telemetry. Invest Ophthalmol Vis Sci. 2018;59. [DOI] [PMC free article] [PubMed] [Google Scholar]
- 33.Dunn PF. Measurement and data analysis for engineering and science. CRC press; 2014. [Google Scholar]
- 34.Chatfield C Analysis of Time Series: An Introduction. 6th ed. New York: Chapman and Hall; 2003. 352 p. [Google Scholar]
- 35.Morris HJ, Tang J, Perez BC, Pan X, Hart RT, Weber PA, et al. Correlation between biomechanical responses of posterior sclera and IOP elevations during micro intraocular volume change. Invest Ophthalmol Vis Sci. 2013;54(12):7215–22. [DOI] [PMC free article] [PubMed] [Google Scholar]
- 36.Liu J, He X. Corneal stiffness affects iop elevation during rapid volume change in the eye. Invest Ophthalmol Vis Sci. 2009;50(5):2224–9. [DOI] [PubMed] [Google Scholar]
- 37.Coleman DJ, Trokel S. Direct-recorded intraocular pressure variations in a human subject. Arch Ophthalmol. 1969. November;82(5):637–40. [DOI] [PubMed] [Google Scholar]
- 38.Downs JC, Suh JKF, Thomas KA, Bellezza AJ, Hart RT, Burgoyne CF. Viscoelastic material properties of the peripapillary sclera in normal and early-glaucoma monkey eyes. Invest Ophthalmol Vis Sci. 2005;46(2):540–6. [DOI] [PubMed] [Google Scholar]
- 39.Kirwan RP, Crean JK, Fenerty CH, Clark AF, O’Brien CJ. Effect of cyclical mechanical stretch and exogenous transforming growth factor-beta1 on matrix metalloproteinase-2 activity in lamina cribrosa cells from the human optic nerve head. J Glaucoma. 2004. August;13(4):327–34. [DOI] [PubMed] [Google Scholar]
- 40.Morrison JC. Integrins in the optic nerve head: potential roles in glaucomatous optic neuropathy (an American Ophthalmological Society thesis). Trans Am Ophthalmol Soc. 2006;104:453–77. [PMC free article] [PubMed] [Google Scholar]
- 41.Qu J, Chen H, Zhu L, Ambalavanan N, Girkin CA, Murphy-Ullrich JE, et al. High-Magnitude and/or High-Frequency Mechanical Strain Promotes Peripapillary Scleral Myofibroblast Differentiation. Invest Ophthalmol Vis Sci. 2015. December;56(13):7821–30. [DOI] [PMC free article] [PubMed] [Google Scholar]
- 42.Quill B, Irnaten M, Docherty NG, McElnea EM, Wallace DM, Clark AF, et al. Calcium channel blockade reduces mechanical strain-induced extracellular matrix gene response in lamina cribrosa cells. Br J Ophthalmol. 2015. July;99(7):1009–14. [DOI] [PubMed] [Google Scholar]
- 43.Zou H, Yuan R, Zheng Q, Huo Y, Lang M, Ji S, et al. Fluctuations in intraocular pressure increase the trabecular meshwork extracellular matrix. Cell Physiol Biochem. 2014;33(4):1215–24. [DOI] [PubMed] [Google Scholar]
- 44.Li Y, Schlamp CL, Nickells RW. Experimental induction of retinal ganglion cell death in adult mice. Invest Ophthalmol Vis Sci. 1999. April;40(5):1004–8. [PubMed] [Google Scholar]
- 45.Schmitt HM, Pelzel HR, Schlamp CL, Nickells RW. Histone deacetylase 3 (HDAC3) plays an important role in retinal ganglion cell death after acute optic nerve injury. Mol Neurodegener. 2014. September;9:39. [DOI] [PMC free article] [PubMed] [Google Scholar]
- 46.Howell GR, Soto I, Libby RT, John SWM. Intrinsic axonal degeneration pathways are critical for glaucomatous damage. Exp Neurol. 2013. August;246:54–61. [DOI] [PMC free article] [PubMed] [Google Scholar]
- 47.Xin C, Song S, Johnstone M, Wang N, Wang RK. Quantification of Pulse-Dependent Trabecular Meshwork Motion in Normal Humans Using Phase-Sensitive OCT. Invest Ophthalmol Vis Sci. 2018. July;59(8):3675–81. [DOI] [PMC free article] [PubMed] [Google Scholar]
- 48.Li P, Reif R, Zhi Z, Martin E, Shen TT, Johnstone M, et al. Phase-sensitive optical coherence tomography characterization of pulse-induced trabecular meshwork displacement in ex vivo nonhuman primate eyes. J Biomed Opt. 2012. July;17(7):76026. [DOI] [PubMed] [Google Scholar]
- 49.Li P, Shen TT, Johnstone M, Wang RK. Pulsatile motion of the trabecular meshwork in healthy human subjects quantified by phase-sensitive optical coherence tomography. Biomed Opt Express. 2013;4(10):2051–65. [DOI] [PMC free article] [PubMed] [Google Scholar]


