Figure 2.
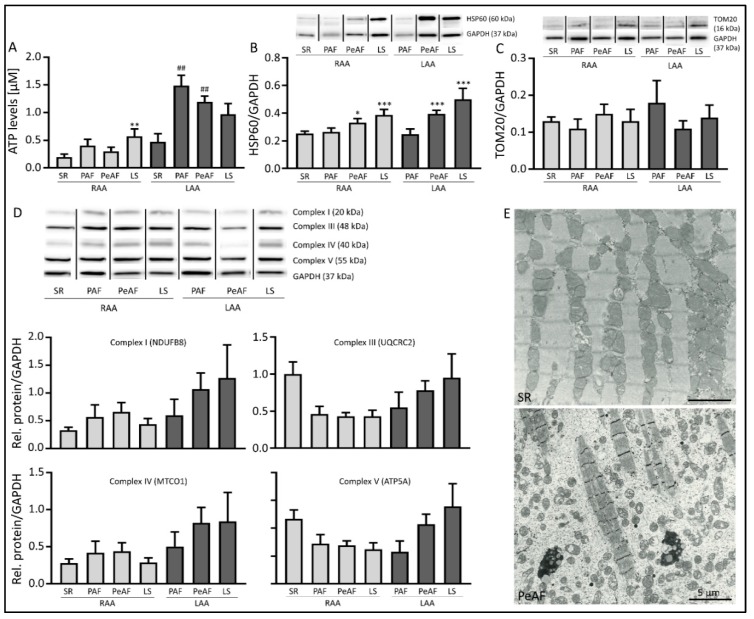
AF patients show mitochondrial dysfunction. (A) Cellular ATP levels in right atrial appendage (RAA) or left atrial appendage (LAA) of patients in sinus rhythm (SR), paroxysmal (PAF), persistent (PeAF) or longstanding persistent (LS) AF. (B) Top panel represent Western blot of HSP60 and GAPDH, lower panel reveals quantified data of HSP60 normalized for GAPDH. (C) Top panel represent Western blot of TOM20 and GAPDH, lower panel reveals quantified data of TOM20 normalized for GAPDH. (D) Top panel represent Western blot of respiratory chain complexes I, III, IV and V. Lower panels reveal quantified data of the respiratory chain complexes normalized for GAPDH in RAA of SR and RAA and LAA of PAF, PeAF and LS patients. (E) Electron microscopic images of LAA of a patient in SR (top), showing normal sarcomere structure and mitochondrial localization along the sarcomeres, and LAA of PeAF, showing myolysis and dispersed mitochondria. * p < 0.05, ** p < 0.01, *** p < 0.001 vs. SR RAA, ## p < 0.01 vs. SR LAA.

