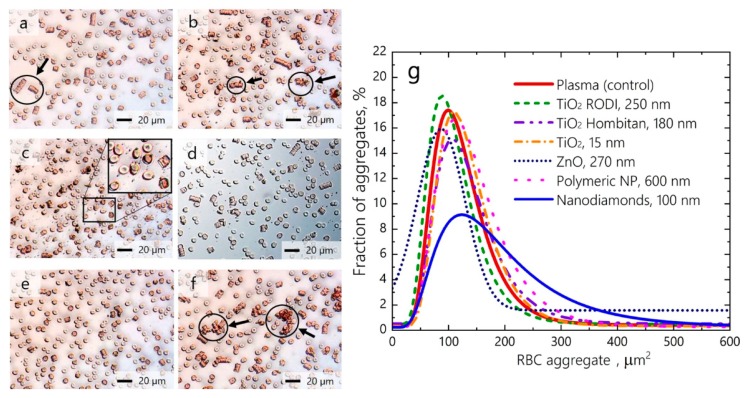
Figure 1.
Relative size distribution of erythrocyte aggregates observed by conventional optical microscopy under the influence of (a) polymeric NPs 600 nm; (b) TiO2 NPs 250 nm; (c) TiO2 NPs 180 nm; (d) TiO2 NPs 15 nm; (e) ZnO NPs 270 nm; and (f) nanodiamonds 100 nm. (g) Distribution of erythrocyte aggregates by occupied area based on the quantitative assessment of images in (a–f) (adapted with permission [32]).

