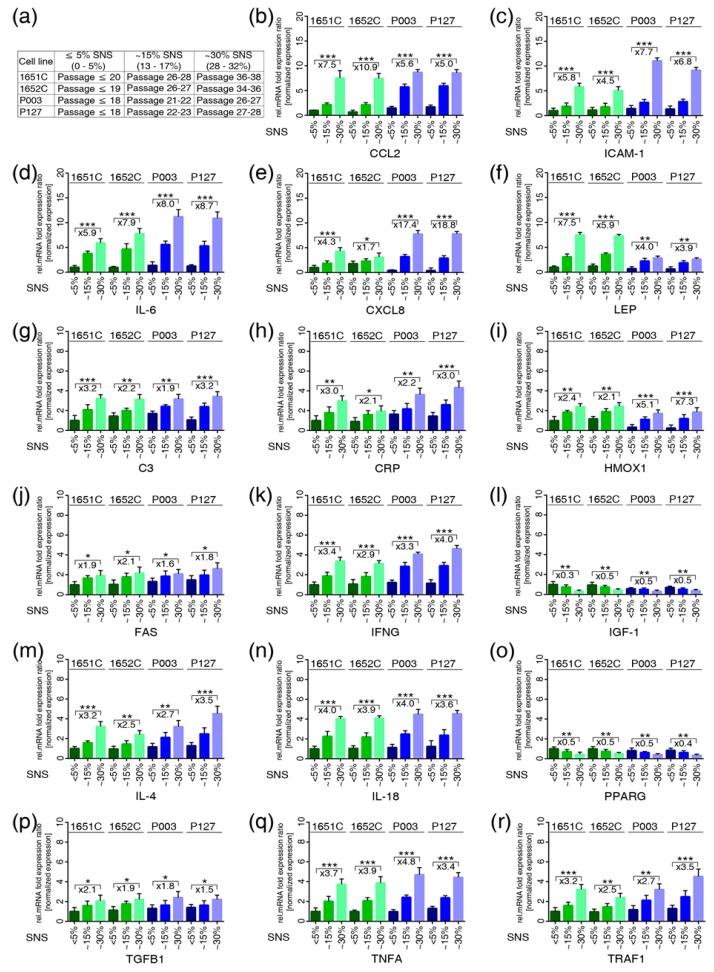
Figure 2.
Quantitative real-time PCR analysis of the 17 genes identified by text mining in normal and HGPS cells during replicative senescence. (a) Table showing the cell strains and the passages corresponding percentage of senescence (SNS). (b–r) mRNA levels of the indicated genes were determined in controls (GMO1651c, and GMO1652c) and HGPS (HGADFN003 and HGADFN127) cell strains at the indicated percentage of senescence (SNS). Relative expression was normalized to the expression of GAPDH. Graphs show the mean ± SD (* p < 0.05, ** p < 0.01, *** p < 0.001, n > 3). The mean fold changes between 5% and 30% SNS for control and HGPS are indicated.

