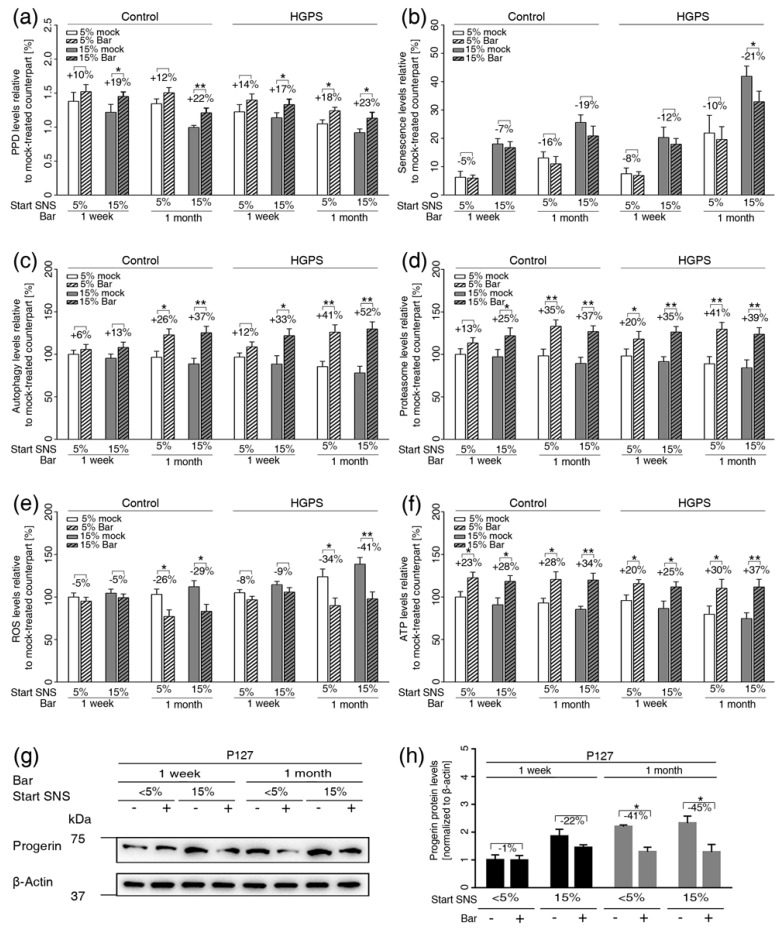
Figure 5.
Bar treatment ameliorates normal and HGPS cellular functions during long-term treatment. (a) Graph shows the population doublings of control (GMO1651c, and GMO1652c) and HGPS (HGADFN003, and HGADFN127) cells. Bar (1 μM) or DMSO treatment was administrated for one week or one month as indicated. The percentage of senescence (SNS) in cultures prior to treatment is indicated. (b) Graph shows the percentage of SA-ß-gal-positive cells measured after treatment. (c) Autophagy activity was determined by measuring MDC levels using fluorescence photometry of the same cultures as in (a). (d) Proteasome activity was determined by measuring chymotrypsin-like proteasome activity using Suc-LLVY-AMC as a substrate. (e) Intracellular ROS levels were determined by measuring oxidized dichlorofluorescein (DCF) levels using a DCFDA cellular ROS detection assay. (f) Cellular ATP levels were measured using a CellTiter-Glo luminescence ATP assay. (c–f) The percent change in Bar-treated cells relative to mock-treated counterparts is indicated. (g) Representative images of a western blot for progerin in HGPS (HGADFN127) cells from cultures at 5% and 15% senescence that were administrated the mock or Bar treatment for one week or one month as indicated. (h) Quantification of the progerin signal. The percent change between Bar-treated cells and mock-treated counterparts are indicated. Graphs show the mean ± SD. Comparisons were performed by two-tailed t test (* p < 0.05, ** p < 0.01, *** p < 0.01, (n > 3)).

