

Abstract
We studied one- and two-photon induced fluorescence of Pacific Blue (PB)-labeled human serum albumin (HSA) in the presence of different size silver colloids. The PB fluorescence emission intensity was observed with small (30–40 nm) and large (about 120 nm) colloids and compared with PB emission in absence of colloids. For the system with a small core size colloids we did not detect any fluorescence enhancement with one-photon excitation and the enhancement observed with two-photon excitation was about 2.5-fold. In contrast, for large silver colloids we observed about a 2-fold increase in PB fluorescence brightness for one-photon excitation, and the enhancement with two-photon excitation excided 13-folds. Much stronger increases in brightness observed with two-photon excitation, compared to one-photon excitation, indicate a dominant role of enhanced local field in fluorescence enhancement on silver colloids in solutions.
Keywords: silver colloids, enhanced fluorescence, two photon excitation
INTRODUCTION
It has been known for several decades that the presence of noble metals can affect the emission of molecules.1-4 In recent years our group and others reported fluorescence enhancements observed for fluorophores deposited on surfaces formed from silver islands,5-9 colloids,10,11 or electrochemically created silver fractals.12 The magnitude of enhancement depends on the fluorophore quantum yield,5 fluorophore–metal distance,7,13 and on the size/shape of silver particles. The strongest enhancements have been observed for a rough fractal structure.12,14 There appear to be three interactions responsible for these spectral changes. First, in a close proximity, up to about 20 Å from the metal surface the dominant factor is a quenching.15-18 Second, the electromagnetic field near metallic nanostructures can be many-folds stronger than the incident light field. This phenomenon is known as an enhanced local field. Third, the interaction of the excited fluorophore dipole with a metallic particle can result in a rapid emission of the photon, the phenomenon we call RDE (Radiative Decay Engineering). This effect, described from the fluorophore point of view, results in an increase of radiative decay rate. The maximal increase of the fluorophore brightness due to RDE is roughly proportional to the inverse of its quantum yield.5 The fluorescence enhancement on silvered surfaces has found beautiful applications in DNA hybridization19 and immunoassays.20
Although the colloid preparation and surface modification chemistry have been well developed, there are only limited reports on fluorescence enhancement in solutions.21,22 This is because of the difficulties with sample preparation such as uncontrolled colloid aggregation and precipitation21 or a lack of reliable controls.22
In this article we compare the effects of the size of colloids on the emission enhancement of fluorophore located on the colloid particles. The human serum albumin (HSA) has been labeled with Pacific Blue (PB). Then, small or large silver colloids were coated with PB-labeled HSA. As a control sample, we used the equimolar solution of PB-labeled HSA without silver colloid. The silver colloids coated with unlabeled HSA were used as background. We used one-photon excitation at 360 nm and two-photon excitation at 780 nm, where two-photon induced fluorescence (TPIF) of PB is highly efficient.23
MATERIALS AND METHODS
Pacific Blue succinimidyl ester (PBSE) was obtained from Molecular Probes, Inc. (Eugene, OR). Nanopure H2O (<18.2 MΩ), purified using Millipore Milli-Q Gradient System, was used for all experiments. HSA and all common chemical compounds were purchased from Sigma-Aldrich (St. Louis, MO) and used without additional purification.
Preparation of Colloids
Silver colloids were prepared by reduction of silver nitrate with sodium citrate under controlled temperature/time conditions.
Small Colloids.
To a stirred solution of AgNO3 (36 mg in 200 mL H2O) at 90°C, 4 mL trisodium citrate (34 mM) was added dropwise. The reaction mixture was warmed to 90–95°C, and stirring was continued for 15 min (until the color of reaction mixture turned to pale yellow). The resulting mixture was then cooled in an ice-water bath for 15 min. The colloid solution was purified by centrifugation at 8000 rpm for 8 min and the precipitate (residue) was dissolved in 1 mM trisodium citrate (1 mL).
Large Colloids.
A stirred solution of AgNO3 (36 mg in 200 mL H2O) at 95°C was treated dropwise with 0.5 mL trisodium citrate (34 mM). The solution was stirred for 20 min and warmed to 96–98°C. Then 3.5 mL trisodium citrate (34 mM) was added dropwise to the reaction mixture in 5 portions (every 15–20 min). Stirring was continued for 25 min until the milky yellow color remained. The resulting mixture was then cooled in an ice-water bath for 10–15 min. The colloid was purified by centrifugation at 3,500 rpm for 6 min and precipitate was dissolved in 1 mM trisodium citrate (3 mL).
Preparation of Labeled HSA
The solution of 1.26 mg HSA in 1.5 mL of 0.2M bicarbonate buffer (pH ~ 9) was mixed with Pacific Blue succinimidyl ester (PBSE). Twenty-six microliters or 1.4 μL of 35 mM solution of PBSE in dimethylformamide (DMF) was added for high (L = 7.5, L is a ratio of fluorophore to protein) or low (L = 1.5) labeling, respectively. The reaction mixture was stirring at 30°C for 4 h. The final product was purified using a Sephadex G-25 column and 0.1× PBS buffer. The separation of free dye was very clear and no further steps of purification were needed. The labeling was determined spectrophotometrically.
Sample Preparation
Fifty microliters of 0.07 μM PB-labeled HSA (PB-HSA, L = 1.5 or L = 7.5) was added to the 50 μL of small or large colloid solution (OD = 0.35 at λmax in a 0.01-mm pathway cuvette). Similarly, 50 μL of 0.07 μM PB-HSA (L = 1.5 or L = 7.5) was added to the 50 μL of 0.1× PBS buffer solution, for reference. The following samples served as a backgrounds: (a) 50 μL of 0.07 μM unlabeled HSA was added to the 50 μL of small or large colloid and (b) 50 μL of 0.07 μM unlabeled HSA was added to the 50 μL of 0.1 × PBS solution. All samples with colloids were incubated 15 min before measurements to ensure protein adhesion to colloid particles.
Silver Colloid Characterization
Silver colloids were characterized by absorption spectra and atomic force microscopy (AFM) images collected using a Hewlett Packard model 8453 spectrophotometer and an atomic force microscope (TMX 2100 Explorer SPM, Veeco), respectively. The AFM was equipped with an AFM dry scanner, 100 by 100 μm. For AFM measurements, the silver colloid particles were deposited on APS-coated quartz slides. Surfaces were imaged in air, in tapping mode of operation, using a SFM noncontact mode cantilever (Veeco). Samples were washed with water and dried with nitrogen prior to imaging. The AFM scanner was calibrated using a standard calibration grid, as well as gold nanoparticles 100 nm in diameter from Ted Pella. Images were analyzed using SPMLab software.
Fluorescence Measurements
Emission spectra were collected in front-face geometry, using a demountable microcuvette 0.01-mm path length (Starna Cell, Inc., Atascadero, CA). The one-photon excitation measurements were done with a Varian Cary Eclipse Spectrofluorometer using a homemade chamber adjustment for front-face measurements.
Two-photon induced fluorescence measurements were done with a femtosecond Ti : Sapphire laser as described elsewhere.24-26 For the two-photon excitation, we used collimated to 200 μm in diameter laser beam with an average power of about 300 mW. The TPIF signal was steady at these conditions during the time of the measurement. For both one- and two-photon excitations, we used the same combination of filters on observation, 380-m long wave pass and BG 38 heat rejecting filter. All measurements were done with vertically polarized excitation and the observation polarizer was rotated to 54.7° (magic angle).
RESULTS AND DISCUSSION
To compare the effect of metal particle size on fluorescence enhancement, we prepared two types of silver colloids: small and large, as described in the Materials and Methods section. The extinction spectra of these colloid solutions are presented in Figure 1. Whereas spectrum of small colloids has a characteristic plasmonic shape with a maximum at about 415 nm, the spectrum of large colloids has an additional shoulder at about 700 nm. The extinction spectra of colloids coated with HSA show a small—about 5-nm—blue shift and are slightly narrower (not shown). We also registered the absorption spectra after all fluorescence measurements and did not notice any significant change.
FIGURE 1.
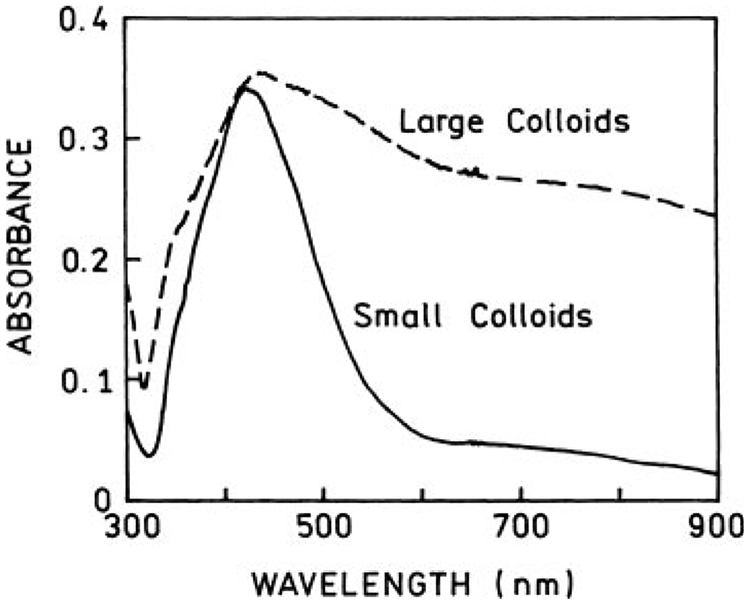
Extinction spectra of small (—) and large (– –) silver colloids. The large colloids display long-wavelength shoulder in their spectrum.
The colloids deposited on quartz slides were studied using AFM. The AFM images are shown in Figure 2. The large colloids are about 160–180 nm in diameter and are several-fold larger than the small, which are about 30 nm in diameter.
FIGURE 2.
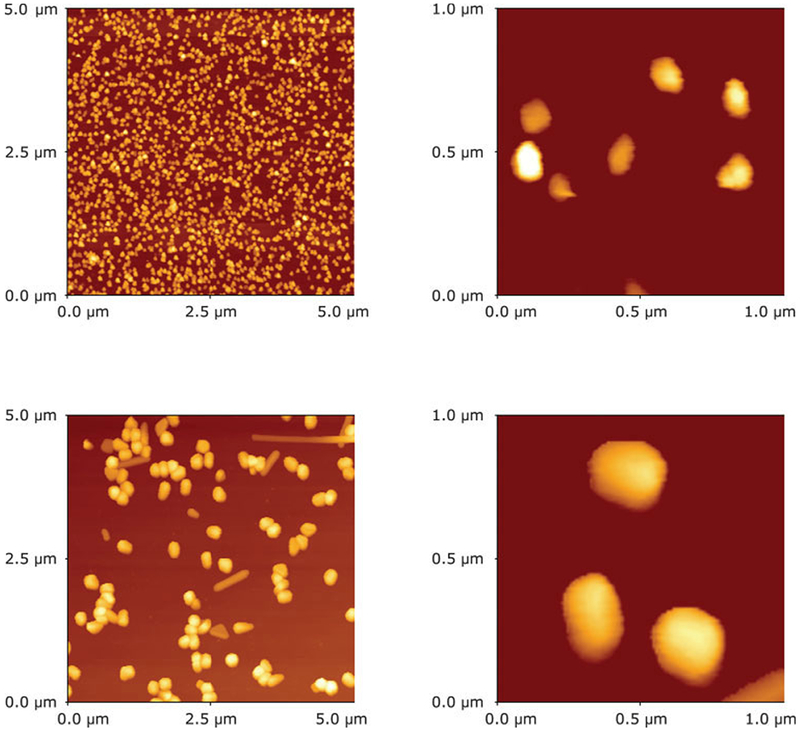
AFM images of small (top) and large (bottom) colloids. The left panels show 5 by 5 μm areas and the right panels show randomly selected 1 by 1 μm areas. The large colloids are about 5-fold bigger.
Next, we measured emission spectra with one- and two-photon excitation. For each set of measurements, we used four solutions: PB-HSA coated colloids, PB-HSA solution, HSA-coated colloids, and HSA solution. Each sample contained the same concentration of protein and the same concentration of dye, if applied. Two last solutions served as background controls. From the OD of used silver colloid solutions and concentration of proteins, we calculated that maximum coverage for small colloids was 6 protein molecules per silver particle and for large colloids about 68 protein molecules per silver particle. These calculations were based on the extinction cross-sections for silver colloids given in Ref. 27. Hence, the protein molecules occupied only about 1.5% of a small (30 nm) colloid surface and less than 1% of a large (160–180 nm) colloid surface. This suggests that all labeled or unlabeled proteins were bound to colloid particles and the amount of unbound proteins (present in equilibrium) in solution was negligible. It should be noted that the presence of unbound proteins will only lower the observed enhancements.
We started with a low-labeled PB-HSA (L = 1.5) sample. Emission spectra for small and large colloids with one-photon excitation are presented in Figures 3 and 4, respectively. In the case of small colloids (Figure 3), we observed no significant change in PB emission spectrum in the presence of colloids; the subtraction of backgrounds indicates about 10–15% fluorescence quenching. In contrast, large colloids (Figure 4) induce a modest enhancement to PB emission (about 2-fold).
FIGURE 3.
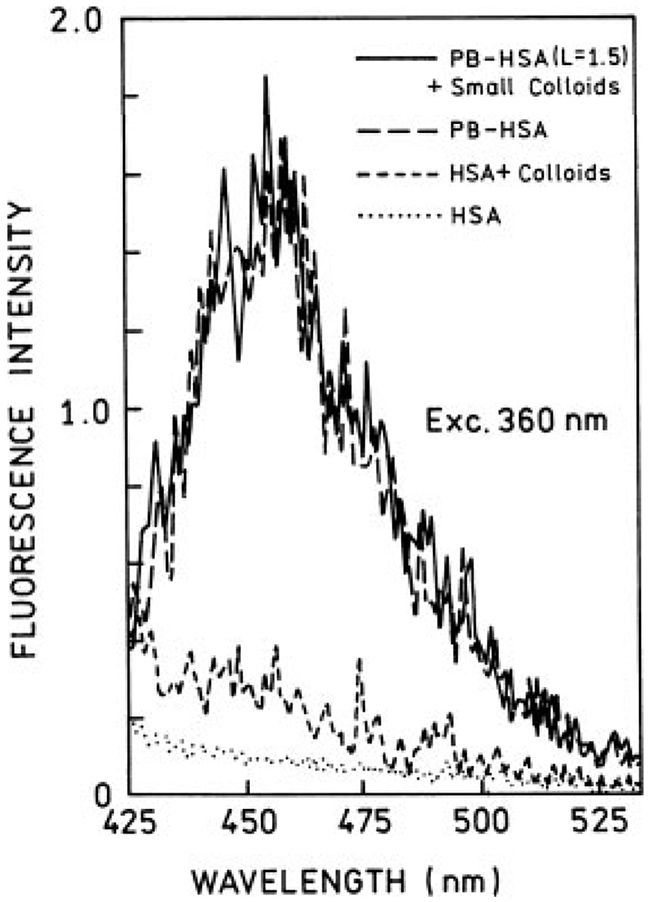
Emission spectra of Pacific Blue-labeled HSA (L = 1.5) in the presence (—) and absence (– –) of small silver colloids. The measurements were done in front-face format with 360-nm excitation. Also are shown respective backgrounds (no PB) for samples with (- - -) and without (⋯) colloids.
FIGURE 4.
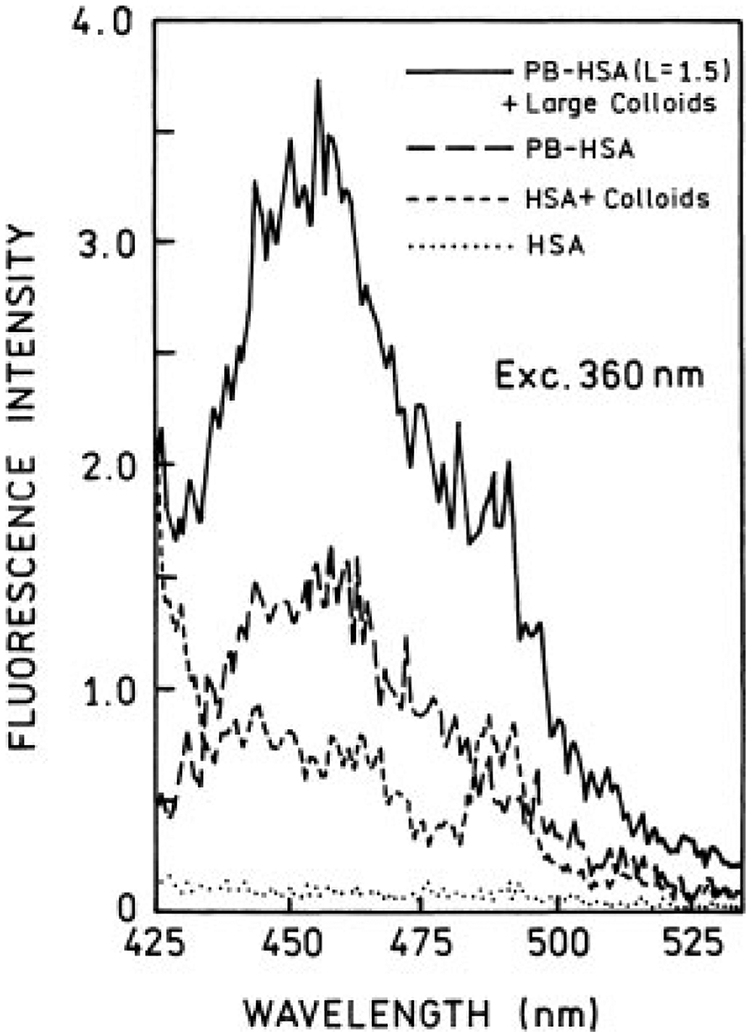
Emission spectra of Pacific Blue-labeled HSA (L = 1.5) in presence (—) and absence (– – –) of large silver colloids. Also are shown backgrounds for samples with (---) and without (⋯) colloids. The excitation was 360 nm.
The same solutions used in one-photon experiments were used for two-photon excitations. First, we checked that attenuation of excitation power by factor of 2.3 (0.4 neutral density filter) results in about a 5-fold decrease of fluorescence signal of PB-HSA solution, which indicates two-photon excitation. Under our excitation conditions we did not register any significant signal at 390 nm, which rejects the possibility of efficient second harmonic generation. Two-photon induced fluorescence (TPIF) spectra for small and large colloids are shown in Figures 5 and 6, respectively. The intensity with two-photon excitation is stronger in the presence of silver colloids. The enhancement effect is much stronger in the case of large colloids (Figure 6). Also, the relative colloid backgrounds are smaller for two-photon excitation than for one-photon excitation. We estimated the fluorescence enhancements with two-photon excitation to be 2.5 and 13 to 15-folds for small and large colloids, respectively.
FIGURE 5.
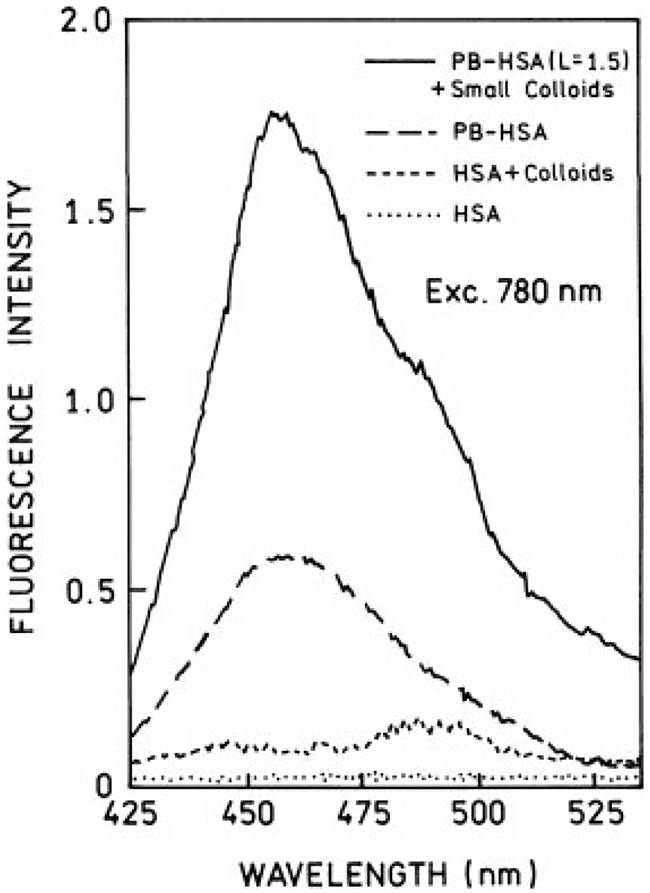
Two-photon induced fluorescence spectra of Pacific Blue-labeled HSA (L = 1.5) in the presence (—) and absence (– –) of small silver colloids. The front-face excitation at 780 nm was from the femtosecond Ti : Sapphire laser. The laser beam was collimated to about 200 μm in diameter. Also are shown respective backgrounds for samples with (- - -) and without (⋯) colloids.
FIGURE 6.
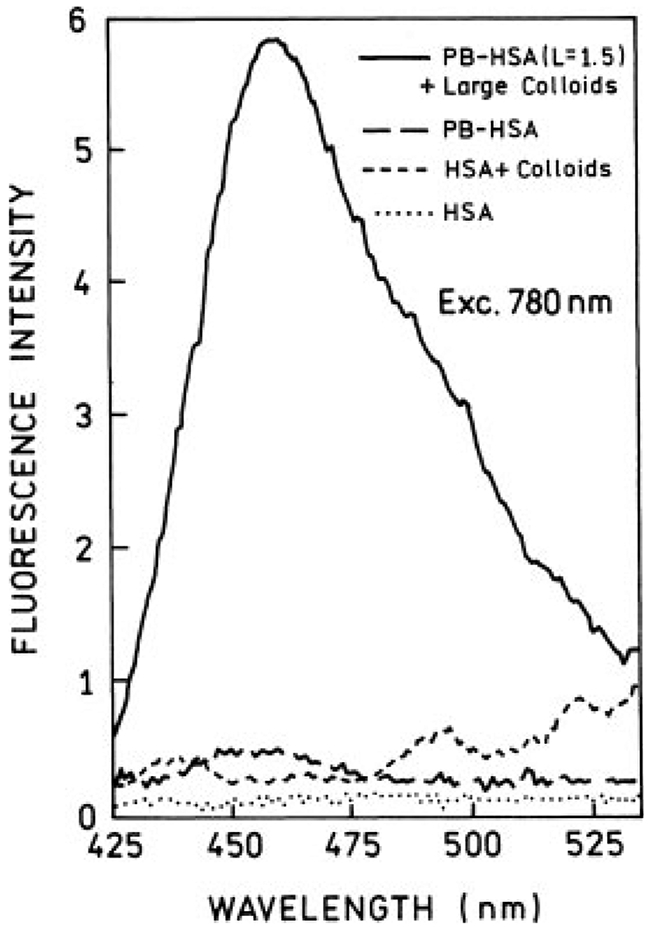
Two-photon induced fluorescence spectra of Pacific Blue-labeled HSA (L = 1.5) in presence (—) and absence (– –) of large silver colloids. The excitation and observation conditions are the same as for small colloids (Figure 5).
Next, we measured one- and two-photon induced fluorescence spectra for large colloids coated with highly PB-labeled HSA (L = 7.5). For one-photon excitation we observed about 25% enhancement (Figure 7) and for two-photon excitation about 15-fold enhancement (Figure 8), which is roughly comparable to the enhancement observed for low labeling (Figure 6). From our previous results on silvered surfaces, we know that the RDE effect can release the self-quenching,28,29 which results in significantly stronger enhancement for a highly labeled system, compared to the low-labeled sample. Our present data show that the RDE effect plays a moderate role in fluorescence enhancement in silver colloidal solutions. The observed increase in brightness is mainly due to enhanced local field near the silver particles. This effect is much stronger in the case of two-photon excitation.
FIGURE 7.
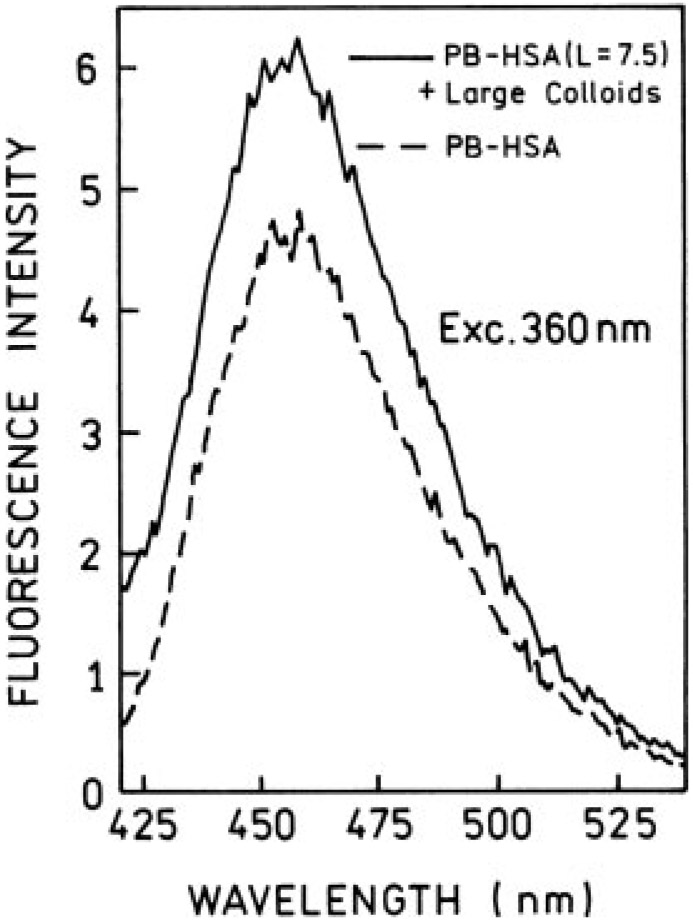
Emission spectra of Pacific Blue-labeled HSA (L = 7.5) in the presence (—) and absence (– –) of large colloids obtained with one-photon excitation. The conditions are the same as described in Figures 3 and 4. The backgrounds have been subtracted from the spectra.
FIGURE 8.
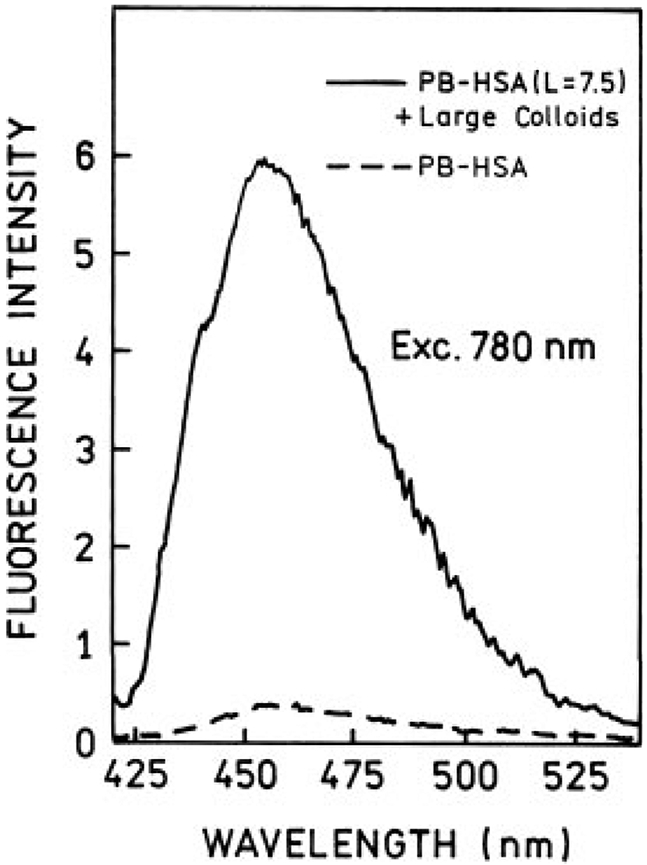
Two-photon induced fluorescence spectra of Pacific Blue-labeled HSA (L = 7.5) in the presence (—) and absence (– –) of large silver colloids. The conditions are the same as described in Figures 5 and 6. The backgrounds have been subtracted from the spectra.
CONCLUSIONS
There is a clear need for systems with enhanced fluorescence emission of probes, especially in ares such as cellular imaging, angiography, or fluorescence-based sensing.
We believe that more than a one order of magnitude increase in the fluorescence brightness will enable many two-photon imaging measurements, which previously were undetectable. Also, the significant enhancements observed in the 10 μm cuvette promises the application of stained colloids in visualization of small vessels and capillaries, which is important in angiography and coronography.
In this article we compared the enhancements achieved with small and large colloids. Large colloids, between 160–180 nmin size, were found to result in stronger enhancements.
The origin of fluorescence enhancement with two-photon excitation is an enhanced local field rather than an RDE effect. If the RDE effect would play a significant role in the brightness increase, the enhancement should not depend on the mode of excitation; it should be similar for one- and two-photon excitation. Also, similar fluorescence enhancements observed for low- and high-labeled probes indicate a lack of RDE effect.
Acknowledgments
This research was supported by a grant from NIH, NIBIB, EB001690, and NCRR, RR-08119. ZG thanks Philip Morris USA, Inc., for financial support.
Contract grant sponsor: NIH, NIBIB, and NCRR; contract grant number: EB001690 (NIH, NIBIB) and RR-08119 (NCRR).
REFERENCES
- 1.Drexhage KH J Luminescence 1970, 12, 693–701. [Google Scholar]
- 2.Drexhage KH Progress in Optics XII; Wolf E, Ed.; North Holland: Amsterdam: 1974; 165 pp. [Google Scholar]
- 3.Ford GW; Weber WH Surface Sci 1981, 109, 541–481. [Google Scholar]
- 4.Korzeniowski GE; Maniv T; Metiu H J Chem Phys 1982, 76(3), 1564–1573. [Google Scholar]
- 5.Lakowicz JR; Shen Y; D’Auria S; Malicka J; Fang J; Gryczynski Z; Gryczynski I Anal Biochem 2002, 301, 261–277. [DOI] [PMC free article] [PubMed] [Google Scholar]
- 6.Malicka J; Gryczynski I; Fang J; Lakowicz JR Anal Biochem 2003, 317, 136–146. [DOI] [PMC free article] [PubMed] [Google Scholar]
- 7.Kummerlen J; Leitner A; Brunner H; Aussenegg FR; Wokaun A Mol Phys 1993, 80(5), 1031–1046. [Google Scholar]
- 8.De Saja-Gonzalez J; Aroca R; Nagao Y; De Saja JA Spectrochim Acta Part A 1997, 53, 173–181. [Google Scholar]
- 9.Tarcha PJ; De Saja-Gonzalez J; Rodriguez-Llorente S; Aroca R Appl Spectrosc 1999, 53(1), 43–48. [Google Scholar]
- 10.Sokolov K; Chumanov G; Cotton TM Anal Chem 1998, 70, 3898–3905. [DOI] [PubMed] [Google Scholar]
- 11.Geddes CD; Cao H; Gryczynski I; Gryczynski Z; Fang J; Lakowicz JR J Phys Chem A 2003, 107, 3443–3449. [DOI] [PMC free article] [PubMed] [Google Scholar]
- 12.Parfenov A; Gryczynski I; Malicka J; Geddes CD; Lakowicz JR J Phys Chem B 2003, 107, 8829–8833. [DOI] [PMC free article] [PubMed] [Google Scholar]
- 13.Malicka J; Gryczynski I; Gryczynski Z; Lakowicz JR Anal Biochem 2003, 315, 57–66. [DOI] [PMC free article] [PubMed] [Google Scholar]
- 14.Geddes CD; Parfenov A; Roll D; Gryczynski I; Malicka J; Lakowicz JR J Fluoresc 2003, 13, 267–276. [DOI] [PMC free article] [PubMed] [Google Scholar]
- 15.Ford GW; Weber WH Phys Reports 1984, 113(4), 195–287. [Google Scholar]
- 16.Metiu H Surface Sci 1984, 17, 153–320. [Google Scholar]
- 17.Lakowicz JR Anal Biochem 2001, 298, 1–24. [DOI] [PMC free article] [PubMed] [Google Scholar]
- 18.Cnossen G; Drabe KE; Wiersma DA J Chem Phys 1993, 98(7), 5276–5280. [Google Scholar]
- 19.Malicka J; Gryczynski I; Lakowicz JR Biochem Biophys Res Commun 2003, 306, 213–218. [DOI] [PMC free article] [PubMed] [Google Scholar]
- 20.Matveeva E; Gryczynski Z; Malicka J; Gryczynski Z; Lakowicz JR Anal Biochem 2004, 334, 303–311. [DOI] [PMC free article] [PubMed] [Google Scholar]
- 21.Zhang J; Malicka J; Gryczynski I; Lakowicz JR Anal Biochem 2004, 330, 81–86. [DOI] [PMC free article] [PubMed] [Google Scholar]
- 22.Aslan K; Lakowicz JR; Szmacinski H; Geddes CD J Fluoresc 2004, 14(6), 677–679. [DOI] [PMC free article] [PubMed] [Google Scholar]
- 23.Maliwal BP; Malicka J; Gryczynski I; Gryczynski Z; Lakowicz JR Biopolymers 2003, 70, 585–594. [DOI] [PMC free article] [PubMed] [Google Scholar]
- 24.Gryczynski I; Malicka J; Shen Y; Gryczynski Z; Lakowicz JR J Phys Chem B 2002, 106, 2191–2195. [DOI] [PMC free article] [PubMed] [Google Scholar]
- 25.Castellano FN; Malak H; Gryczynski I; Lakowicz JR Inorg Chem 1997, 36(24), 5548–5551. [DOI] [PMC free article] [PubMed] [Google Scholar]
- 26.Malak H; Castellano FN; Gryczynski I; Lakowicz JR Biophys Chem 1997, 67, 35–41. [DOI] [PubMed] [Google Scholar]
- 27.Yguerabide J; Yguerabide EE Anal Biochem 1998, 262, 137–156. [DOI] [PubMed] [Google Scholar]
- 28.Lakowicz JR; Malicka J; D’Auria S; Gryczynski I Ana Biochem 2003, 320, 13–20. [DOI] [PMC free article] [PubMed] [Google Scholar]
- 29.Lakowicz JR; Malicka J; Huang J; Gryczynski Z; Gryczynski I Biopolymers 2004, 74(6), 467–475. [DOI] [PMC free article] [PubMed] [Google Scholar]