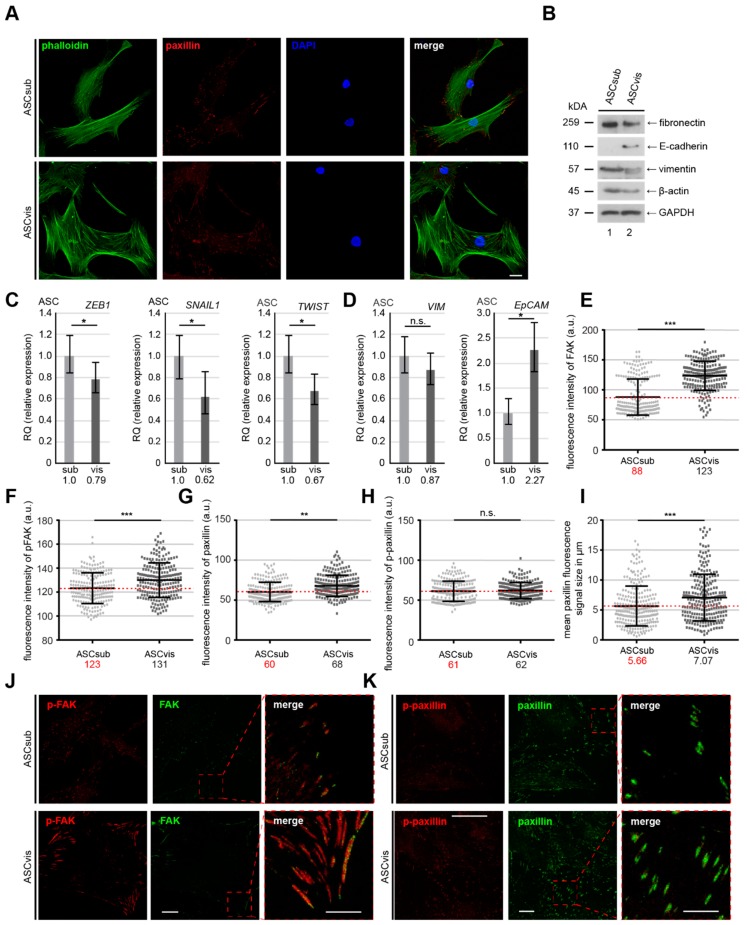
Figure 3.
Subcutaneous ASCs show a typical mesenchymal-like phenotype compared to their visceral counterparts. (A) Immunofluorescence staining of ASCsub and ASCvis. ASCs were stained for phalloidin (green), paxillin (red) and DNA (blue) to underline their cell morphology. Examples are shown. Scale: 25 μm. (B) Cellular extracts from ASCs were prepared for Western blot analyses with antibodies against β-actin, E-cadherin, fibronectin and vimentin. Glyceraldehyde-3-phosphate dehydrogenase (GAPDH) served as loading control. (C,D) Gene levels of mesenchymal associated transcription factors and cytoskeleton proteins ZEB1, SNAIL, TWIST, VIM, and EpCAM are shown for subcutaneous and visceral ASCs. The results are from three experiments, presented as RQ with minimum and maximum range. RQ, relative quantification of gene expression. Student’s t test, ∗ p < 0.05. (E–K) The focal adhesion composition was analyzed by staining ASCs for focal adhesion kinase (FAK) (green), p-FAK (red), and DNA (DAPI, blue), or for p-paxillin (red), paxillin (green) and DNA (DAPI, blue) for fluorescence microscopy. Quantification of the mean fluorescence intensity of FAK (E), p-FAK (F), paxillin (G) p-paxillin (H), and focal adhesion area (I) in ASCsub versus ASCvis (at least 200 FAs per staining). The results are based on three independent experiments and presented as scatter plot showing mean ± SEM. Unpaired Mann–Whitney U-test, ** p < 0.01, *** p < 0.001. a.u., arbitrary units. Representatives are depicted (J,K). Scale: 25 μm.

