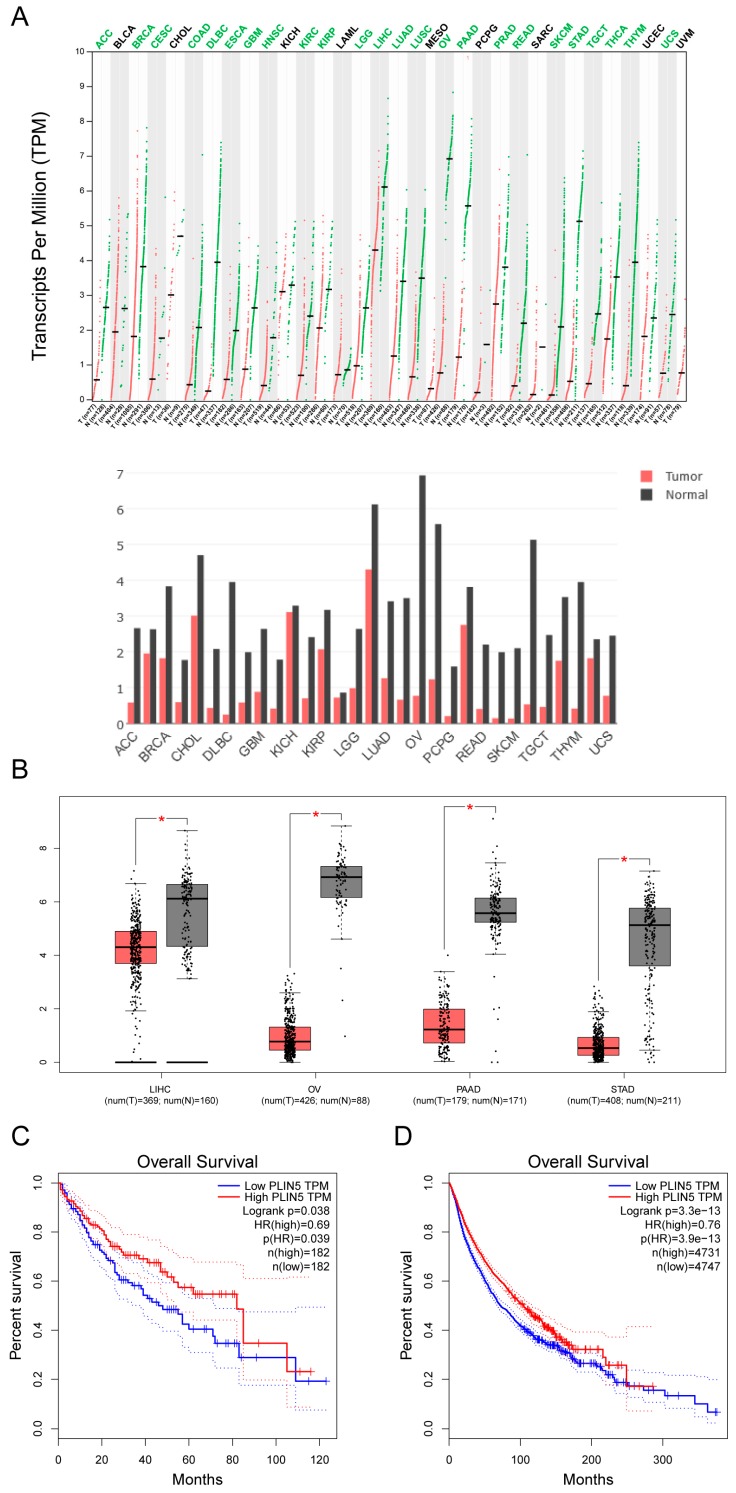
Figure 7.
Low expression of PLIN5 is associated with poor prognosis. Gene expression analysis and survival analysis were performed using the GEPIA database (http://gepia.cancer-pku.cn/). (A) Gene expression analysis of PLIN5 by cancer type. The lower pattern is the histogram illustration of the upper pattern. (B) The expression levels of PLIN5 in samples with LIHC, OV, PAAD, STAD, and corresponding controls, respectively. (C) Survival analysis of PLIN5 in LIHCtumor samples. (D) Survival analysis of PLIN5 in different kinds of tumor samples including ACC, BLCA, BRCA, CESC, CHOL, COAD, DLBC, ESCA, GBM, HNSC, KICH, KIRC, KIRP, LAML, LGG, LICH, LUAD, LUSC, OV, PPAD, READ, SARC, SKCM, STAD, TGCT, THCA, THYM, UCEC and UCS; E, CESC, DLBC, HNSC, LIHC, LUSC, PPAD and THYM; F, ACC, BLCA, BRCA, CESC, CHOL, COAD, DLBC, ESCA, GBM, HNSC, KICH, KIRC, KIRP, LAML, LGG, LICH, LUAD, LUSC, OV, PPAD, READ, SARC, SKCM, STAD, TGCT, THCA, THYM, UCEC, and UCS. The extension of tumor abbreviations can be referred to in the GEPIA database. * p < 0.05.

