

SUMMARY
Interferon-gamma (IFNG) augments immune function yet promotes T cell exhaustion through PDL1. How these opposing effects are integrated to impact immune checkpoint blockade (ICB) is unclear. We show that while inhibiting tumor IFNG signaling decreases interferon-stimulated genes (ISGs) in cancer cells, it increases ISGs in immune cells by enhancing IFNG produced by exhausted T cells (TEX). In tumors with favorable antigenicity, these TEX mediate rejection. In tumors with neoantigen or MHC-I loss, TEX instead utilize IFNG to drive maturation of innate immune cells, including a PD1+TRAIL+ ILC1 population. By disabling an inhibitory circuit impacting PD1 and TRAIL, blocking tumor IFNG signaling promotes innate immune killing. Thus, interferon signaling in cancer cells and immune cells oppose each other to establish a regulatory relationship that limits both adaptive and innate immune killing. In melanoma and lung cancer patients, perturbation of this relationship is associated with ICB response independent of tumor mutational burden.
Graphical Abstract:
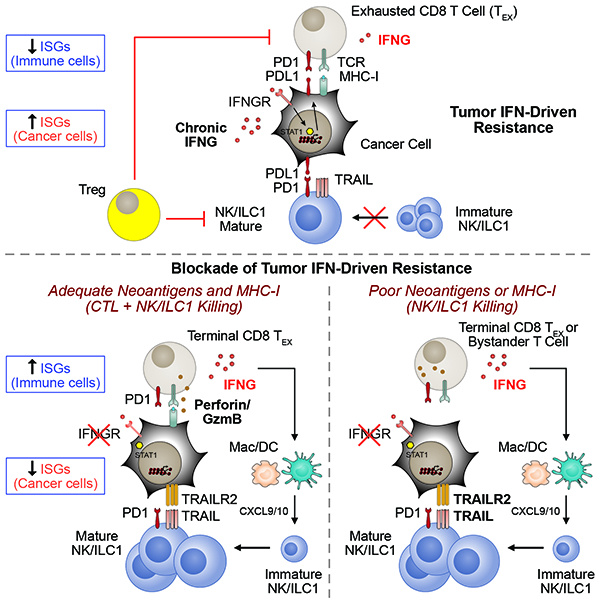
The opposing effects of interferon-gamma in terms of regulating immune function but also driving T cell exhaustion through PDL1 is explained by its differential effects in tumor and immune cell populations.
INTRODUCTION
Immune checkpoint blockade (ICB) of the inhibitory receptors CTLA4 and PD1 can result in durable responses in multiple cancer types (Ribas and Wolchok, 2018). Resistance and relapse are common and can be influenced by factors inherent to immune cells, cancer cells, or both (Patel and Minn, 2018). Important immune features include the status of T cell infiltration and the differentiation or activation state of T cells and innate immune cells. Features intrinsic to cancer cells that can impact ICB outcome include their repertoire of neoantigens, the ability to present antigens on major histocompatibility complex class one (MHC-I), and the expression of inhibitory receptor ligands. The clinical relevance of these immune and cancer cell factors is highlighted by common biomarkers for ICB response such as type I or II interferon (IFN) stimulated genes (ISGs) (Ayers et al., 2017; Harlin et al., 2009), tumor mutational burden (TMB) (Rizvi et al., 2015; Snyder et al., 2014), and expression of PDL1 (Taube et al., 2012; Tumeh et al., 2014).
Both IFN-gamma (IFNG) and type I IFN (IFN-I) are among the known pathways that have critical roles in anti-tumor immunity. IFN enhances immune function by inducing expression of MHC-I (Dighe et al., 1994), which is constitutively expressed on many tissues including cancer cells, and by enabling dendritic cells (DCs) to cross prime T cells (Diamond et al., 2011; Fuertes et al., 2011). In this way, IFNs are important in the early phase of antigen recognition and the interaction between adaptive and innate immune cells. Accordingly, loss-of-function mutations and genomic alterations in the IFN signaling pathway have been associated with clinical ICB resistance and/or relapse (Gao et al., 2016; Shin et al., 2017; Zaretsky et al., 2016), and unbiased genetic screens have identified this same pathway as being important for immunotherapy response in certain mouse models (Manguso et al., 2017; Mezzadra et al., 2017). In contrast, some patients have tumors with mutations in the IFN pathway that nonetheless respond to ICB (Hellmann et al., 2018; Sade-Feldman et al., 2017) or have high serum levels of IFNG that associates with ICB progression (Huang et al., 2017). These apparently “paradoxical” observations may represent feedback inhibition properties of IFN signaling (Snell et al., 2017). In the context of chronic pathogen infection, persistent IFN signaling and ISGs dampen immune responses to prevent immune-mediated pathology while allowing for a host-pathogen stalemate (Cheng et al., 2017; Teijaro et al., 2013; Wilson et al., 2013). In cancer, this dichotomous function of IFN is exploited through chronic signaling by tumor cells that can promote resistance to ICB (Benci et al., 2016). IFN-driven resistance can be inhibited by genetic ablation of the IFNG receptor (IFNGR) and/or IFN-I receptor (IFNAR) in cancer cells, resulting in a decrease in PDL1, other inhibitory ligands, and the GzmB antagonist SERPINB9 (Jiang et al., 2018). Expansion of exhausted T cells (TEX) can then ensue to restore ICB response through unknown mechanisms. Together, these observations highlight the importance of understanding how the opposing functions of IFN signaling impact cancer immunotherapy.
Loss of the beta-2 microglobulin (B2M) subunit of MHC-I appears to be a common resistance mechanism to ICB (Sade-Feldman et al., 2017). However, diminished expression or loss of B2M can also occur in patients who respond to ICB (Rizvi et al., 2018; Rodig et al., 2018), suggesting that innate immune cells might contribute to ICB response in some cases. Indeed, conventional NK cells and innate lymphoid cells (ILCs) are capable of destroying cancers through either perforin-mediated cytotoxicity or TNF-family death receptors such as TRAIL (Spits et al., 2016). NK/ILC effector function is regulated through cellular maturation, combinations of activating and inhibitory receptors, and possibly immune checkpoint receptors like PD-1, TIM3, and TIGIT (Gao et al., 2017; Zhang et al., 2018). Recent evidence indicates that type one ILCs (ILC1s) can participate in anti-tumor immunity or cancer immune surveillance. This includes ILC1-like populations (Dadi et al., 2016) and intratumoral ILC1s that are generally poorly cytotoxic (Cortez et al., 2017; Gao et al., 2017). Although the ability of NK/ILC1s to eradicate tumors with diminished MHC-I and/or a poor neoantigens is of significant interest, how to mobilize these innate immune cells to facilitate tumor response is unclear.
RESULTS
ISGs expressed by cancer cells predict resistance to immune checkpoint blockade while ISGs expressed by immune cells predict response
A large proportion of human cancers differentially express a subset of ISGs that can predict resistance to radiation and chemotherapy (Weichselbaum et al., 2008). Coincidentally, this ISG resistance signature (ISG.RS) is also associated with resistance to ICB, as demonstrated by elevated expression in ICB-resistant melanoma tumors from Res 499 cells (Figure 1A), which were derived from a B16-F10 tumor (Twyman-Saint Victor et al., 2015). In contrast, ISGs can also predict clinical ICB response, especially ISGs typically associated with IFNG signaling (Ayers et al., 2017). To begin reconciling these seemingly disparate observations, we examined the ISG.RS and genes from the IFNG hallmark gene set (IFNG.GS) by dividing them into two non-overlapping subsets (Figure 1B and Table S1) and creating a metagene (the average scaled expression of all genes in the set). The expression of these ISG metagenes was then examined across different cellular populations in human melanomas using previously published single-cell RNA-seq data (Tirosh et al., 2016). This revealed that the IFNG.GS is predominantly expressed by intratumoral immune cells such as T cells, NK cells, and macrophages (Figure 1B and S1A). In contrast, the ISG.RS is predominantly expressed in cancer cells, albeit with variable expression.
Figure 1. Distinct ISGs are differentially expressed in cancer and immune cells and have opposing functions in predicting clinical ICB response.

A) Gene set enrichment analysis (GSEA) of resistance-associated ISGs (ISG.RS) in Res 499 cells compared to parental B16 cells, both sorted from in vivo tumors. Heatmap (red is high expression, blue is low) and enrichment plot is shown along with the normalized enrichment score (NES) and p-value. B) Venn diagram of genes in the ISG.RS along with hallmark IFNG-related genes (IFNG.GS) partitioned into non-overlapping gene sets (color-coded) and used to create individual metagenes. Cell types from scRNA-seq data of pooled human melanoma tumors are shown in the tSNE plot along with expression of the ISG metagenes. C) Genomic and clinical features associated with anti-PD1 response in melanoma patients. Shown are tumor mutational burden (TMB), prior treatment with ipilimumab (Ipi), relative frequency of CD8 T cells and activated NK cells (activated minus resting) inferred by CIBERSORT, and bulk tumor expression of the ISG metagenes. D) Proportion of activated NK cells vs. CD8 T cells stratified by low/high IFNG.GS and ISG.RS expression. Regression line (orange), Pearson correlation and p-value, and percent CD8 T cells in each quadrant are shown. E) Odds ratio and 95% confidence intervals from a multivariable model for clinical anti-PD1 response. F) Expression of each metagene (left plot), and the predicted probability of anti-PD1 response (right plot) from a model using TMB and the ratio of IFNG.GS over ISG.RS (dISG). Odds ratios are shown in the inset. Circle color indicates response and size indicates TMB. G) Summary of cancer and immune cell relationships inferred by statistical modeling and how ISGs impact probability of ICB response. H) GSEA for ISG.RS genes after KO of the indicated IFN receptor in Res 499 tumors. See also Figure S1.
To understand the potential consequences of these differences in IFNG.GS and ISG.RS expression patterns, we analyzed bulk RNA-seq data combined from two cohorts of melanoma patients treated with anti-PD1 (Figure 1C) (Hugo et al., 2016; Riaz et al., 2017). As expected, the majority of genes in the IFNG.GS are depressed in the majority of tumors from nonresponders to anti-PD1 (Figure S1B). However, like ICB-resistant murine Res 499 tumors, most ISG.RS genes are enriched in tumors from non-responders (Figure S1B). Consistent with the importance of CD8 T cells in response, tumors with high IFNG.GS but low ISG.RS also have the greatest proportion of CD8 T cells (Figure 1D, top right quadrant) as inferred by CIBERSORT (Newman et al., 2015) (Figure S1C). The higher frequencies of CD8 T cells are accompanied by increased number of activated NK cells (Figure 1D, orange regression line), which also has been associated with clinical ICB response (Riaz et al., 2017). To understand how these immune and interferon-related variables independently contribute to ICB response, we utilized a multivariable logistic regression model. This revealed that while higher IFNG.GS increases the odds ratio for response, ISG.RS independently decreases the likelihood (Figure 1E). The significance of both of these variables are independent of tumor mutational burden (TMB) status, which expectedly correlates with response. In contrast, neither the abundance of CD8 T cells nor NK cells are significant in the model. A random forest model, which does not assume linearity and incorporates interaction effects, revealed that ISG.RS exhibits a higher importance score than either IFNG.GS or TMB (Figure S1D). In total, these data suggest that while expression of IFNG.GS by immune cells is associated with CD8 T cell abundance, accumulation of activated NK cells, and ICB response, all of these effects are opposed by high levels of ISG.RS in cancer cells.
Although the IFNG.GS and ISG.RS predict opposite clinical outcomes, their expression is positively correlated, consistent with IFN controlling both metagenes (Figure 1F). An explanation for this apparent “paradox” lies in the relative expression of each metagene. When expression of the ISG.RS exceeds the IFNG.GS, resistance is favored (Figure 1F, left plot, red circles below diagonal). In contrast, most responses occur when IFNG.GS is similar to or greater than ISG.RS (Figure 1F, blue circles). Based on these findings, we combined the two metagenes into a ratio of IFNG.GS over ISG.RS (or, the difference of these two metagenes in log transformed space). By logistic regression, this composite variable (dISG) is strongly associated with response and is independent of TMB (Figure 1F, right plot and inset). Specifically, the probability of response is low when either the ratio or TMB is low but increases when either increase. Furthermore, random forest machine learning and bootstrapping revealed that the ISG ratio has the highest robustness and average variable importance compared to TMB and multiple immune features (Figure S1E).
In total, the single-cell and bulk RNA-seq analysis suggests that distinct ISGs differentially expressed by cancer and immune cells can oppose each other to influence CD8 T cell infiltrate and NK activation, and can be combined into a ratio that predicts ICB response independent of TMB (Figure 1G). Motivated by these findings, we sought to understand the mechanistic underpinnings inferred by these statistical relationships.
Models differing in MHC-I, TMB, and neoantigen status for examining the effect of blocking tumor IFN signaling on ICB response
If the probability of ICB response is influenced by the ratio of IFNG-related ISGs expressed by immune cells over inhibitory ISGs expressed by cancer cells, one way to enhance the ratio in favor of response is to prevent IFN signaling in cancer cells. We first confirmed whether the ISG.RS, which is elevated in ICB-resistant Res 499 tumors, is regulated by IFN signaling in cancer cells (hereafter referred to as tumor IFN signaling). Indeed, CRISPR knockout of IFNGR and/or IFNAR significantly diminishes ISG.RS levels (Figure 1H). However, loss of tumor IFN signaling can render cancers less responsive to immunotherapy due to compromised MHC-I and antigen processing (Manguso et al., 2017; Zaretsky et al., 2016), suggesting that the impact from ablating tumor IFN signaling might be context dependent. In light of this, we surmised two situations whereby the benefit of inhibiting IFN-driven resistance could outweigh the potential negative impact on MHC-I. The first is when constitutive MHC-I is high, minimizing effects that loss of IFN-inducible MHC-I has on CTL-mediated killing. A second situation is when tumors have depleted or poor neoantigens. Here, diminished CTL recognition presumably makes MHC-I status less consequential for T cell-mediating killing, but interference with IFN-driven resistance might improve killing by NK or other innate lymphoid cells.
We first characterized various mouse tumor models for differences in MHC-I expression, TMB, and predicted neoantigen status (Figure 2A). Of these, CT26 colorectal cancer has the highest TMB (Figure 2B) and maintains high MHC-I in the absence of IFNG signaling (Figure 2C–D). Similarly, TSA-derived Res 237 breast cancer cells also have high IFNG-independent baseline MHC-I but exhibit lower TMB (Figure 2B–C and S2A). In contrast, B16 and/or Res 499 melanoma have intermediate TMB, low constitutive MHC-I, and relies on IFNG for high MHC-I expression (Figure 2B–D and S2B). Since Res 499 originated from an abscopal B16 tumor that relapsed several weeks after radiation (RT) plus anti-CTLA4 (Twyman-Saint Victor et al., 2015), we surmised that Res 499 may additionally have undergone immunoediting prior to relapse. Recent evidence suggests that neoantigens that have clonal or near-clonal representation are predominantly targeted by the immune system, while neoantigens at low clonal fractions can remain immunologically silent (Gejman et al., 2018; McGranahan et al., 2016). In accord with this notion, there is a significant decrease in the cumulative frequency of predicted high affinity (<100 nM) neoantigens with clonal (near-heterozygous or greater) frequencies in Res 499 compared to B16 (Figure 2E, leftward shift orange curve). In particular, a cluster of predicted neoantigens (cluster 6, Figure 2F) are present at clonal frequencies in B16 but fall to subclonal or near-zero frequencies in Res 499 tumors (Figure 2F, lower right quadrant). This cluster of neoantigens is predicted to reside in a subpopulation of cells (subclone 3, Figure 2G) that is nearly eliminated in Res 499 compared to B16, consistent with immunoediting. In contrast, the subpopulation with the largest reciprocal increase in Res 499 (subclone 4) is characterized by a mutation cluster (cluster 7) with low clonal frequencies (Figure 2F, lower left quadrant), as expected for resistant subclones. Together, these data define several tumor models that differ in reliance on IFNG for high MHC-I and in predicted neoantigen availability.
Figure 2. Mouse models differing in MHC-I, tumor mutational burden, and predicted neoantigen status.

A) Summary of key properties of mouse tumor models. N.D. is not determined. B) TMB for each of the indicated cell lines. The proportion of predicted neoantigens (MHC-I affinity ≤ 500 nM) is shown. C) Constitutive (baseline) and D) IFNG-inducible (+IFNG) MHC-I on indicated tumor cells with or without IFNGR KO. E) Cumulative distribution function plot of the allelic frequencies for predicted high-affinity (≤ 100 nM) neoantigens. The p-value is determined by an empirical distribution of the KS statistic from random variants. F) Allelic frequency of predicted high-affinity neoantigens in B16 and Res 499 tumors. Values are transformed onto a log10 scale with a near-heterozygous value for a tetraploid genome indicated (dashed blue line). Circle size corresponds to neoantigen affinity. Circle color corresponds to neoantigen clusters predicted to be evolutionarily related and giving rise to G) subclonal populations (Subclone 1–4) inferred from high quality variants and displayed using a phylogenetic tree. Frequencies of these subclonal populations are shown. See also Figure S2.
Blocking tumor IFN signaling broadly improves ICB response through CD8 T and innate immune cells
We first used the CT26 model to examine whether tumors with high constitutive MHC-I and TMB demonstrate improved response when ISG.RS is decreased by blocking tumor IFN signaling. Remarkably, when IFNGR or both IFNGR and IFNAR are ablated, mice either show markedly slower tumor growth or spontaneous regression that is CD8 T cell dependent (Figure 3A), as determined by antibody-mediated depletion (Figure S3A). The addition of anti-PD1 further improves anti-tumor effects and survival. Both spontaneous regression and durable response to anti-PD1 requires B2M and hence MHC-I. All mice with complete response are also resistant to tumor rechallenge (8 out of 8 mice), further indicative of a T cell dominant response. Thus, decreasing ISG.RS by preventing IFN signaling in tumors with high baseline MHC-I does not interfere with CTL-mediating killing and markedly enhances immunogenicity.
Figure 3. Preventing tumor IFN signaling promotes CD8 T cell-dependent and/or NK/ILC1-dependent ICB response.

A) Survival of mice bearing CT26 tumors with KO of IFNGR +/− B2M or of both IFNGR and IFNAR (IFNA/GR) after no treatment (Cont), CD8 depletion (aCD8), or anti-PD1 (aPD1). For each group, n=5–15. B) Survival (top) and tumor volumes (bottom) after treatment with RT + anti-CTLA4 or control (Cont) for mice bearing B16 or Res 499 tumors with the indicated KO. Unless indicated, displayed p-values are for comparisons within each genotype (legend). For tumor volumes, only groups of interest are shown. Groups with no depletion: WT, n=20–28; IFNA/GR KO, n=10–20; IFNA/GR + B2M KO, n=4–5. For aNK1.1 groups, n=5. C) Tumor volumes for B16 and Res 499 tumors expressing human CD19 (hCD19) with or without IFNA/GR KO after a single infusion with primary murine T cells transduced with a CAR (CART) against hCD19. D) Survival of mice bearing IFNGR KO Res 499 tumors with or without concurrent B2M KO after treatment with anti-CTLA4. Effect of immune cell depletion with anti-CD8 or anti-NK1.1 is shown. IFNGR KO, n=5; B2M KO, n=5; IFNGR + B2M KO, n=10–20. E) Survival of wild type (WT) or Perforin KO (Prf1 KO) mice bearing IFNGR KO Res 499 tumors after anti-CTLA4. aCTLA4, n=7–10; Cont, n=2–4. See also Figure S3.
Unlike CT26, B16 cells are reliant on IFN for high MHC-I expression (Figure S2B). B16 tumors respond poorly to anti-PD1 but respond to RT + anti-CTLA4, a combination that enhances T cell repertoire diversity and improves response over anti-CTLA4 alone (Twyman-Saint Victor et al., 2015). Surprisingly, knockout of IFNGR and IFNAR in B16 tumors does not negatively impact the efficacy of RT + anti-CTLA4 (Figure 3B, top left plots, red vs. orange), suggesting that other immune-mediated killing mechanisms may compensate for low MHC-I and compromised CTL recognition in this context. Indeed, partial response of IFNGR knockout tumors to RT + anti-CTLA4 is maintained even after B2M is ablated (Figure 3B, top left plots, grey vs. light blue). However, when B2M knockout is accompanied by depletion of NK1.1+ cells (Figure S3A), which are typically conventional NK cells and ILC1s, response is completely eliminated (Figure 3B, left top and bottom plots, grey vs red). In contrast to B16, Res 499 tumors are resistant to RT + anti-CTLA4 and have relative depletion of predicted neoantigens (Figures 2E–G). Despite this, knockout of IFNGR and IFNAR restores Res 499 response to levels at least as high as parental B16 tumors (Figure 3B, right plots). Consistent with loss of neoantigens and reliance on innate immune killing, co-ablation of B2M has no discernible effect while depletion of NK1.1+ cells alone abrogates the benefit from IFNGR + IFNAR knockout (Figure 3B, right top and bottom plots). However, if the requirement for high MHC-I and antigen is bypassed by using a murine chimeric antigen receptor (CAR) T cell against ectopically expressed human CD19 (Figure S3B), blocking tumor IFN signaling similarly improves response of both B16 and Res 499 tumors (Figure 3C). In the absence of CAR T cells, IFNGR + IFNAR knockout tumors grow similarly to control (Figure S3C). Thus, blocking tumor IFN signaling can impact both CD8 T cell and NK/ILC effector function.
In total, these data suggest that blocking tumor IFN signaling can improve T cell-mediated killing when antigen recognition is not limited by inhibiting IFN function, as in the case of CT26 tumors and use of CAR T cell therapy. In tumors with low MHC-I, preventing tumor IFN signaling may compromise CTL-mediated recognition but anti-tumor effects of NK/ILC1s can compensate to maintain response, as in the case of B16 tumors. In tumors such as Res 499 that are highly resistant and otherwise poorly recognized by T cells, the dispensability of MHC-I allows for restored response through NK/ILC-mediated killing.
Inhibition of tumor IFNG signaling enables CD8 T cells to support NK/ILC-mediated killing
To understand how blocking tumor IFN signaling restores ICB response in resistant or relapsed tumors and to avoid conflating effects of type I and II IFN, we focused on how IFNGR knockout restores response in the Res 499 model. We also opted to use anti-CTLA4 monotherapy given that addition of RT does not significantly improve response over anti-CTLA4 alone (Figure 3D vs. 3B). As expected for NK/ILC-mediating killing, IFNGR knockout improves response to anti-CTLA4 in the absence of B2M (Figure 3D and S3D). This requires NK1.1+ innate immune cells (Figure 3D and S3A), is perforin-independent (Figure 3E), and does not generate durable immunity against tumor rechallenge of mice with complete response (Figure S3E). To test if NK/ILC-mediated cytotoxicity may be responsible for response after IFNGR knockout, we co-cultured poly I:C stimulated splenic NK cells with Res 499 cells in vitro (Figure S3F). This resulted in NK-mediated cytotoxicity as measured by CD107a, which is used as a general marker for NK effector function (Ahlenstiel et al., 2010). IFNG treatment of wild type but not IFNGR knockout Res 499 cells prior to co-culture was sufficient to increase resistance even in the absence of B2M, consistent with tumor IFNG signaling impeding NK/ILC killing. Thus, like with inhibition of both type I and II IFN signaling, blocking tumor IFNG signaling can restore ICB response by enhancing NK/ILC-mediated effector function.
Surprisingly, although depletion of NK1.1+ cells abrogates ICB response of IFNGR knockout Res 499 tumors, depletion of CD8 T cells, but not CD4 T cells, also inhibits response (Figure 3D and S3G). A similar requirement for both CD8 T cells and NK/ILC1s is also observed after IFNGR knockout in the resistant TSA/237 breast cancer model that exhibits relatively low TMB and a paucity of predicted strong neoantigens (Figure 2B and S3H). These observations suggest that although CD8 T cells do not directly kill IFNGR knockout Res 499 tumors, they may have a supportive role.
Preventing tumor IFNG signaling enhances immune cell IFNG signaling, CD8 TEX function, and maturation of NK/ILC1 cells
To examine how CD8 T cells might support NK/ILC1s, we employed single-cell RNA-sequencing (scRNA-seq) and 28-color flow cytometry. Analysis of intratumoral CD45+ immune cells by scRNA-seq revealed that a dominant effect of tumor IFNGR knockout is an increase in the proportion of CD8 T cells (Figure 4A). Intratumoral CD8 T cells are typically exhausted and reside in either a progenitor exhausted or terminally exhausted population (Miller et al., 2019). Although terminally exhausted PD1+ CD8 T cells have limited long-term proliferative potential, they can carry out various effector functions such as cytotoxicity and IFNG production (Miller et al., 2019; Paley et al., 2012). Gene set enrichment analysis (GSEA) using transcriptional signatures of these exhausted subsets (defined using the LCMV infection model) revealed that the expanded CD8 T cells resulting from IFNGR knockout show a marked increase in terminal exhaustion genes (e.g., Pdcd1, Eomes, Cd38) and a decrease in progenitor exhaustion genes (e.g., Tcf7) (Figure 4B and S4A). Accordingly, there is a per cell increase in the amount of IFNG protein produced by PD1+ CD8 T cells (Figure S4B), and after anti-CTLA4 there is a large increase in IFNG per gram of tumor (Figure 4C), which is not but observed with cytokines such as IL-6 (Figure S4C). Depletion of CD8 T cells largely abrogates this intratumoral increase in IFNG, highlighting the importance of exhausted CD8 T cells in generating this cytokine. Accompanying the increase in IFNG is a marked increase in the IFNG.GS primarily from myeloid/DC populations (Figure 4D). Among various IFNG.GS genes that increase include Cxcl9 and Cxcl10 (Figure 4E), which are chemokines implicated in NK cell recruitment, activation, or maturation (Pak-Wittel et al., 2013). Thus, disrupting tumor IFNG signaling not only decreases the ISG.RS in cancer cells but also increases production of IFNG by terminally exhausted CD8 T cells. As an apparent consequence, myeloid/DC populations increase expression of IFNG.GS that include chemokines important in innate immune function.
Figure 4. Blockade of tumor IFNG signaling promotes CD8 TEX expansion, IFNG production, immune cell IFNG signaling, and maturation of NK and PD1+ TRAIL+ ILC1 cells.

CD45+ immune cells from Res 499 tumors with or without IFNGR KO were profiled by scRNA-seq. A) tSNE plot with identified immune populations (left) and corresponding density plots (right). The percent of CD8 T cells is 6.4% and 16.8% in wild type (WT) and IFNGR KO tumors, respectively. B) GSEA on CD8 T cell clusters using T cell terminal exhaustion and progenitor exhaustion gene sets. C) Intratumoral IFNG protein levels from wild type or IFNGR KO Res 499 tumors treated with or without anti-CTLA4. Effect of CD8 T cell depletion (aCD8) is also shown. D) Expression of IFNG.GS or E) average expression of Cxcl9 and Cxcl10 across intratumoral immune cells from wildtype or IFNGR KO tumors overlaid on the tSNE map shown in (A). F) NK1.1+ and NKp46+ NK cell clusters from (A) were re-clustered. Shown is a tSNE plot with identified NK and ILC1 populations (left) and corresponding density plots (right). G) Average expression of select NK/ILC1 genes for each of the indicated NK or ILC1 maturation stage. H) CD8 T cells and NK/ILC1 populations were identified by 28-color flow cytometry. Shown is ratio of PD1+ Eomes+ CD8 TEX that belong to Ki67+ GzmB+ clusters over total PD1+ Eomes+ CD8 TEX (left) or the proportion of CD11bhi NK and PD1+ TRAIL+ ILC1 cells relative to total NK/ILC1s (right). I) Density plots of NK/ILC1 clusters and expression of indicated markers overlaid onto a tSNE plot. Points are colored by scaled MFI and overlaid with a contour plot. Clusters 3, 9, 10, and 11 are CD11bhi NK cells, and cluster 4 is PD1+ TRAIL+ ILC1 cells. See also Figure S4.
In order to investigate how preventing IFNG signaling in tumor cells impacts NK/ILC1 status, we re-clustered NK/ILC1 populations identified by scRNA-seq (Figure 4F–G). This revealed NK populations differing in maturity and effector function (Chiossone et al., 2009), including an immature CD11blow population, an intermediate CD11bint population, and a mature CD11bhigh cluster that typically possesses the greatest effector function. Moreover, recently described ILC1 and intermediate ILC1 (intILC1) populations (Cortez et al., 2017; Gao et al., 2017) were also identified (Figure S4D). Knockout of tumor IFNGR results in a large shift in the NK populations toward the mature CD11bhigh cluster and an additional shift toward the ILC1 cluster (Figure 4F, density plots). These ILC1s exhibit relatively high levels of Pd1 (Pdcd1) and Trail (Tfnsf10) (Figure 4G), consistent with previously reported properties for this population. Using 28-color flow cytometry (Figure S4E–F), we confirmed that tumor IFNGR knockout leads to an increase in the proportion of NK/ILC1s that are CD11bhigh NK cells or PD1+ TRAIL+ ILC1s (Figure 4H–I and S4G). Flow cytometry also confirmed that this is accompanied by an increase in the proportion of terminally exhausted CD8 T cells, particularly after anti-CTLA4, as indicated by an increase in PD1+ Eomes+ CD8 T cells that express multiple inhibitory receptors and relatively high levels of Ki67 and GzmB (Figure 4H and S4G).
Together, these results indicate that preventing tumor IFNG signaling expands CD8 TEX toward terminal exhaustion and increased production of IFNG. In this way, disrupting tumor IFNGR not only decreases ISG.RS in cancer cells but conversely increases IFNG.GS expression by immune cells. This enhanced IFNG signaling in immune cells might then drive maturation and function of NK/ILC1 subsets, including a PD1+ TRAIL+ ILC1 population that potentially contributes to ICB response.
Preventing tumor IFNG signaling enables IFNG from CD8 TEX to drive NK/ILC1 function while removing inhibitory feedback from PD1/PDL1 and TRAIL/TRAILR2
Given the single-cell findings, we sought to investigate whether IFNG produced by CD8 TEX is involved in NK/ILC1-mediated killing and whether the PD1/PDL1 and TRAIL/TRAILR pathways, which are implicated due to their presence on intratumoral ILC1s, can contribute to response after IFNGR knockout. To test the role of IFNG produced by CD8 T cells, we adoptively transferred CD8 T cells from wild type or IFNG knockout mice into RAG-deficient hosts and then implanted the mice with Res 499 IFNGR knockout tumors (Figure 5A and S5A). This revealed that IFNG production by CD8 T cells is required for anti-CTLA4 response. Conversely, when CD8 T cells are depleted, there is a decrease in the proportion of mature CD11b+ NK/ILC1s (Figure S5B) as well as total NK/ILC1s (Figure 5B). However, direct intratumoral injection of IFNG or CXCL10 can rescue or partially rescue the loss in NK/ILC1 cells (Figure 5B). NK/ILC1-dependent ICB response (Figure 5C, blue boxplots) and survival (Figure S5C) that is also compromised after depleting CD8 T cells is similarly rescued by injection of IFNG. Thus, these results suggest NK/ILC1-dependent response resulting from blocking tumor IFNG signaling relies on IFNG produced by CD8 TEX and on downstream chemokines such as CXCL10.
Figure 5. NK/ILC1-mediated killing from blocking tumor IFNG signaling is regulated by IFNG produced by TEX, PD1/PDL1, and TRAIL/TRAILR2.

A) Wild type or IFNG-deficient CD8 T cells were adoptively transferred into Rag1−/− mice. Shown is survival after implantation of IFNGR KO Res 499 tumors and treatment with anti-CTLA4 (n=4–5). B) Mice bearing IFNGR KO Res 499 tumors were depleted of CD8 T cells followed by intratumoral injection of the indicated cytokine. Shown is the percentage of intratumoral CD8 T cells and NK/ILC1s. C) Response of IFNGR KO Res 499 tumors in CD8 T cell-depleted mice. Mice were treated with anti-CTLA4 with or without intratumoral injection of IFNG. Effect of concurrent depletion of NK/ILC1s with anti-NK1.1 is also shown as well as effect of high constitutive PDL1 on IFNGR KO tumors (red boxplots). Tumor volumes are relative to initial control tumor volume. D) Survival after anti-CTLA4 treatment of mice bearing Res 499 tumors with concurrent KO of PDL1 (n=5). The effect of anti-NK1.1 is shown. E) In vitro NK cell killing of Res 499 IFNGR KO tumor cells with or without constitutive ectopic PDL1 expression. Both CD49a+ PD1+ and CD49b+ PD1– populations were tested. Shown are relative proportions of CD107a+ NK cells. For each biological replicate, data are normalized to results from Res 499 IFNGR KO cells cultured with CD49a+ PD1+ NK cells. F) In vivo TRAILR2 and PDL1 expression on Res 499 tumors with or without IFNGR KO. G) Survival after anti-CTLA4 of mice bearing IFNGR KO Res 499 tumors with (n=14–15) or without (n=5) concurrent KO of TRAILR2. See also Figure S5.
Although IFNG has a critical role in promoting NK/ILC1 function, it also induces high levels of PDL1 on tumors. Given that PD1 is expressed on ILC1 cells, this suggests that the PD1/PDL1 axis may normally function as an IFNG-directed feedback inhibition mechanism to antagonize innate immune function, similar to its role in regulating T cell responses. If so, removal of this feedback inhibition by IFNGR knockout may contribute to the improved response resulting from blocking tumor IFNG signaling. To examine this, we ectopically expressed PDL1 in PDL1 knockout Res 499 tumors to make PDL1 levels independent of IFNG signaling (Figure S5D). In contrast to wild type or B2M-deficient Res 499 tumors, the ability of IFNGR deletion to improve anti-CTLA4 response is lost when PDL1 levels are fixed (Figure S5E). To remove effects of PD1 from CD8 T cells, we depleted CD8 T cells but restored NK/ILC1 function in IFNGR-deficient Res 499 tumors by intratumoral administration of IFNG (Figure 5C, red boxplots). Consistent with tumor PDL1 inhibiting NK/ILC1 killing, fixing high PDL1 expression despite IFNGR knockout blunted NK/ILC1-dependent ICB response. Conversely, improved anti-CTLA4 response resulting from PDL1 deletion requires NK/ILC1s (Figure 5D). The notion that PD1/PDL1 can directly inhibit NK/ILC1 killing was also corroborated by using CD49a+ PD1+ liver NK cells cultured with IFNGR-deficient Res 499 cells with and without ectopic PDL1 (Figure 5E and S5F). In total, these results suggest that tumor IFNG signaling normally drives feedback inhibition through tumor PDL1 to regulate NK/ILC1 function. Thus, ablating tumor IFNGR not only increases immune cell IFNG signaling but also enhances innate immune killing by interfering with the PD1/PDL1 inhibitory axis.
Besides PD1, intratumoral ILC1 cells also expresses TRAIL. Since response from tumor IFNGR knockout is independent of host perforin (Figure 3E), this suggests that tumor killing may utilize the TRAIL/TRAILR pathway. Indeed, Res 499 tumors not only express PDL1 but also the TRAIL receptor (TRAILR2). Unlike PDL1, TRAILR2 decreases in direct response to IFNG in vitro (Figure S5G). Accordingly, knockout of tumor IFNGR significantly increases TRAILR2 in vivo, while PDL1 decreases (Figure 5F). Deletion of TRAILR2 in IFNGR-deficient Res 499 tumors (Figure S5H) reveals that tumor killing after anti-CTLA4 is largely dependent on TRAIL/TRAILR2 interaction (Figure 5G). These data suggest that IFNG controls an inhibitory feedback mechanism for NK/ILC1s not only by increasing tumor PDL1 but also by decreasing TRAILR2. Thus, preventing tumor IFNG signaling enables TRAIL- and NK/ILC1-dependent killing.
Adaptive immune cell requirements for innate immune killing after blocking tumor IFNG signaling
Despite our findings that response after IFNGR knockout of Res 499 tumors requires IFNG produced by CD8 T cells, the dispensability of tumor MHC-I argues that antigen presentation by tumor cells is not necessary for CD8 TEX to support NK/ILC1 function. To corroborate this, we implanted Res 499 tumors deficient in both IFNGR and B2M in either wild type mice or OT-1 mice expressing a transgenic T cell receptor to OVA antigen, which is not expressed by Res 499 tumors (Figure 6A). The accumulation of both intratumoral CD8 T cells and NK/ILC1s is reduced and ICB response is lost in OT-1 mice compared to wild type mice (Figure 6B). However, intratumoral injection of OVA peptide rescued the compromised CD8 T cell frequency and partially restored NK/ILC1 levels. Moreover, despite the absence of tumor MHC-I, response to anti-CTLA4 was also partially rescued (Figure 6C). Thus, the ability of IFNGR knockout to enhance NK/ILC1-dependent ICB response need not depend on antigen presentation by tumor cells themselves. Rather, cross-primed and/or activated bystander T cells can suffice.
Figure 6. Activated bystander T cells support and Tregs inhibit NK/ILC1-dependent response after blocking tumor IFNG signaling.

A) OT-1 mice bearing Res 499 tumors with combined IFNGR and B2M KO were treated with anti-CTLA4 with or without intratumoral injection of OVA peptide. Wild type mice with or without CD8 T cell depletion were used as comparison. B) Tumor infiltration by CD8 T cells and NK/ILC1s and C) growth of Res 499 IFNGR + B2M KO tumors after anti-CTLA4 (95% confidence interval in grey). D) Proliferation status of Tregs and other intratumoral immune cells in control (WT) or Res 499 IFNGR KO tumors measured by average expression of Ki67 and Top2a. E) Tumor growth of Res 499 IFNGR KO tumors implanted into wild type or FoxP3-DTR mice treated with anti-CTLA4 or diptheria toxin (DT). F) Survival of mice bearing CT26 tumors with IFNGR +/− B2M KO after treatment with anti-PD1 or anti-CTLA4. For all groups, n=5. G) Top predictive features from a random forest model (and confirmed by lasso regression) for how the proportion of different intratumoral immune cells (x-axis) predicts the proportion of activated NK cells in human melanoma tumors (y-axis). Standard error is in yellow. See also Figure S6.
Although disrupting tumor IFNG signaling interferes with the inhibitory effects of PD1/PDL1 between tumor cells and both adaptive and innate immune cells, anti-CTLA4 appears to provide a non-redundant function to PD1/PDL1 inhibition. In mouse models, and possibly in humans, antagonistic CTLA4 antibodies not only block CTLA4 but can also deplete CD4+ T regulatory cells (Tregs) (Arce Vargas et al., 2018; Romano et al., 2015; Simpson et al., 2013). Indeed, Tregs are among the most proliferative immune cells in Res 499 tumors and this does not appear altered by tumor IFNGR knockout (Figure 6D). To investigate the importance of inhibiting Tregs, we used the 4F10 antibody against CTLA4 that does not concurrently deplete Tregs (Simpson et al., 2013). In contrast to the Treg-depleting 9H10 antibody, 4F10 fails to elicit a response against Res 499 IFNGR knockout tumors (Figure S6A). Conversely, depleting Tregs by stimulation of the diptheria toxin receptor under control of Foxp3 recapitulates the effects of 9H10 on IFNGR-deficient Res 499 tumors (Figure 6E). The non-redundant effect of a Treg-depleting antibody with tumor IFNGR knockout is also highlighted in the CT26 tumor model. Here, although IFNGR knockout results in complete responses to anti-PD1, all mice relapse when B2M is ablated (Figure 6F and S6B). However, the 9H10 anti-CTLA4 antibody results in complete response despite B2M loss, consistent with the anti-CTLA4 but not anti-PD1 antibody allowing for more optimal NK/ILC1-mediated killing. Corroborating the potential role of Tregs in suppressing innate immune cell activity, abundance of activated NK cells inversely associates with Treg abundance in melanoma patients (Figure 6G). Thus, interfering with the suppressive effects of Tregs may be required to fully unleash both adaptive and innate immune killing resulting from blocking tumor IFNG signaling. These findings imply that dual therapy with anti-PD1 plus anti-CTLA4 antibodies that inhibit Tregs may promote innate immune function better than monotherapy approaches.
Tumor mutations in IFN pathway genes predict clinical response to dual blockade of PD1 and CTLA4
Our findings suggest that mutations predicted to reduce tumor IFN signaling might associate with decreased ISG.RS and improved clinical response to ICB. To investigate this, we extended the analysis of recently described exome-sequencing data of non-small cell lung cancer (NSCLC) patients from either TCGA or a clinical trial using anti-PD1 plus anti-CTLA4 (Hellmann et al., 2018). After excluding common non-disease single-nucleotide variants, pathogenic missense and nonsense mutations were predicted using two algorithms, CADD and DANN, that were trained on a catalog of benign and pathogenic variants from the ClinVar database (Figure S7A; see Methods). Indels were also evaluated as damaging or neutral using SIFT. In the TCGA, there is an 8.6% incidence of patient tumors with at least one predicted pathogenic variant in a core set of 11 type I and II IFN pathway genes (Figure S7B–C). These tumors exhibit a decrease in ISG.RS genes, consistent with an enrichment for IFN pathway variants with defective signaling (Figure 7A and S7D). In the patients treated with anti-PD1 plus anti-CTLA4, 14.7% of patients have at least one IFN pathway variant and these patients have improved progression-free survival (PFS) with dual ICB (Figure 7B–C). In contrast, only 0.58% of random gene sets of similar size yield PFS differences that are as significant (Figure S7E), and IFN pathway variants do not associate with survival in TCGA patients (Figure S7F), arguing that variant status is not a general prognostic marker. Although the presence of IFN pathway variants is associated with higher TMB (Figure S7G), multivariable logistic regression and random forest reveal that variant status predicts ICB response independently of TMB and PDL1 expression (Figure 7D and S7H). Both models yield predicted probabilities of response (CR or PR) that correlate well to actual observed responses (Figure 7E, top panel; Figure S7H, right plot). Notably, despite a higher likelihood of response, variant-positive tumors exhibit lower percent tumor PDL1 expression (5.4% versus 20.3%; Figure 7F), consistent with variants having a negative impact on tumor IFN signaling. In contrast, stratification by variant status of random genes rarely yields a difference in %PDL1 this large (frequency 5.7 × 10⁻³) (Figure S7I). Notably, one patient had a tumor with multiple alleles of B2M with a frameshift indel or predicted pathogenic missense mutations who nonetheless had a PR to ICB (Figure 7E, patient 40). This is consistent with previous reports describing a NSCLC patient responding to anti-PD1 despite deleterious B2M mutations and loss of B2M expression confirmed by immunohistochemistry (Rizvi et al., 2018). Thus, genetic alterations of the IFN pathway in human NSCLC are associated with decreased ISG.RS, decreased tumor PDL1, and improved ICB response independent of TMB status.
Figure 7. Tumor mutations in the IFN pathway predict decreased ISG.RS and increased survival in lung cancer patients treated with anti-CTLA4 and anti-PD1.

A) GSEA of ISG.RS genes comparing TCGA NSCLC patients with and without a predicted pathogenic variant in the IFN pathway (IFN Path Var). B) CADD, DANN, and SIFT scores for IFN Path Var from a cohort of 75 NSCLC patients treated with anti-CTLA4 + anti-PD1. Variant type (color), optimal cut points for classification (dashed line), and mean value for benign ClinVar variants (solid line) are shown. C) Progression-free survival after anti-CTLA4 and anti-PD1, and D) odds ratios for response (with 95% confidence intervals) from multivariable logistic regression. E) Response (top plot), clinical features (middle two plots), and variant allele frequency (VAF; bottom plot) of tumors with IFN Path Vars. The mean/median values are indicated by dashed lines. Top plot shows predicted probability of response (from logistic regression) and observed best overall response (NE is nonevaluable). F) Boxplot of %PDL1 staining and response. G) Model for how the opposing roles of IFN signaling in immune and tumor cells regulate ICB response in tumors differing in neoantigen and MHC-I status. See also Figure S7.
DISCUSSION
In this study, we describe how IFNG signaling in tumor cells antagonizes both T cell and innate immune responses. This is accomplished through an inhibitory feedback circuit orchestrated by tumor cells whereby IFNG from immune cells not only regulates its own inhibition but tightly controls adaptive and innate immunity (Figure 7G). Our current and previous findings suggest several main components to this IFNG circuit. First, we previously reported that persistent IFNG signaling can initiate epigenetic changes in cancer cells characterized by enhanced STAT1-associated open chromatin (Benci et al., 2016) that includes loci for ISGs belonging to ISG.RS genes (unpublished data). Since resistance caused by persistent IFNG signaling can take several weeks to establish, these results suggest that the first component of the feedback circuit is the establishment of an epigenetic landscape in cancer cells that is permissive for enhanced ISG.RS expression. The second component is enforcing T cell exhaustion through high levels of PDL1 and likely other inhibitory ligands, which may include HVEM, LGALS9, and others (Benci et al., 2016). How the increase in these inhibitory ligands are mechanistically related to the epigenetic changes is currently unclear. Nonetheless, the end result is interactions between cancer and immune cells that favor an exhausted T cell state characterized by decreased IFNG and CTL function. The third component is inhibition of innate immunity by impeding NK/ILC1 effector function and differentiation. IFNG signaling in cancer cells not only increases PDL1 but decreases TRAILR2, which is the receptor for TRAIL expressed by ILC1 cells. Consequently, cytotoxicity from PD1+ TRAIL+ NK/ILC1 cells is antagonized. Additionally, the decreased production of IFNG by T cells further safeguards against innate immune killing by stalling NK/ILC1 recruitment and/or maturation. This may be at least partly due to diminished expression of CXCL9/10 from myeloid cells. Thus, IFNG signaling in cancer cells orchestrates feedback inhibition on multiple levels to limit both adaptive and innate immune function.
By preventing tumor IFNG signaling, both adaptive and innate immune functions are unleashed (Figure 7G). However, the degree to which each of these effector arms contribute to response is context dependent. In tumors that are less reliant on IFNG for high MHC-I expression and antigen presentation (e.g., CT26 and TSA), blocking tumor IFNG signaling enables TEX to coordinate both CTL- and NK/ILC1-mediated responses. For tumors with low baseline MHC-I that are reliant on IFNG to elevate MHC-I expression (e.g., B16), a decrement in CTL killing is likely; however, the presence of innate immune killing can help to maintain overall response. For tumors such as Res 499 with poor neoantigens and low MHC-I, or for tumors that have lost B2M, compromised IFN-inducible MHC-I is likely inconsequential. Here, enhanced IFNG production by cross-primed TEX or possibly activated bystander T cells increases IFNG signaling in immune cells and maturation of NK/ILC1s. Ablating tumor IFNG signaling may particularly help activate otherwise poorly cytotoxic PD1+ TRAIL+ ILC1 cells (Cortez et al., 2017; Gao et al., 2017) by increasing tumor TRAILR2, decreasing PDL1, and/or altering other inhibitory pathways present on NK cells and/or ILC1s (Figure 4G). Thus, preventing tumor IFNG signaling enhances both adaptive and innate immune effector function but the magnitude that each contributes to response is context-dependent – in particular, MHC status and antigen availability are likely key determinants.
Besides cell-intrinsic properties that influence the extent to which adaptive and innate immunity contribute to response after tumor IFNGR knockout, another important determinant is the impact of therapy on Tregs. In our mouse models, intratumoral Tregs are highly proliferative, consistent with recent evidence from human tumors (Li et al., 2019). Preventing tumor IFNG signaling does not appear to impact the abundance or proliferative status of Tregs. Yet, inhibiting Tregs seems to be an important requirement to fully enable ICB response after tumor IFNGR knockout, particularly response driven by innate immune cells. This may explain why response can be worse when IFNG signaling is crippled in B16 models using anti-PD1-based combination therapies (Manguso et al., 2017). Here, therapeutic efficacy is likely CTL-dominant and IFNG is needed to increase low baseline MHC-I levels. Primarily relying on enhanced CTL killing through PD1 blockade becomes inadequate because MHC-I levels are insufficient for T cell recognition, and NK/ILC1 killing is not effective without concurrently inhibiting Tregs. This notion is illustrated using CT26 tumors that have high baseline MHC-I and is responsive to both anti-PD1 and anti-CTLA4. Here, durable response of IFNGR knockout CT26 tumors to anti-PD1 is abrogated by B2M loss but maintained when using a Treg-depleting anti-CTLA4 antibody. This interpretation may explain why mutations in the IFNG signaling pathway can associate with relapse to anti-PD1 monotherapy if baseline MHC-I levels are inadequate (Zaretsky et al., 2016). In such instances, inhibiting Tregs might promote tumor response through NK/ILC1-mediated killing. Such non-redundant effects between anti-PD1 and potential Treg targeting antibodies may provide insight into why MHC-I levels appear not to correlate with clinical response in patients treated with combination nivolumab and ipilimumab (Rodig et al., 2018). Notably, our cohort of lung cancer patients that show IFN pathway variants can predict improved survival was treated with nivolumab and ipilimumab.
Even if CD8 T cells are not able to effectively mediate direct cytolytic tumor killing, the ability of TEX to generate IFNG is important to promote NK/ILC1 function. Preventing tumor IFNG signaling both enhances CD8 T cell abundance and drives them toward terminal exhaustion, a state characterized by high IFNG production compared to progenitor TEX. Our studies also suggest that IFNG produced by cross-primed and/or activated bystander T cells might be sufficient to sustain NK/ILC1 maturation and NK/ILC1-dependent tumor killing. These findings have relevance for bystander T cells to common viruses and other non-tumor antigens that not only are abundant in human tumors (Simoni et al., 2018) but can be leveraged for immunotherapy (Rosato et al., 2019). One reason why antigen-restriction may not be required is because the stimulatory effects of IFNG on NK/ILC1s are indirect. IFNG from CD8 T cells appear to increase IFNG.GS expression predominantly in DC and myeloid cells, and IFNG.GS genes such as Cxcl10 then influences intratumoral NK/ILC1 abundance. In melanoma patients, IFNG.GS is also highest in macrophages (Figures 1B and S1A) and positively correlates with the proportion of activated intratumoral NK cells (Figure 6G). Thus, tumor-specific TEX or activated bystander T cells can enhance innate immune responses against cancer when tumor IFNG signaling is blocked.
Besides tumor IFNG signaling, inhibiting IFN-I signaling in tumor cells also diminishes the expression of resistance-associated ISGs and in some cases result in greater anti-tumor responses than IFNGR knockout alone (Benci et al., 2016). Thus, how IFN-I contributes to IFN-driven resistance and differs from IFNG requires additional investigation, as do the roles of individual ISGs in ICB resistance.
STAR METHODS
LEAD CONTACT AND MATERIALS AVAILABILITY
Further information and requests for reagents may be directed to, and will be fulfilled by, the Lead Contact Andy Minn (andyminn@upenn.edu). This study did not generate new unique reagents except for cell lines described below.
EXPERIMENTAL MODEL AND SUBJECT DETAILS
Mice
All animal experiments were performed according to protocols approved by the Institutional Animal Care and Use Committee of the University of Pennsylvania. Five to seven week old female C57BL/6 (stock# 027) and BALB/c (stock# 28) were obtained from Charles River Laboratory. Five to seven week old female C57BL/6 (stock# 000664), Perforin knockout (C57BL/6-Prf1tm1Sdz/J; stock# 002407), IFNG knockout (B6.129SJ-Ifngtm1Ts/J; stock # 002287), RAG1 knockout (B6.129S7-Rag1tm1Mom/J; stock# 002216), OT1 (C57BL/6-Tg(TcraTcrb)1100Mjb/J; stock# 003831), FoxP3-DTR (B6.129(Cg)-Foxp3tm3(DTR/GFP)Ayr/J; stock# 016958) were ordered from Jackson Laboratory (Bar Harbor, ME). Mice were maintained under specific pathogen free conditions and randomly assigned to each experimental group.
Cell Lines
B16-F10 melanoma cells (male C57BL/6 mouse), TSA breast cancer cells (female BALB/c mouse), and resistant sublines were derived and cultured as previously described (Twyman-Saint Victor et al., 2015). CT26 colorectal cancer cell lines (female BALB/c mouse) were purchased from ATCC and similarly cultured.
METHOD DETAILS
CRISPR gene targeting
Gene targeting by CRISPR/Cas9 was accomplished by co-transfection of a Cas9 plasmid (Addgene, 41815), the guide sequence (selected using ZiFit Targeter) cloned into the gBlock plasmid, and a plasmid with the puromycin selection marker. Successful targeting of the gene(s) of interest was determined by treating cells with and without 100 ng/mL of IFNG (PeproTech), 1000 units/mL IFN-beta (PBL Assay Science), or both depending on the target gene, and examining PDL1, B2M, or TRAILR2 surface expression by flow cytometry. Knockout cells were sorted from a bulk knockout population using Fluorescence Activated Cell Sorting (FACS) on the Aria (BD) or FACSJazz (BD) to maintain the diversity of the parent cells. The gene block contains 20 bp target size (N), U6 promoter, gRNA scaffold, and a termination signal. The common gene block sequence is:
TGTACAAAAAAGCAGGCTTTAAAGGAACCAATTCAGTCGACTGGATCCGGTACCAAGGTCGGGCAGGAAGAGGGCCTATTTCCCATGATTCCTTCATATTTGCATATACGATACAAGGCTGTTAGAGAGATAATTAGAATTAATTTGACTGTAAACACAAAGATATTAGTACAAAATACGTGACGTAGAAAGTAATAATTTCTTGGGTAGTTTGCAGTTTTAAAATTATGTTTTAAAATGGACTATCATATGCTTACCGTAACTTGAAAGTATTTCGATTTCTTGGCTTTATATATCTTGTGGAAAGGACGAAACACCGNNNNNNNNNNNNNNNNNNNGTTTTAGAGCTAGAAATAGCAAGTTAAAATAAGGCTAGTCCGTTATCAACTTGAAAAAGTGGCACCGAGTCGGTGCTTTTTTTCTAGACCCAGCTTTCTTGTACAAAGTTGGCATTA
The guide sequences used are previously published (Benci et al., 2016) or listed in the Key Resources Table.
KEY RESOURCES TABLE
| REAGENT or RESOURCE | SOURCE | IDENTIFIER |
|---|---|---|
| Antibodies | ||
| Anti-mouse GzmB | Invitrogen | Cat# GRB18 |
| Anti-mouse NKG2A/C/E | BD Pharmagen | Custom (Clone 20d5) |
| Anti-mouse CD4 | BD Biogen | Cat# 565978 |
| Anti-mouse Ki67 | BD Biosciences | Cat# 563757 |
| Anti-mouse NKG2D | BD Pharmagen | Custom (Clone CX5) |
| Anti-mouse KLRG1 | BD Pharmagen | Custom (Clone 2F1) |
| Anti-mouse CD11b | BD Biogen | Cat# 565080 |
| Anti-mouse CD45.2 | BD Biogen | Cat# 564880 |
| Anti-mouse NKp46 | BD Biogen | Cat# 561169 |
| Anti-mouse CD69 | BD Pharmagen | Cat# 557392 |
| Anti-mouse Ly49A | BD Biogen | Custom (Clone A1) |
| Anti-mouse CD49b | Invitrogen | Cat# 46-5971-81 |
| Anti-mouse TCRB | BD Pharmagen | Custom (Clone H57–597) |
| Anti-mouse NK1.1 | eBioscience | Cat# 47–5941 |
| Anti-mouse CD27 | BD Pharmagen | Custom (Clone LG3A.10) |
| Anti-mouse TRAIL | Biolegend | Cat# 109309 |
| Anti-mouse Eomes | eBioscience | Cat# 50–4875 |
| Anti-mouse TIGIT | BD Biosciences | Cat# 565270 |
| Anti-mouse Lag3 | Biolegend | Cat# 125219 |
| Anti-mouse CD127 | Biolegend | Cat# 135025 |
| Anti-mouse Tbet | BD Biogen | Cat# 564142 |
| Anti-mouse Ly49D | BD Biogen | Cat# 742559 |
| Anti-mouse CD44 | Biolegend | Cat# 103031 |
| Anti-mouse CTLA4 | Biolegend | Cat# 106306 |
| Anti-mouse CD8a | MBL International | Cat# T03015 |
| Anti-mouse PD1 | Biolegend | Cat# 109110 |
| Anti-mouse CD3 | Biolegend | Cat# 107631 |
| Anti-mouse CD49a | Biolegend | Cat# 142604 |
| Live/Dead Aqua | Life Technologies | Cat# L34957 |
| Anti-mouse PD-L1 | eBioscience | Cat# 46–5982 |
| Anti-mouse TRAILR2 | Biolegend | Cat# 119905 |
| Anti-human CD19 | Biolegend | Cat# 302211 |
| Anti-mouse H2-Kb/Db | Biolegend | Cat# 114612 |
| Anti-mouse CTLA4 (9H10) | BioXcell | Cat# BE-0131 |
| Anti-mouse CTLA4 (9D9) | BioXcell | Cat# BE0164 |
| Anti-mouse PD1 | BioXcell | Cat# BE0146 |
| Anti-mouse CD8a | BioXcell | Cat# BE0061 |
| Anti-mouse NK1.1 | BioXcell | Cat# BE0036 |
| Anti-mouse asialo-GM1 | Wako Chemical | Cat# 986–10001 |
| Anti-mouse IFNg | Biolegend | Cat# 505821 |
| Bacterial and Virus Strains | ||
| Biological Samples | ||
| Chemicals, Peptides, and Recombinant Proteins | ||
| IFNG | Peprotech | Cat# 315–05 |
| Ova Peptide | Invivogen | Cat# sin-vac |
| CXCL10 | Peprotech | Cat# 250–16 |
| Poly I:C | Invivogen | Cat# vac-pic |
| Critical Commercial Assays | ||
| LegendPlex Cytokine Assay | Biolegend | Cat# 740005 |
| Purelink Genomic DNA Kit | ThermoFisher Scientific | Cat# K182001 |
| SureSelectQXT Kit | Agilent | Cat# G9683A |
| 10x v2 Library and Gel Bead Kit | 10x Genomics | Cat# PN-120258 |
| Fixation and Permeablization Kit | eBioscience | Cat# 00–5523 |
| Deposited Data | ||
| 499 WT v 499 IFNgR KO s.c. RNA-seq data | GSE131927 | |
| B16 v 499 Whole Exome Seq | GSE131927 | |
| Sorted 499 tumor cells | GSE83848 | |
| Experimental Models: Cell Lines | ||
| B16-F10 melanoma | ATCC | Cat# CRL-6475 |
| TSA breast carcinoma | Laboratory of Sandra Demaria | PMID: 19706802 |
| CT26 colorectal carcinoma | ATCC | Cat# CRL-2638 |
| Res 499, Res 237, associated CRISPR KO | Laboratory of Andy Minn | PMID:25754329, PMID:27912061 |
| Experimental Models: Organisms/Strains | ||
| C57BL/6 WT mice | Jackson Laboratories | Cat# 000664 |
| C57BL/6 WT mice | Charles River Laboratories | Stock #027 |
| Balb/c WT mice | Charles River Laboratories | Stock #028 |
| RAG−/- mice (B6129S7-Rag1tm1Mom/J) | Jackson Laboratories | Cat# 002216 |
| IFNg −/− mice (C57BL/6-Tg(TcraTcrb)1100Mjb/J) | Jackson Laboratories | Cat# 002216 |
| FoxP3 DTR mice (B6.129(Cg)-FoxP3tm3(DTR/GFP)Ayr/J | Jackson Laboratories | Cat# 016958 |
| OT-I mice (C57BL/6-Tg(TcraTcrb)1100Mjb/J) | Jackson Laboratories | Cat# 003831 |
| Oligonucleotides | ||
| B2M guide sequence g1: GACAAGCACCAGAAAGACCA g2: GTGAGTATACTTGAATTTGA |
This paper | |
| TRAILR2 guide sequence g1: GTGGGCGTGCTGGGTCCTGG g2: ATCGTCCAGCTGGCCTACAG |
This paper | |
| Recombinant DNA | ||
| Human-CD19 expression vector | Laboratory of Carl June | PMID:19384291 |
| Anti-human CD19BBz CAR construct | Laboratory of Carl June | PMID:26885860 |
| Software and Algorithms | ||
| Picard tools v2.17.11 | https://broadinstitute.github.io/picard/ | |
| samtools v1.3.1 | http://samtools.sourceforge.net | |
| survival v2.41–3 | https://cran.r-project.org/web/packages/survival/index.html | |
| MASS v7.3–48 | https://cran.r-project.org/web/packages/MASS/index.html | |
| DESeq2 v1.14.1 | https://bioconductor.org/packages/release/bioc/html/DESeq2.html) | |
| fgsea v1.4.1 | https://bioconductor.org/packages/release/bioc/html/fgsea.html | |
| SAVER v1.1.1 | https://github.com/mohuangx/SAVER | |
| Rtsne v0.15 | https://github.com/jkrijthe/Rtsne | |
| CIBERSORT | https://cibersort.stanford.edu/ | |
| randomForestSRC v2.5.1.14 | https://github.com/kogalur/randomForestSRC | |
| flowCore v1.44.1 | https://bioconductor.org/packages/release/bioc/html/flowCore.html | |
| cytofkit v1.10.0 | https://bioconductor.org/packages/release/bioc/html/cytofkit.html | |
| fastQC v0.11.5 | https://www.bioinformatics.babraham.ac.uk/projects/fastqc/ | |
| GATK v4.0.2.1 | https://software.broadinstitute.org/gatk/gatk4 | |
| bwa v0.7.17 | http://bio-bwa.sourceforge.net/ | |
| Canopy v1.3.0 | https://github.com/yuchaojiang/Canopy | |
| NetMHC v4.0 | http://tools.iedb.org/main/tcell/ | |
| ANNOVAR | http://annovar.openbioinformatics.org/en/latest/user-guide/download/ | |
| SIFT | http://sift.bii.a-star.edu.sg/www/SIFT_indels2.html) | |
| Seurat v2.3.4 | https://satijalab.org/seurat/install.html | |
| Cell Ranger v2.1.0 | https://support.10xgenomics.com/single-cell-gene-expression/software | |
| Other | ||
| Diptheria Toxin | Sigma Aldrich | D0564 |
In vivo mouse studies
Tumor injection and treatment schedule were done as previously described (Twyman-Saint Victor et al., 2015). Except for some experiments to measure immune cell infiltration, both flanks were implanted. Blocking antibodies were given on days 5, 8, and 11 unless otherwise specified. Anti-CD8, anti-NK1.1., and anti-Asialo-GM1 were given on days −2, 0, 4, 8, 12, and 16. Antibodies against CTLA4 (9H10), PDL1 (10F.9G2), or PD1 (RMP1–14) were all administered intraperitoneally at 200 ug/dose. Isotype controls were used to confirm the lack of non-specific effects and a similar response and survival to untreated mice.
Whole exome sequencing
Genomic DNA was isolated and purified from sorted cancer cells from mouse tumors using Purelink Genomic DNA Kit (Fisher). Exome libraries were prepared using the SureSelectQXT Kit (Agilent) with SureSelectXT Mouse All Exon bait. Libraries were sequenced on an Illumina HiSeq 2500 with 100 base paired end reads.
Single Cell Sequencing Preparation
Tumors were harvested on day 17 and viable CD45+ cells were FACS sorted. Single-cell emulsions were obtained using the 10x Genomics Controller and the v2 Library and Gel Bead kit (10X Genomics). RNA-sequencing libraries were prepared as instructed by the 10× 3’ v2 kit protocol. Resulting libraries were sequenced on an Illumina NextSeq using a NextSeq 500/550 v2.5 High Output Kit.
Flow cytometry
Tumors were harvested at day 13–15 post tumor implantation. Single-cell suspensions were prepared and red blood cells were lysed using ACK Lysis Buffer (Life Technologies). For in vitro cell lines, untreated or sub-confluent cells treated for 16 hours with 100 ng/mL of IFNG (PeproTech) were harvested and single-cell suspensions prepared. Live/dead cell discrimination was performed using Live/Dead Fixable Aqua Dead Cell Stain Kit (Life Technologies). Cell surface staining was done for 30 min at 4 degrees. Intracellular staining was done using a fixation/permeabilization kit (eBioscience). Data acquisition was done using an LSR II (BD) or FACSCalibur (BD) and analysis was performed using FlowJo (TreeStar) or the flowCore package in the R language and environment for statistical computing. For high-dimensional flow cytometry, a FACSymphony (BD) was used for data acquisition and data analysis was done using the cytofkit R package and a custom analysis pipeline described in Quantification and Statistical Analysis. For quantitation of immune infiltration, tumors were harvested and weighed and the entire tumor section was dissociated and stained. All events were collected on a flow cytometer and the total number of events of a given immune cell type were divided by the weight of the tumor. The antibodies used in flow cytometry are provided in the Key Resources Table.
Intratumoral cytokine assay
Approximately 200 ug of tumor was harvested, weighed, and placed in complete RPMI media for 4 hours at 37 degrees. The media was then harvested, spun to remove any remaining cells, and analyzed for cytokine expression (Luminex) according to the manufacturer’s instructions. Resulting cytokine levels were then divided by the initial tumor weight for each sample.
In vivo cytokine rescue studies
All mice were pre-treated with anti-CD8 two days before tumor injection. Either 1 ug IFNG or 100 ng CXCL10 was mixed in the PBS/tumor cell suspension prior to injection of the tumor. Mice then continued receiving 500–1000 ng IFNG or 100 ng CXCL10 intra/peritumorally every 3 days post-tumor implantation. For flow cytometry experiments, mice were harvested at day 13 to examine the effects of cytokine addback on immune recruitment in the absence of CD8 T cells. For survival experiments, intra/peritumoral injections continued every 3 days for the remainder of the experiment.
OT1 and FoxP3-DTR mice studies
Transgenic OT1 mice or littermate wild type mice were implanted with tumors using Res 499 cells with IFNGR and B2M knockout. Groups receiving Ova peptide had 50 ng of peptide mixed into the suspension prior to tumor injection and continued to receive intra/peritumoral injections on days 3, 6, 9, and 12. For flow cytometry experiments, mice were harvested on day 13. For FoxP3-DTR mice studies, mice were implanted with Res 499 IFNGR knockout tumors and diptheria toxin was administered intraperitonally at 1 ug/dose/mouse on days 5, 8, and 11 post-injection.
Murine chimeric antigen receptor T cells
B16-F10 or Res 499 tumor cells were transduced with pCLPs-hCD19 lentivirus to express a truncated human CD19 antigen that is unable to drive intracellular signaling. Cells were double sorted for stable expression. 5×10⁴ tumor cells in log phase growth were implanted into flanks of B6 mice. Murine T cells were stimulated with CD3/CD28 Dynabeads (Invitrogen) for 24 hours and then transduced with pMSGV-h19BBz retrovirus. At 48 hours after transduction, CAR-expressing T cells were quantified and 5×10⁶ CAR-expressing T cells were injected i.v. in mice bearing B16- or Res499-hCD19 tumors 5 days after tumor implantation. Controls were either mock PBS-injected or control transduced CAR T cells, which gave comparable results.
Adoptive transfer of mouse T cells
T cells from spleens of wild type or IFNG knockout mice were isolated by negative selection, and 8 × 10⁶ cells were adoptively transferred i.v. into RAG1−/− mice. Recipient mice were allowed to reconstitute for 4 weeks, verified for reconstitution, and then were injected with flank tumors and treated with ICB as described above.
In vitro NK cell assays
Mice were injected i.p. with poly I:C 18 hours prior to NK cell isolation from mouse spleens or livers by negative selection. NK cells were then cultured with tumor cells for 6 hours. Flow cytometry was performed to assess the effector function and activation status of NK cells by examining CD49a, CD49b, PD1, and/or CD107a.
QUANTIFICATION AND STATISTICAL ANALYSIS
Analysis of tumor growth, survival, and group differences
Tumor volumes were determined by caliper measurements. Differences in survival were determined for each group by the Kaplan-Meier method and the overall p-value was calculated by the log-rank test using the survival R package. For mouse studies, an event was defined as death or when tumor burden reached a pre-specified size to minimize morbidity. Using the MASS R package, a mixed effect generalized linear model with lognormal distribution for tumor volume data was used to determine differences in growth curves. The significance of all two-way comparisons was determined by a two-sample two-tailed t-test, or by a one-tailed t-test when appropriate. For non-parametric data, a Wilcoxon rank-sum test was used.
Gene set enrichment analysis
RNA-sequencing data from Res 499 resistant cells and B16-F10 parental cells flow sorted from untreated tumor-bearing mice were used for gene expression analysis. Previously described upregulated ISGs associated with cancer and therapy resistance (Weichselbaum et al., 2008) were confirmed to be enriched in Res 499 compared to B16 by gene set enrichment analysis (GSEA) and denoted the ISG Resistance Signature (ISG.RS). For genes associated with IFNG signaling, the IFNG gene set from the Hallmark gene sets was used (IFNG.GS). GSEA was performed and the normalized enrichment scores and p-values calculated using the fgsea R package. For some genes like OAS1, orthologs were used when converting between mouse and human gene names. See Table S1 for a list of genes in the ISG.RS and IFNG.GS.
Analysis of genomic features from clinical melanoma samples
Processed bulk RNA-seq data from two different cohorts of melanoma patients treated with anti-PD1 (Hugo et al., 2016; Riaz et al., 2017) were downloaded from the GEO. CIBERSORT (Newman et al., 2015) was used to infer relative frequencies of immune cells in the tumor. For immune cell types with values for both resting and activated states, the values for the resting state were subtracted from values for the activated state. To calculate metagenes, gene expression data were centered and scaled using the sample mean and standard deviation, respectively. Then, the average expression of the genes in each gene set was calculated for each sample to give the metagene value. For tumor mutational burden, the provided values were log10 transformed.
Single-cell RNA-sequencing analysis
Single-cell RNA-sequencing data from melanoma patients were downloaded from the GEO (Tirosh et al., 2016) and converted to TPM values. Several filtering steps were performed including, eliminating genes with low average expression and genes with greater than 20% zero values. This resulted in 8213 genes that was then imputed using the SAVER R package (Huang et al., 2018) followed by log2 transformation. Dimensionality reduction was performed using tSNE as implemented in the Rtsne R package and resulting clusters were annotated using the provided cell type labels. The expression of each ISG metagene for cells belonging to each cell type was calculated and compared by two sample t-test. For single-cell immune cell data from mouse tumors using the 10X Genomics platform, data were first processed using the Cell Ranger pipeline (10X Genomics). This included demultiplexing BCL files into FASTQ, performing alignment with STAR, UMI counting, and aggregating replicates of the same condition. Cells that had fewer than 500 genes detected, over 10% mitochondrial content, or over 3.5 times the median UMI count were removed. Genes expressed in less than 1% of cells were also removed. After these QC steps, UMI counts were imputed with SAVER. Seurat was then used to normalize data to sequencing depth using a LogNormalize implementation, and mitochondrial contamination and cell cycle effects were regressed out. Clustering was performed using Seurat’s graph-based clustering approach and visualized with tSNE. Clusters were classified using a collection of manually curated immune marker genes (Table S2). Metagene values for IFNG.GS was determined similarly to the clinical analysis. The average scaled values for Mki67 and Top2a, and the average scaled values for Cxcl9 and Cxcl10 were used to calculate the proliferation and Cxcl9/10 metagene, respectively. For visualization purposes, metagene values less than or greater than 2.5 times the interquartile range were removed. Comparison of expression values between groups was done using a Wilcoxon rank-sum test. GSEA was performed using the fgsea R package. Gene sets for LCMV terminal exhausted T cells, progenitor exhausted T cells, and intratumoral ILC1 populations were curated from previously published reports (Gao et al., 2017; Miller et al., 2019).
Multivariable classification, regression, and survival analysis
Random forest (RF) for classification, regression, and survival analysis is a multivariable non-parametric ensemble partitioning tree method that can be used to model the effect of all interactions between genes on a response variable (Breiman, 2001; Chen and Ishwaran, 2012). We used the randomForestSRC package version 2.5.1.14 and the following parameters: 5000 trees, node size of 2, and default values for mtry. The default splitting rule was used for classification and the log-rank slitting rule was used for survival analysis. The default value for nsplit was used except for models containing both two-level factor variables and continuous variables. In this case, the nsplit parameter was set to 2 in order to prevent bias against the factor-level variables. Importance scores were calculated using the random ensemble method. For classification problems where the two classes were imbalanced, a random forest quantileclassifier approach was employed. Response was defined as complete or partial response. All predicted values, error rates, and importance scores were based on cross-validation using out-of-bag samples. For variable selection and assessing variable robustness, we considered the set of immune cell frequencies (inferred by CIBERSORT), TMB, IFNG.GS, ISG.RS, and/or the difference between IFNG.GS and ISG.RS (dISG) in a model for immune checkpoint blockade response. Prior treatment status and cohort were included to ensure the lack of confounding from these variables. Balanced undersampling of the majority class was performed and variable selection was determined using minimal depth (Ishwaran et al., 2010). The frequency that each variable was selected and its associated importance score were averaged over 100 iterations.
To complement the RF approach for modeling probability of clinical response to immune checkpoint blockade, we also performed multivariable logistic regression. From this, odds ratios and 95% confidence intervals were determined for each log10 increase in TMB or 0.5 unit increase in metagene expression values. To complement RF variable selection using minimal depth, we performed lasso regression using the glmnet R package. Both RF and linear regression methods yielded comparable results.
High-dimensional flow cytometry analysis
Fluorescence intensity data were analyzed using the flowCore R package and transformed using the logicle method. After excluding debris, dead cells, doublets and CD45– cells, CD8 T cells and NK/ILC1 cells were gated and separately analyzed. CD8 T cells were identified as TCRB+ and CD8+, while NK/ILC1 cells were identified as TCRB– and NK1.1+. For each population, an aggregate data matrix from random sampling of 1000 events from each sample was used for dimensionality reduction and for clustering analysis. Clusters were identified using Phenograph (Levine et al., 2015) as implemented in the cytofkit R package and visualized by tSNE. Using cluster membership as class definitions, a RF classifier was developed using the same aggregate data matrix. After confirming a low misclassification error rate for each class, this RF classifier was used to assign all cells in all samples to one of the clusters. Using the two-dimensional tSNE coordinates, a RF classifier was also developed and used to assign all cells to the tSNE map, allowing the distribution and frequencies of immune cells across clusters to be estimated for each sample. To analyze which immune clusters are strongly associated with wild type or IFNGR knockout tumors, the frequencies of immune cells within each cluster were used as features in a RF model, and the resulting importance scores were examined.
Whole exome sequencing and neoantigen prediction
Preprocessing and variant calling were done with the Genome Analysis Toolkit (GATK) version 4.0.2.1 following its Best Practices workflow. In brief, raw paired-end reads were aligned to the reference mouse genome GRCm38 release 68 using the bwa-mem algorithm from BWA version 0.7.17. Duplicates were marked using MarkDuplicates from Picard tools version 2.17.11. Systematic errors in base quality scores were detected and recalibrated using GATK’s BaseRecalibrator and ApplyBQSR. Known variants for recalibration were downloaded from the Mouse Genome Project SNP and Indel release version 5. Somatic SNVs and indels were then called with Strelka and MuTect2 using a matched normal germline of either C57BL/6 or BALB/c mice, and only variants shared by both methods were kept. Variants were then filtered with FilterMutectCalls using GATK’s preset thresholds that are tuned for diploid somatic analyses. Based on gene expression from RNA-seq data, variants from transcripts that were not detectably expressed were removed. The MHC-I binding affinities of variants were then predicted using NetMHC version 4.0 for H-2-Kb and H-2-Db using peptide lengths from 8 to 11. To examine the genomic contraction of variants in Res 499 compared to parental B16, the variant allele frequencies were analyzed for variants with near-heterozygous frequency (0.2 for a tetraploid genome) in one cell line but subclonal frequency in the other. Significance between the distribution of allelic frequencies between the two groups was estimated by a KS-test and compared to 1000 random variants. In addition, subclonal structure and their frequencies within the tumor were examined using the Canopy R package (Jiang et al., 2016). High quality variants that meet all the following criteria were used for the analysis: 1) affects only single nucleotides, 2) resides in autosome exonic regions, 3) exhibits VAF variance greater than 0.01, and 4) has mutation calling QUALs that exceed 50. The number of subclones were selected based on a Bayesian information criterion (BIC) after 100000 rounds of simulation across 20 chains. The configuration with the highest posterior likelihood was utilized to generate a phylogenetic tree and the corresponding frequencies of the subclonal populations were determined.
Variant analysis of clinical lung cancer tumors
We used previously published processed data for somatic non-synonymous variants from non-small cell lung cancer patients treated with anti-PD1 and anti-CTLA4 (CheckMate-012 study) or from TCGA (Hellmann et al., 2018). Variants in one of 11 genes involved in type I or II IFN pathway signaling (IFNGR1, IFNGR2, IFNAR1, IFNAR2, JAK1, JAK2, TYK2, STAT1, STAT2, IRF9, and B2M) were examined. To exclude likely normal or benign variants, missense variants were annotated with ANNOVAR. Any missense variant found in all individuals in the ExAC database at a relative frequency greater than 0.0001 was removed. In order to predict benign from pathogenic missense or nonsense variants, two algorithms for scoring deleterious variants were used that included DANN, a deep learning algorithm, and CADD, a machine learning algorithm. For each method, an optimal cut point was selected by training on ClinVar data. Here, ClinVar variants classified as likely benign were considered benign and those classified as likely pathogenic were classified as pathogenic. The optimal cut points based on ROC accuracy were then applied to test accuracy in predicting these labels. Any variant below the ROC cut points for both DANN and CADD was categorized as benign. This yielded an overall accuracy of 0.80, sensitivity of 0.95, and specificity of 0.54. This criterion was then applied to the TCGA lung cancer data and the lung cancer tumors from CheckMate-012. For indels, SIFT was used for evaluation and non-frameshift indels and indels predicted to be neutral were excluded. Examining the IFN pathway variants, any patient with at least one predicted pathogenic missense variant, pathogenic nonsense mutation, or deleterious indel resulting in a frameshift was classified as IFN pathway variant positive.
The progression-free survival (PFS) of patients stratified by IFN pathway variant status was determined by Kaplan-Meier survival. The likelihood of response was determined by a multivariable logistic regression using variant status, log10 transformed values for TMB, and a previously used %PDL1 staining cut off of greater than or equal to 1%. The p-value for odds ratios was calculated by bootstrapping. In addition, a non-parametric model for response employing multivariable random forest was also used and without the need to transform any of the variables. The out-of-bag error rate and importance scores from this random forest model was then determined. To evaluate the significance of the observed association between IFN pathway variant status with PFS and decreased %PDL1 staining, the variant status of random sets of 11 genes were evaluated and used to stratify patients. Then, the hazard ratio for PFS and the associated p-value, and the %PDL1 staining for variant-positive and negative patients were recorded for 10,000 iterations and compared to the observed values.
DATA AND CODE AVAILABILITY
All software used in this study are open source and/or publicly available. The datasets generated or used in this study are available at the Gene Expression Omnibus (GEO) at http://www.ncbi.nlm.nih.gov/geo, provided as supplementary data from cited studies, or available through other cited public repositories.
Software
The R language and environment for statistical computing and graphics (https://www.r-project.org) was used for statistical and bioinformatics analysis. R packages described in methods were obtained from Bioconductor (https://www.bioconductor.org) or from CRAN (https://cran.r-project.org/web/packages/). These packages and additional software for processing, alignment, and analysis of sequencing data are listed in the Key Resources Table.
Data Resources
Mouse sequencing data
The RNA sequencing data for sorted Res 499 tumor cells is available from the GEO under accession number GSE83848. The single-cell RNA sequencing data for immune cells from Res 499 tumors and whole-exome sequencing data from sorted B16 and Res 499 tumors have been deposited under accession number GSE131927.
Human gene expression data
Normalized transcriptomic data, summarized exome analysis, and annotations for human melanoma patients treated with anti-PD1 were previously described (Hugo et al., 2016; Riaz et al., 2017) and downloaded from the GEO under accession number GSE78220 or on GitHub at https://github.com/riazn/bms038_analysis. Single-cell RNA-sequencing data from melanoma patients (Tirosh et al., 2016) were downloaded from the GEO under accession number GSE72056.
Human lung cancer variant data
Processed variant data from non-small cell lung cancer patients treated with anti-PD1 and anti-CTLA4 and from TCGA have been previously described and made available as supplementary information (Hellmann et al., 2018).
ClinVar data
All available data from ClinVar were downloaded from the FTP link available at the website (https://www.ncbi.nlm.nih.gov/clinvar).
Supplementary Material
Figure S1. ISGs and immune cell populations expressed in human melanoma, Related to Figure 1. A) Boxplots of ISG metagene expression in immune cell populations determined by single-cell RNA-seq of human melanoma. The width of the boxplots for the indicated cell types are proportional to the population size (of note, immune and cancer cells were sorted before sequencing). P-values for comparisons between cancer cells and each immune population are p<0.001. B) Gene set enrichment analysis of cancer and resistance-associated ISGs (ISG.RS) and IFNG-related ISGs (IFNG.GS) in melanoma patients who fail to respond to anti-PD1. Shown are enrichment plots along with the normalized enrichment score (NES) and p-value. The leading edge for the ISG.RS is labeled. C) Relative frequencies of immune populations in the melanoma tumors inferred by CIBERSORT. For immune cell types with both resting and activated populations, the difference between activated and resting was used. D) Multivariable random forest model for probability of response for melanoma patients treated with anti-PD1. Shown are the adjusted effects of model variables on the probability of response (left plots, yellow boundaries indicate one standard error) and variable importance scores (right plot). Predictor values are metagene expression values for ISG.RS and IFNG.GS or log10 frequency for TMB. Variable importance score represents the increase in classification error rate when the variable is perturbed. The classification error rate for the model is 36%. E) Random forest model with variable selection based on minimal depth was performed on bootstrapped samples. Variables include inferred frequencies of various immune populations (based on CIBERSORT), the ratio of IFNG.GS to ISG.RS (dISG), TMB, and other control variables. Shown are the frequencies that each variable was selected based on minimal depth after resampling versus the average variable importance score (VIMP). The inset shows the distribution of the number of variables in each bootstrapped model. Similar results were also obtained with lasso and logistic regression.
Figure S2. Effect of blocking tumor IFN signaling on baseline and inducible MHC-I expression, Related to Figure 2. Constitutive and IFNG-inducible expression of MHC-I on A) TSA/237 breast cancer cells and B) B16 melanoma cells in vitro.
Figure S3. Immune cell requirements for response after IFNGR knockout, Related to Figure 3. A) Representative density plots of tumor infiltrating CD45+ lymphoid cells that are either NK1.1+ or CD8+ after control (top) or depletion with anti-NK1.1 (bottom left) or anti-CD8 (bottom right). B) Ectopic expression of human CD19 on B16 and Res 499 melanoma cells. C) Tumor growth of B16 and Res 499 tumors expressing human CD19 with (IFNA/GR KO) and without (Cont) concurrent IFNGR + IFNAR knockout. D) Baseline and IFNG-inducible expression of MHC-I and PDL1 on Res 499 cells with or without knockout of IFNGR and/or B2M. E) Survival after tumor rechallenge of mice with initial complete responses to anti-CTLA4 (n=7). Res 499 cells with IFNGR knockout were used for both initial transplantation and rechallenge. F) In vitro NK-mediated cytotoxicity of Res 499 cells with B2M or IFNGR knockout after pre-treating tumor cells with IFNG prior to co-culture. CD107a expression by NK cells was used as a surrogate for engagement of cytotoxic function. G) Median (dot) and the 25th and 75th percentile survival of mice bearing IFNGR knockout Res 499 tumors following treatment with anti-CTLA4 (aCTLA4) or control (Cont). Shown are effects of NK/ILC1 depletion with an anti-NK1.1 antibody (aNK1.1) and of CD4 or CD8 T cell depletion with an anti-CD4 (aCD4) or anti-CD8 antibody (aCD8). H) Survival of mice bearing TSA/Res 237 tumors with IFNGR knockout after anti-CTLA4 and prior depletion of CD8 T cells or NK/ILCs with either anti-CD8 (aCD8) or anti-Asialo-GM1 (aAGM), respectively. For all groups, n=5–10. On the left is a representative scatter plot of CD3– NKp46+ intratumoral immune cells after control and depletion with anti-Asialo-GM1.
Figure S4. Improved TEX function and NK/ILC1 maturation after blocking tumor IFNG signaling, Related to Figure 4. A) Violin plots showing expression of the indicated genes in CD8 T cells from Res 499 wild type (WT) or IFNGR knockout (KO) tumors. B) Intracellular IFNG expression in tumor-infiltrating CD44+ PD1+ CD8+ T cells and C) intratumoral IL6 protein levels from wild type or IFNGR knockout Res 499 tumors treated with or without anti-CTLA4. Effect of antibody-mediated CD8 T cell depletion (aCD8) on IL6 levels was also examined. D) GSEA comparing ILC1 cluster to other NK cell clusters using genes increased or decreased in ILC1s relative to conventional NK cells. E) Dimensionality reduction and cluster identification were performed on TCRB+ CD8+ T cells or TCRB– NK1.1+ NK/ILC1s. Shown are heatmaps of the scaled MFI for each of the indicated markers across the identified clusters (labels below heatmap). For CD8 T cells, clusters representing PD1+ Eomes+ TEX are denoted in red. For NK/ILC1s, clusters in red denote CD11bhigh innate immune cells. F) Contour plots showing the distribution of CD8 T cells after anti-CTLA4 (top) or of NK/ILC1s at baseline (bottom) in either wildtype or IFNGR knockout Res 499 tumors. Individual cells corresponding to the contour plot are overlaid and colored by the scaled MFI of the indicated marker. G) Density plots of CD8 T cells or NK/ILC1s in wildtype or IFNGR knockout Res 499 tumors treated with or without anti-CTLA4. The left plot is a tSNE map. For CD8 T cells, clusters for PD1+ Eomes+ TEX with low or high expression of GzmB and Ki67 are color-coded and numbered. For NK/ILC1s, clusters enriched for CD11bhigh NK cells or PD1+ TRAIL+ ILC1 cells are color-coded and numbered. The cluster numbers correspond to the cluster labels shown in the heatmap from (E).
Figure S5. Regulatory roles for IFNG, PD1/PDL1, and TRAIL/TRAILR2 after tumor IFNGR knockout, Related to Figure 5. A) Representative scatter plots for the percent of peripheral CD8 and CD4 T cells after adoptive transfer of T cells from either wild type or IFNG-deficient mice into Rag1 knockout hosts. The plot on the far left is from a wild type mouse and is shown for comparison. Percentages relative to CD45+ cells are indicated. The percentage of peripheral CD4 and CD8 T cells after adoptive transfer for all mice are also shown (right plot). Values from the same mouse are connected. B) Proportion of mature CD27– CD11b+ NK/ILC1s in Res 499 tumors after CD8 T cell depletion (aCD8). Representative flow cytometry contour plots are shown. C) Survival of CD8 T cell-depleted mice after treatment with anti-CTLA4 with or without intratumoral injection of IFNG. Effect of anti-NK1.1 treatment to deplete NK/ILC1s is also shown. For each group, n=5. D) Expression of ectopic PDL1 and baseline or IFNG-induced MHC-I in Res 499 cells with or without IFNGR knockout. E) Survival benefit from anti-CTLA4 conferred by IFNGR knockout in Res 499 tumors. Shown are hazard ratios and standard errors for wild type tumors, tumors with ectopic expression of PDL1 (PDL1hi), or concurrent knockout of B2M. F) Expression of PD1 on CD49b– CD49a+ or CD49b+ CD49a– liver NK cells. G) In vitro TRAIL receptor (TRAILR2) expression after IFNG treatment on Res 499 cells with or without IFNGR knockout. H) Expression of TRAILR2, MHC-I, and PDL1 in Res 499 cells with or without concurrent knockout of TRAILR2 and IFNGR. Baseline and IFNG-inducible expression are shown.
Figure S6. Role of Treg depletion in response after tumor IFNGR knockout, Related to Figure 6. A) Survival of mice bearing Res 499 IFNGR knockout tumors treated with either a Treg-depleting (9H10) or non-depleting (4F10) anti-CTLA4 antibody. For each group, n=5. B). Expression of MHC-I on CT26 cells after IFNGR + B2M double knockout.
Figure S7. Tumor variants in IFN pathway genes predict improved response and survival of lung cancer patients after anti-CTLA4 and anti-PD1, Related to Figure 7. A) CADD and DANN, which predict deleterious missense/nonsense variants, was used on ClinVar data to classify benign vs. pathogenic missense/nonsense variants. Shown is the ROC accuracy as a function of algorithm score. The cut point giving the highest accuracy (dashed line) is shown. B) Predicted pathogenic non-synonymous variants in one of 11 core IFN pathway genes (IFN Path Var) from 710 NSCLC tumors from TCGA. Variant type is indicated by color. For missense/nonsense variants, scores from CADD and DANN are shown (top two plots). For frameshift indels, SIFT confidence scores are shown (bottom plot). SIFT information for two indels was not available. The mean value for benign ClinVar variants is indicated (solid line) as are the optimal cut points for classification as a pathogenic missense/nonsense variant (dashed line). C) Tumor variant allele frequency (VAF) for IFN Path Vars (represented by circle size). D) Expression of IFNG.GS across TCGA patients. The IFN Path Var status is shown above the heatmap. E) Univariate hazard ratios and p-values for progression-free survival of 75 NSCLC patients treated with anti-CTLA4 + anti-PD1 stratified by the presence or absence of a variant in at least one of 11 random genes. Density plots show results from 10,000 bootstrap samples. Dashed lines represent observed values from IFN pathway variant positive patients. The relative frequency of samples that exceed these observed values is indicated. F) Survival of TCGA NSCLC patients stratified by IFN Path Var status. G) Boxplot of predicted out-of-bag response rate and TMB for 75 NSCLC patients treated with anti-CTLA4 + anti-PD1 and stratified by IFN Path Var status. The best overall response for each patient is color coded. H) Variable importance scores (left plot) from a multivariable random forest model for clinical response to anti-CTLA4 + anti-PD1 (unbiased error rate of 30.1%) and predicted out-of-bag (OOB) probability of response (right plot). OOB predicted probabilities are from samples not used to generate the model. Actual observed response is color-coded. I) Percent PDL1 for NSCLC patients stratified by the presence or absence of a variant in at least one of 11 random genes. Density plots show results from 10,000 bootstrap samples. Dashed lines represent observed values from IFN pathway variant positive patients. The relative frequency of samples that exceed these observed values is indicated.
HIGHLIGHTS.
Blocking tumor IFNG signaling increases IFNG generated by exhausted T cells (TEX)
Higher immune vs cancer ISGs disable inhibitory pathways, allows NK/ILC1s to mature
Tumors with adequate MHC-I and antigen are killed by TEX after checkpoint therapy
Tumors with low/absent MHC-I or poor antigens are killed by PD1+ TRAIL+ NK/ILC1s
ACKNOWLEDGEMENTS
A.J.M., K.L.N., E.J.W., N.R.Z., and H.I. were supported by a program project grant from the NIH (1P01CA210944–01). A.J.M., J.L.B., E.J.W., M.D.H., and J.D.W. were supported by the Parker Institute for Cancer Immunotherapy, and A.J.M. and E.J.W. received additional funding from the Melanoma Research Alliance. A.J.M. and H.I. were supported by grants from the NIH (9R01GM125072–05A1 and 1-R01-CA172651–01A1). A.J.M. is also supported by the Breast Cancer Research Foundation, a grant from the Department of Defense (W81XWH-17-1-0264), and The Mark Foundation for Cancer Research. L.R.J. was supported by a fellowship from the NIH (F31CA228455) and J.Q. was supported by a NIH T32 training grant (5-T32-HG-000046–16).
DECLARATION OF INTERESTS
A.J.M. is a project member of the Parker Institute for Cancer Immunotherapy and has received research funding from Merck. He has also received honoraria and travel support from Merck, AstraZeneca, Pfizer, and Takeda. A.J.M. is an inventor on patents related to the IFN pathway, and A.J.M. and L.R.J. are inventors on a filed patent related to modified CAR T cells. J.L.B. is currently an employee of Bristol-Myers Squibb.
E.J.W. is a member of the Parker Institute for Cancer Immunotherapy and has consulting agreements with and/or is on the scientific advisory board for Merck, Roche, Pieris, Elstar, and Surface Oncology. E.J.W. has a patent licensing agreement on the PD-1 pathway with Roche/Genentech and is a founder of Arsenal Biosciences.
C.H.J. reports research funding from Novartis, and he is a scientific founder of Tmunity Therapeutics, for which he has founders stock but no income. C.H.J. also works under a research collaboration involving the University of Pennsylvania and the Novartis Institutes of Biomedical Research, Inc. and is an inventor of intellectual property licensed by the University of Pennsylvania to Novartis.
M.D.H. has received research funding from Bristol-Myers Squibb and is a paid consultant to Merck, Bristol-Myers Squibb, AstraZeneca, Genentech/Roche, Janssen, Nektar, Syndax, Mirati, and Shattuck Labs. He has received travel support/honoraria from AstraZeneca and Bristol-Myers Squibb. M.D.H. has a patent filed related to the use of tumor mutation burden to predict response to immunotherapy (PCT/US2015/062208), which has received licensing fees from PGDx.
J.D.W. is a consultant for Adaptive Biotech, Advaxis, Amgen, Apricity, Array BioPharma, Ascentage Pharma, Astellas, Bayer, Beigene, Bristol-Myers Squibb, Celgene, Chugai, Elucida, Eli Lilly, F Star, Genentech, Imvaq, Janssen, Kleo Pharma, Linneaus, MedImmune, Merck, Neon Therapuetics, Ono, Polaris Pharma, Polynoma, Psioxus, Puretech, Recepta, Trieza, Sellas Life Sciences, Serametrix, Surface Oncology and Syndax. He reports grants from Bristol-Myers Squibb, Medimmune, Merck, and Genentech, and honorarium from Esanex. J.D.W. has equity in Potenza Therapeutics, Tizona Pharmaceuticals, Adaptive Biotechnologies, Elucida, Imvaq, Beigene, Trieza and Linneaus. J.D.W. is also an inventor on patent applications related to work on DNA vaccines in companion animals with cancer, assays for suppressive myeloid cells in blood, oncolytic viral therapy, alphavirus-based vaccines, neo-antigen modeling, CD40, GITR, OX40, PD-1 and CTLA-4.
Footnotes
Publisher's Disclaimer: This is a PDF file of an unedited manuscript that has been accepted for publication. As a service to our customers we are providing this early version of the manuscript. The manuscript will undergo copyediting, typesetting, and review of the resulting proof before it is published in its final citable form. Please note that during the production process errors may be discovered which could affect the content, and all legal disclaimers that apply to the journal pertain.
REFERENCES
- Ahlenstiel G, Titerence RH, Koh C, Edlich B, Feld JJ, Rotman Y, Ghany MG, Hoofnagle JH, Liang TJ, Heller T, et al. (2010). Natural killer cells are polarized toward cytotoxicity in chronic hepatitis C in an interferon-alfa-dependent manner. Gastroenterology 138, 325–35.e1–2. [DOI] [PMC free article] [PubMed] [Google Scholar]
- Arce Vargas F, Furness AJS, Litchfield K, Joshi K, Rosenthal R, Ghorani E, Solomon I, Lesko MH, Ruef N, Roddie C, et al. (2018). Fc Effector Function Contributes to the Activity of Human Anti-CTLA-4 Antibodies. Cancer Cell 33, 649–663.e4. [DOI] [PMC free article] [PubMed] [Google Scholar]
- Ayers M, Lunceford J, Nebozhyn M, Murphy E, Loboda A, Kaufman DR, Albright A, Cheng JD, Kang SP, Shankaran V, et al. (2017). IFN-γ-related mRNA profile predicts clinical response to PD-1 blockade. J Clin Invest 127, 2930–2940. [DOI] [PMC free article] [PubMed] [Google Scholar]
- Benci JL, Xu B, Qiu Y, Wu TJ, Dada H, Twyman-Saint Victor C, Cucolo L, Lee DSM, Pauken KE, Huang AC, et al. (2016). Tumor Interferon Signaling Regulates a Multigenic Resistance Program to Immune Checkpoint Blockade. Cell 167, 1540–1554.e12. [DOI] [PMC free article] [PubMed] [Google Scholar]
- Breiman L (2001). Random forests. Machine Learning. [Google Scholar]
- Chen X, and Ishwaran H (2012). Random forests for genomic data analysis. Genomics 99, 323–329. [DOI] [PMC free article] [PubMed] [Google Scholar]
- Cheng L, Ma J, Li J, Li D, Li G, Li F, Zhang Q, Yu H, Yasui F, Ye C, et al. (2017). Blocking type I interferon signaling enhances T cell recovery and reduces HIV-1 reservoirs. J Clin Invest 127, 269–279. [DOI] [PMC free article] [PubMed] [Google Scholar]
- Chiossone L, Chaix J, Fuseri N, Roth C, Vivier E, and Walzer T (2009). Maturation of mouse NK cells is a 4-stage developmental program. Blood 113, 5488–5496. [DOI] [PubMed] [Google Scholar]
- Cortez VS, Ulland TK, Cervantes-Barragan L, Bando JK, Robinette ML, Wang Q, White AJ, Gilfillan S, Cella M, and Colonna M (2017). SMAD4 impedes the conversion of NK cells into ILC1-like cells by curtailing non-canonical TGF-β signaling. Nat Immunol 122, 91. [DOI] [PMC free article] [PubMed] [Google Scholar]
- Dadi S, Chhangawala S, Whitlock BM, Franklin RA, Luo CT, Oh SA, Toure A, Pritykin Y, Huse M, Leslie CS, et al. (2016). Cancer Immunosurveillance by Tissue-Resident Innate Lymphoid Cells and Innate-like T Cells. Cell 164, 365–377. [DOI] [PMC free article] [PubMed] [Google Scholar]
- Diamond MS, Kinder M, Matsushita H, Mashayekhi M, Dunn GP, Archambault JM, Lee H, Arthur CD, White JM, Kalinke U, et al. (2011). Type I interferon is selectively required by dendritic cells for immune rejection of tumors. Journal of Experimental Medicine 208, 1989–2003. [DOI] [PMC free article] [PubMed] [Google Scholar]
- Dighe AS, Richards E, Old LJ, and Schreiber RD (1994). Enhanced in vivo growth and resistance to rejection of tumor cells expressing dominant negative IFNγ receptors. Immunity 1, 447–456. [DOI] [PubMed] [Google Scholar]
- Fuertes MB, Kacha AK, Kline J, and Woo SR (2011). Host type I IFN signals are required for antitumor CD8+ T cell responses through CD8α+ dendritic cells. Journal of … [DOI] [PMC free article] [PubMed] [Google Scholar]
- Gao J, Shi LZ, Zhao H, Chen J, Xiong L, He Q, Chen T, Roszik J, Bernatchez C, Woodman SE, et al. (2016). Loss of IFN-γ Pathway Genes in Tumor Cells as a Mechanism of Resistance to Anti-CTLA-4 Therapy. Cell 1–18. [DOI] [PMC free article] [PubMed] [Google Scholar]
- Gao Y, Souza-Fonseca-Guimaraes F, Bald T, Ng SS, Young A, Ngiow SF, Rautela J, Straube J, Waddell N, Blake SJ, et al. (2017). Tumor immunoevasion by the conversion of effector NK cells into type 1 innate lymphoid cells. Nat Immunol 18, 1004–1015. [DOI] [PubMed] [Google Scholar]
- Gejman RS, Chang AY, Jones HF, DiKun K, Hakimi AA, Schietinger A, and Scheinberg DA (2018). Rejection of immunogenic tumor clones is limited by clonal fraction. eLife 7, 635. [DOI] [PMC free article] [PubMed] [Google Scholar]
- Harlin H, Meng Y, Peterson AC, Zha Y, Tretiakova M, Slingluff C, McKee M, and Gajewski TF (2009). Chemokine expression in melanoma metastases associated with CD8+ T-cell recruitment. Cancer Research 69, 3077–3085. [DOI] [PMC free article] [PubMed] [Google Scholar]
- Hellmann MD, Nathanson T, Rizvi H, Creelan BC, Sanchez-Vega F, Ahuja A, Ni A, Novik JB, Mangarin LMB, Abu-Akeel M, et al. (2018). Genomic Features of Response to Combination Immunotherapy in Patients with Advanced Non-Small-Cell Lung Cancer. Cancer Cell 33, 843–852.e844. [DOI] [PMC free article] [PubMed] [Google Scholar]
- Huang AC, Postow MA, Orlowski RJ, Mick R, Bengsch B, Manne S, Xu W, Harmon S, Giles JR, Wenz B, et al. (2017). T-cell invigoration to tumour burden ratio associated with anti-PD-1 response. Nature 545, 60–65. [DOI] [PMC free article] [PubMed] [Google Scholar]
- Huang M, Wang J, Torre E, Dueck H, Shaffer S, Bonasio R, Murray JI, Raj A, Li M, and Zhang NR (2018). SAVER: gene expression recovery for single-cell RNA sequencing. Nat Methods 15, 539–542. [DOI] [PMC free article] [PubMed] [Google Scholar]
- Hugo W, Zaretsky JM, Sun L, Song C, Moreno BH, Hu-Lieskovan S, Berent-Maoz B, Pang J, Chmielowski B, Cherry G, et al. (2016). Genomic and Transcriptomic Features of Response to Anti-PD-1 Therapy in Metastatic Melanoma. Cell 165, 35–44. [DOI] [PMC free article] [PubMed] [Google Scholar]
- Ishwaran H, Kogalur UB, Gorodeski EZ, Minn AJ, and Lauer MS (2010). High-Dimensional Variable Selection for Survival Data. Journal of the American Statistical Association 105, 205–217. [Google Scholar]
- Jiang P, Gu S, Pan D, Fu J, Sahu A, Hu X, Li Z, Traugh N, Bu X, Li B, et al. (2018). Signatures of T cell dysfunction and exclusion predict cancer immunotherapy response. Nat. Med 24, 1550–1558. [DOI] [PMC free article] [PubMed] [Google Scholar]
- Jiang Y, Qiu Y, Minn AJ, and Zhang NR (2016). Assessing intratumor heterogeneity and tracking longitudinal and spatial clonal evolutionary history by next-generation sequencing. Proc Natl Acad Sci USA 113, E5528–E5537. [DOI] [PMC free article] [PubMed] [Google Scholar]
- Levine JH, Simonds EF, Bendall SC, Davis KL, Amir E-AD, Tadmor MD, Litvin O, Fienberg HG, Jager A, Zunder ER, et al. (2015). Data-Driven Phenotypic Dissection of AML Reveals Progenitor-like Cells that Correlate with Prognosis. Cell 162, 184–197. [DOI] [PMC free article] [PubMed] [Google Scholar]
- Li H, van der Leun AM, Yofe I, Lubling Y, Gelbard-Solodkin D, van Akkooi ACJ, van den Braber M, Rozeman EA, Haanen JBAG, Blank CU, et al. (2019). Dysfunctional CD8 T Cells Form a Proliferative, Dynamically Regulated Compartment within Human Melanoma. Cell 176, 775–789.e18. [DOI] [PMC free article] [PubMed] [Google Scholar]
- Manguso RT, Pope HW, Zimmer MD, Brown FD, Yates KB, Miller BC, Collins NB, Bi K, LaFleur MW, Juneja VR, et al. (2017). In vivo CRISPR screening identifies Ptpn2 as a cancer immunotherapy target. Nature Publishing Group 547, 1–17. [DOI] [PMC free article] [PubMed] [Google Scholar]
- McGranahan N, Furness AJS, Rosenthal R, Ramskov S, Lyngaa R, Saini SK, Jamal-Hanjani M, Wilson GA, Birkbak NJ, Hiley CT, et al. (2016). Clonal neoantigens elicit T cell immunoreactivity and sensitivity to immune checkpoint blockade. Science 351, 1463–1469. [DOI] [PMC free article] [PubMed] [Google Scholar]
- Mezzadra R, Sun C, Jae LT, Gomez-Eerland R, de Vries E, Wu W, Logtenberg MEW, Slagter M, Rozeman EA, Hofland I, et al. (2017). Identification of CMTM6 and CMTM4 as PD-L1 protein regulators. Nature 549, 106–110. [DOI] [PMC free article] [PubMed] [Google Scholar]
- Miller BC, Sen DR, Abosy Al, R., Bi K, Virkud YV, LaFleur MW, Yates KB, Lako A, Felt K, Naik GS, et al. (2019). Subsets of exhausted CD8+ T cells differentially mediate tumor control and respond to checkpoint blockade. Nat Immunol 20, 326–336. [DOI] [PMC free article] [PubMed] [Google Scholar]
- Newman AM, Liu CL, Green MR, Gentles AJ, Feng W, Xu Y, Hoang CD, Diehn M, and Alizadeh AA (2015). Robust enumeration of cell subsets from tissue expression profiles. Nat Methods 12, 453–457. [DOI] [PMC free article] [PubMed] [Google Scholar]
- Pak-Wittel MA, Yang L, Sojka DK, Rivenbark JG, and Yokoyama WM (2013). Interferon-γ mediates chemokine-dependent recruitment of natural killer cells during viral infection. Proc Natl Acad Sci USA 110, E50–E59. [DOI] [PMC free article] [PubMed] [Google Scholar]
- Paley MA, Kroy DC, Odorizzi PM, Johnnidis JB, Dolfi DV, Barnett BE, Bikoff EK, Robertson EJ, Lauer GM, Reiner SL, et al. (2012). Progenitor and terminal subsets of CD8+ T cells cooperate to contain chronic viral infection. Science 338, 1220–1225. [DOI] [PMC free article] [PubMed] [Google Scholar]
- Patel SA, and Minn AJ (2018). Combination Cancer Therapy with Immune Checkpoint Blockade: Mechanisms and Strategies. Immunity 48, 417–433. [DOI] [PMC free article] [PubMed] [Google Scholar]
- Riaz N, Havel JJ, Makarov V, Desrichard A, Urba WJ, Sims JS, Hodi FS, Martín-Algarra S, Mandal R, Sharfman WH, et al. (2017). Tumor and Microenvironment Evolution during Immunotherapy with Nivolumab. Cell 171, 934–949.e15. [DOI] [PMC free article] [PubMed] [Google Scholar]
- Ribas A, and Wolchok JD (2018). Cancer immunotherapy using checkpoint blockade. Science 359, 1350–1355. [DOI] [PMC free article] [PubMed] [Google Scholar]
- Rizvi H, Sanchez-Vega F, La K, Chatila W, Jonsson P, Halpenny D, Plodkowski A, Long N, Sauter JL, Rekhtman N, et al. (2018). Molecular Determinants of Response to Anti-Programmed Cell Death (PD)-1 and Anti-Programmed Death-Ligand 1 (PD-L1) Blockade in Patients With Non-Small-Cell Lung Cancer Profiled With Targeted Next-Generation Sequencing. J. Clin. Oncol 36, 633–641. [DOI] [PMC free article] [PubMed] [Google Scholar]
- Rizvi NA, Hellmann MD, Snyder A, Kvistborg P, Makarov V, Havel JJ, Lee W, Yuan J, Wong P, Ho TS, et al. (2015). Mutational landscape determines sensitivity to PD-1 blockade in non-small cell lung cancer. Science 348, 124–128. [DOI] [PMC free article] [PubMed] [Google Scholar]
- Rodig SJ, Gusenleitner D, Jackson DG, Gjini E, Giobbie-Hurder A, Jin C, Chang H, Lovitch SB, Horak C, Weber JS, et al. (2018). MHC proteins confer differential sensitivity to CTLA-4 and PD-1 blockade in untreated metastatic melanoma. Sci Transl Med 10, eaar3342. [DOI] [PubMed] [Google Scholar]
- Romano E, Kusio-Kobialka M, Foukas PG, Baumgaertner P, Meyer C, Ballabeni P, Michielin O, Weide B, Romero P, and Speiser DE (2015). Ipilimumab-dependent cell-mediated cytotoxicity of regulatory T cells ex vivo by nonclassical monocytes in melanoma patients. Proc Natl Acad Sci USA 112, 6140–6145. [DOI] [PMC free article] [PubMed] [Google Scholar]
- Rosato PC, Wijeyesinghe S, Stolley JM, Nelson CE, Davis RL, Manlove LS, Pennell CA, Blazar BR, Chen CC, Geller MA, et al. (2019). Virus-specific memory T cells populate tumors and can be repurposed for tumor immunotherapy. Nat Comms 10, 567. [DOI] [PMC free article] [PubMed] [Google Scholar]
- Sade-Feldman M, Jiao YJ, Chen JH, Rooney MS, Barzily-Rokni M, Eliane J-P, Bjorgaard SL, Hammond MR, Vitzthum H, Blackmon SM, et al. (2017). Resistance to checkpoint blockade therapy through inactivation of antigen presentation. Nat Comms 8, 1136. [DOI] [PMC free article] [PubMed] [Google Scholar]
- Shin DS, Zaretsky JM, Escuin-Ordinas H, Garcia-Diaz A, Hu-Lieskovan S, Kalbasi A, Grasso CS, Hugo W, Sandoval S, Torrejon DY, et al. (2017). Primary Resistance to PD-1 Blockade Mediated by JAK1/2 Mutations. Cancer Discov 7, 188–201. [DOI] [PMC free article] [PubMed] [Google Scholar]
- Simoni Y, Becht E, Fehlings M, Loh CY, Koo S-L, Teng KWW, Yeong JPS, Nahar R, Zhang T, Kared H, et al. (2018). Bystander CD8+ T cells are abundant and phenotypically distinct in human tumour infiltrates. Nature 557, 575–579. [DOI] [PubMed] [Google Scholar]
- Simpson TR, Li F, Montalvo-Ortiz W, Sepulveda MA, Bergerhoff K, Arce F, Roddie C, Henry JY, Yagita H, Wolchok JD, et al. (2013). Fc-dependent depletion of tumor-infiltrating regulatory T cells co-defines the efficacy of anti-CTLA-4 therapy against melanoma. Journal of Experimental Medicine 210, 1695–1710. [DOI] [PMC free article] [PubMed] [Google Scholar]
- Snell LM, McGaha TL, and Brooks DG (2017). Type I Interferon in Chronic Virus Infection and Cancer. Trends Immunol 38, 542–557. [DOI] [PMC free article] [PubMed] [Google Scholar]
- Snyder A, Makarov V, Merghoub T, Yuan J, Zaretsky JM, Desrichard A, Walsh LA, Postow MA, Wong P, Ho TS, et al. (2014). Genetic basis for clinical response to CTLA-4 blockade in melanoma. N Engl J Med 371, 2189–2199. [DOI] [PMC free article] [PubMed] [Google Scholar]
- Spits H, Bernink JH, and Lanier L (2016). NK cells and type 1 innate lymphoid cells: partners in host defense. Nat Immunol 17, 758–764. [DOI] [PubMed] [Google Scholar]
- Taube JM, Anders RA, Young GD, Xu H, Sharma R, McMiller TL, Chen S, Klein AP, Pardoll DM, Topalian SL, et al. (2012). Colocalization of inflammatory response with B7-h1 expression in human melanocytic lesions supports an adaptive resistance mechanism of immune escape. Sci Transl Med 4, 127ra37–127ra37. [DOI] [PMC free article] [PubMed] [Google Scholar]
- Teijaro JR, Ng C, Lee AM, Sullivan BM, Sheehan KCF, Welch M, Schreiber RD, Carlos de la Torre J, and Oldstone MBA (2013). Persistent LCMV Infection Is Controlled by Blockade of Type I Interferon Signaling. Science 340, 207–211. [DOI] [PMC free article] [PubMed] [Google Scholar]
- Tirosh I, Izar B, Prakadan SM, Wadsworth MH, Treacy D, Trombetta JJ, Rotem A, Rodman C, Lian C, Murphy G, et al. (2016). Dissecting the multicellular ecosystem of metastatic melanoma by single-cell RNA-seq. Science 352, 189–196. [DOI] [PMC free article] [PubMed] [Google Scholar]
- Tumeh PC, Harview CL, Yearley JH, Shintaku IP, Taylor EJM, Robert L, Chmielowski B, Spasic M, Henry G, Ciobanu V, et al. (2014). PD-1 blockade induces responses by inhibiting adaptive immune resistance. Nature 515, 568–571. [DOI] [PMC free article] [PubMed] [Google Scholar]
- Twyman-Saint Victor C, Rech AJ, Maity A, Rengan R, Pauken KE, Stelekati E, Benci JL, Xu B, Dada H, Odorizzi PM, et al. (2015). Radiation and dual checkpoint blockade activate non-redundant immune mechanisms in cancer. Nature 520, 373–377. [DOI] [PMC free article] [PubMed] [Google Scholar]
- Weichselbaum RR, Ishwaran H, Yoon T, Nuyten DSA, Baker SW, Khodarev N, Su AW, Shaikh AY, Roach P, Kreike B, et al. (2008). An interferon-related gene signature for DNA damage resistance is a predictive marker for chemotherapy and radiation for breast cancer. Proc Natl Acad Sci USA 105, 18490–18495. [DOI] [PMC free article] [PubMed] [Google Scholar]
- Wilson EB, Yamada DH, Elsaesser H, Herskovitz J, Deng J, Cheng G, Aronow BJ, Karp CL, and Brooks DG (2013). Blockade of Chronic Type I Interferon Signaling to Control Persistent LCMV Infection. Science 340, 202–207. [DOI] [PMC free article] [PubMed] [Google Scholar]
- Zaretsky JM, Garcia-Diaz A, Shin DS, Escuin-Ordinas H, Hugo W, Hu-Lieskovan S, Torrejon DY, Abril-Rodriguez G, Sandoval S, Barthly L, et al. (2016). Mutations Associated with Acquired Resistance to PD-1 Blockade in Melanoma. N Engl J Med 375, 819–829. [DOI] [PMC free article] [PubMed] [Google Scholar]
- Zhang Q, Bi J, Zheng X, Chen Y, Wang H, Wu W, Wang Z, Wu Q, Peng H, Wei H, et al. (2018). Blockade of the checkpoint receptor TIGIT prevents NK cell exhaustion and elicits potent anti-tumor immunity. Nat Immunol 19, 723–732. [DOI] [PubMed] [Google Scholar]
Associated Data
This section collects any data citations, data availability statements, or supplementary materials included in this article.
Supplementary Materials
Figure S1. ISGs and immune cell populations expressed in human melanoma, Related to Figure 1. A) Boxplots of ISG metagene expression in immune cell populations determined by single-cell RNA-seq of human melanoma. The width of the boxplots for the indicated cell types are proportional to the population size (of note, immune and cancer cells were sorted before sequencing). P-values for comparisons between cancer cells and each immune population are p<0.001. B) Gene set enrichment analysis of cancer and resistance-associated ISGs (ISG.RS) and IFNG-related ISGs (IFNG.GS) in melanoma patients who fail to respond to anti-PD1. Shown are enrichment plots along with the normalized enrichment score (NES) and p-value. The leading edge for the ISG.RS is labeled. C) Relative frequencies of immune populations in the melanoma tumors inferred by CIBERSORT. For immune cell types with both resting and activated populations, the difference between activated and resting was used. D) Multivariable random forest model for probability of response for melanoma patients treated with anti-PD1. Shown are the adjusted effects of model variables on the probability of response (left plots, yellow boundaries indicate one standard error) and variable importance scores (right plot). Predictor values are metagene expression values for ISG.RS and IFNG.GS or log10 frequency for TMB. Variable importance score represents the increase in classification error rate when the variable is perturbed. The classification error rate for the model is 36%. E) Random forest model with variable selection based on minimal depth was performed on bootstrapped samples. Variables include inferred frequencies of various immune populations (based on CIBERSORT), the ratio of IFNG.GS to ISG.RS (dISG), TMB, and other control variables. Shown are the frequencies that each variable was selected based on minimal depth after resampling versus the average variable importance score (VIMP). The inset shows the distribution of the number of variables in each bootstrapped model. Similar results were also obtained with lasso and logistic regression.
Figure S2. Effect of blocking tumor IFN signaling on baseline and inducible MHC-I expression, Related to Figure 2. Constitutive and IFNG-inducible expression of MHC-I on A) TSA/237 breast cancer cells and B) B16 melanoma cells in vitro.
Figure S3. Immune cell requirements for response after IFNGR knockout, Related to Figure 3. A) Representative density plots of tumor infiltrating CD45+ lymphoid cells that are either NK1.1+ or CD8+ after control (top) or depletion with anti-NK1.1 (bottom left) or anti-CD8 (bottom right). B) Ectopic expression of human CD19 on B16 and Res 499 melanoma cells. C) Tumor growth of B16 and Res 499 tumors expressing human CD19 with (IFNA/GR KO) and without (Cont) concurrent IFNGR + IFNAR knockout. D) Baseline and IFNG-inducible expression of MHC-I and PDL1 on Res 499 cells with or without knockout of IFNGR and/or B2M. E) Survival after tumor rechallenge of mice with initial complete responses to anti-CTLA4 (n=7). Res 499 cells with IFNGR knockout were used for both initial transplantation and rechallenge. F) In vitro NK-mediated cytotoxicity of Res 499 cells with B2M or IFNGR knockout after pre-treating tumor cells with IFNG prior to co-culture. CD107a expression by NK cells was used as a surrogate for engagement of cytotoxic function. G) Median (dot) and the 25th and 75th percentile survival of mice bearing IFNGR knockout Res 499 tumors following treatment with anti-CTLA4 (aCTLA4) or control (Cont). Shown are effects of NK/ILC1 depletion with an anti-NK1.1 antibody (aNK1.1) and of CD4 or CD8 T cell depletion with an anti-CD4 (aCD4) or anti-CD8 antibody (aCD8). H) Survival of mice bearing TSA/Res 237 tumors with IFNGR knockout after anti-CTLA4 and prior depletion of CD8 T cells or NK/ILCs with either anti-CD8 (aCD8) or anti-Asialo-GM1 (aAGM), respectively. For all groups, n=5–10. On the left is a representative scatter plot of CD3– NKp46+ intratumoral immune cells after control and depletion with anti-Asialo-GM1.
Figure S4. Improved TEX function and NK/ILC1 maturation after blocking tumor IFNG signaling, Related to Figure 4. A) Violin plots showing expression of the indicated genes in CD8 T cells from Res 499 wild type (WT) or IFNGR knockout (KO) tumors. B) Intracellular IFNG expression in tumor-infiltrating CD44+ PD1+ CD8+ T cells and C) intratumoral IL6 protein levels from wild type or IFNGR knockout Res 499 tumors treated with or without anti-CTLA4. Effect of antibody-mediated CD8 T cell depletion (aCD8) on IL6 levels was also examined. D) GSEA comparing ILC1 cluster to other NK cell clusters using genes increased or decreased in ILC1s relative to conventional NK cells. E) Dimensionality reduction and cluster identification were performed on TCRB+ CD8+ T cells or TCRB– NK1.1+ NK/ILC1s. Shown are heatmaps of the scaled MFI for each of the indicated markers across the identified clusters (labels below heatmap). For CD8 T cells, clusters representing PD1+ Eomes+ TEX are denoted in red. For NK/ILC1s, clusters in red denote CD11bhigh innate immune cells. F) Contour plots showing the distribution of CD8 T cells after anti-CTLA4 (top) or of NK/ILC1s at baseline (bottom) in either wildtype or IFNGR knockout Res 499 tumors. Individual cells corresponding to the contour plot are overlaid and colored by the scaled MFI of the indicated marker. G) Density plots of CD8 T cells or NK/ILC1s in wildtype or IFNGR knockout Res 499 tumors treated with or without anti-CTLA4. The left plot is a tSNE map. For CD8 T cells, clusters for PD1+ Eomes+ TEX with low or high expression of GzmB and Ki67 are color-coded and numbered. For NK/ILC1s, clusters enriched for CD11bhigh NK cells or PD1+ TRAIL+ ILC1 cells are color-coded and numbered. The cluster numbers correspond to the cluster labels shown in the heatmap from (E).
Figure S5. Regulatory roles for IFNG, PD1/PDL1, and TRAIL/TRAILR2 after tumor IFNGR knockout, Related to Figure 5. A) Representative scatter plots for the percent of peripheral CD8 and CD4 T cells after adoptive transfer of T cells from either wild type or IFNG-deficient mice into Rag1 knockout hosts. The plot on the far left is from a wild type mouse and is shown for comparison. Percentages relative to CD45+ cells are indicated. The percentage of peripheral CD4 and CD8 T cells after adoptive transfer for all mice are also shown (right plot). Values from the same mouse are connected. B) Proportion of mature CD27– CD11b+ NK/ILC1s in Res 499 tumors after CD8 T cell depletion (aCD8). Representative flow cytometry contour plots are shown. C) Survival of CD8 T cell-depleted mice after treatment with anti-CTLA4 with or without intratumoral injection of IFNG. Effect of anti-NK1.1 treatment to deplete NK/ILC1s is also shown. For each group, n=5. D) Expression of ectopic PDL1 and baseline or IFNG-induced MHC-I in Res 499 cells with or without IFNGR knockout. E) Survival benefit from anti-CTLA4 conferred by IFNGR knockout in Res 499 tumors. Shown are hazard ratios and standard errors for wild type tumors, tumors with ectopic expression of PDL1 (PDL1hi), or concurrent knockout of B2M. F) Expression of PD1 on CD49b– CD49a+ or CD49b+ CD49a– liver NK cells. G) In vitro TRAIL receptor (TRAILR2) expression after IFNG treatment on Res 499 cells with or without IFNGR knockout. H) Expression of TRAILR2, MHC-I, and PDL1 in Res 499 cells with or without concurrent knockout of TRAILR2 and IFNGR. Baseline and IFNG-inducible expression are shown.
Figure S6. Role of Treg depletion in response after tumor IFNGR knockout, Related to Figure 6. A) Survival of mice bearing Res 499 IFNGR knockout tumors treated with either a Treg-depleting (9H10) or non-depleting (4F10) anti-CTLA4 antibody. For each group, n=5. B). Expression of MHC-I on CT26 cells after IFNGR + B2M double knockout.
Figure S7. Tumor variants in IFN pathway genes predict improved response and survival of lung cancer patients after anti-CTLA4 and anti-PD1, Related to Figure 7. A) CADD and DANN, which predict deleterious missense/nonsense variants, was used on ClinVar data to classify benign vs. pathogenic missense/nonsense variants. Shown is the ROC accuracy as a function of algorithm score. The cut point giving the highest accuracy (dashed line) is shown. B) Predicted pathogenic non-synonymous variants in one of 11 core IFN pathway genes (IFN Path Var) from 710 NSCLC tumors from TCGA. Variant type is indicated by color. For missense/nonsense variants, scores from CADD and DANN are shown (top two plots). For frameshift indels, SIFT confidence scores are shown (bottom plot). SIFT information for two indels was not available. The mean value for benign ClinVar variants is indicated (solid line) as are the optimal cut points for classification as a pathogenic missense/nonsense variant (dashed line). C) Tumor variant allele frequency (VAF) for IFN Path Vars (represented by circle size). D) Expression of IFNG.GS across TCGA patients. The IFN Path Var status is shown above the heatmap. E) Univariate hazard ratios and p-values for progression-free survival of 75 NSCLC patients treated with anti-CTLA4 + anti-PD1 stratified by the presence or absence of a variant in at least one of 11 random genes. Density plots show results from 10,000 bootstrap samples. Dashed lines represent observed values from IFN pathway variant positive patients. The relative frequency of samples that exceed these observed values is indicated. F) Survival of TCGA NSCLC patients stratified by IFN Path Var status. G) Boxplot of predicted out-of-bag response rate and TMB for 75 NSCLC patients treated with anti-CTLA4 + anti-PD1 and stratified by IFN Path Var status. The best overall response for each patient is color coded. H) Variable importance scores (left plot) from a multivariable random forest model for clinical response to anti-CTLA4 + anti-PD1 (unbiased error rate of 30.1%) and predicted out-of-bag (OOB) probability of response (right plot). OOB predicted probabilities are from samples not used to generate the model. Actual observed response is color-coded. I) Percent PDL1 for NSCLC patients stratified by the presence or absence of a variant in at least one of 11 random genes. Density plots show results from 10,000 bootstrap samples. Dashed lines represent observed values from IFN pathway variant positive patients. The relative frequency of samples that exceed these observed values is indicated.
Data Availability Statement
All software used in this study are open source and/or publicly available. The datasets generated or used in this study are available at the Gene Expression Omnibus (GEO) at http://www.ncbi.nlm.nih.gov/geo, provided as supplementary data from cited studies, or available through other cited public repositories.
Software
The R language and environment for statistical computing and graphics (https://www.r-project.org) was used for statistical and bioinformatics analysis. R packages described in methods were obtained from Bioconductor (https://www.bioconductor.org) or from CRAN (https://cran.r-project.org/web/packages/). These packages and additional software for processing, alignment, and analysis of sequencing data are listed in the Key Resources Table.
Data Resources
Mouse sequencing data
The RNA sequencing data for sorted Res 499 tumor cells is available from the GEO under accession number GSE83848. The single-cell RNA sequencing data for immune cells from Res 499 tumors and whole-exome sequencing data from sorted B16 and Res 499 tumors have been deposited under accession number GSE131927.
Human gene expression data
Normalized transcriptomic data, summarized exome analysis, and annotations for human melanoma patients treated with anti-PD1 were previously described (Hugo et al., 2016; Riaz et al., 2017) and downloaded from the GEO under accession number GSE78220 or on GitHub at https://github.com/riazn/bms038_analysis. Single-cell RNA-sequencing data from melanoma patients (Tirosh et al., 2016) were downloaded from the GEO under accession number GSE72056.
Human lung cancer variant data
Processed variant data from non-small cell lung cancer patients treated with anti-PD1 and anti-CTLA4 and from TCGA have been previously described and made available as supplementary information (Hellmann et al., 2018).
ClinVar data
All available data from ClinVar were downloaded from the FTP link available at the website (https://www.ncbi.nlm.nih.gov/clinvar).