Significance Statement
Hyperphosphatemia is common in the later stages of CKD and treatment options are limited to dietary phosphate restriction and oral phosphate binders. The sodium-phosphate cotransporter Npt2a, which mediates a large proportion of phosphate reabsorption in the kidney, might be a good therapeutic target for new medications for hyperphosphatemia. The authors show that pharmacologic inhibition of Npt2a in mice not only causes a dose-dependent phosphaturia, reductions in plasma phosphate levels, and suppression of parathyroid hormone, but also increases urinary excretion of sodium, chloride, and calcium. It does this without affecting urinary potassium excretion, flow rate, or pH. The results show for the first time that a novel Npt2a inhibitor has potential as a treatment for kidney disease-related hyperphosphatemia.
Keywords: calcium, Cell & Transport Physiology, chronic kidney disease, electrolytes, hyperphosphatemia, phosphate uptake
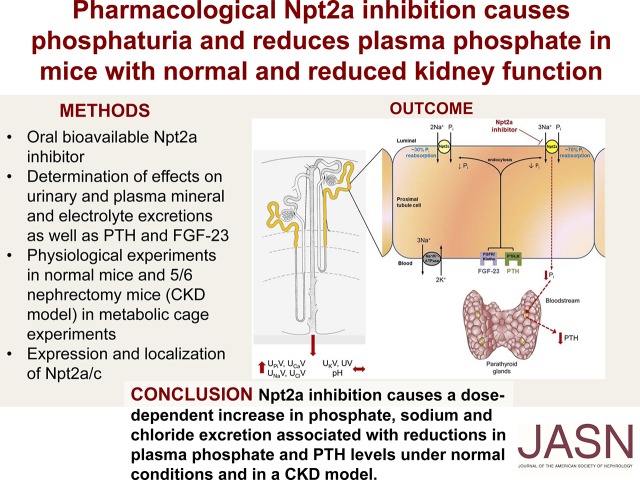
Visual Abstract
Abstract
Background
The kidneys play an important role in phosphate homeostasis. Patients with CKD develop hyperphosphatemia in the later stages of the disease. Currently, treatment options are limited to dietary phosphate restriction and oral phosphate binders. The sodium-phosphate cotransporter Npt2a, which mediates a large proportion of phosphate reabsorption in the kidney, might be a good therapeutic target for new medications for hyperphosphatemia.
Methods
The authors assessed the effects of the first orally bioavailable Npt2a inhibitor (Npt2a-I) PF-06869206 in normal mice and mice that had undergone subtotal nephrectomy (5/6 Nx), a mouse model of CKD. Dose-response relationships of sodium, chloride, potassium, phosphate, and calcium excretion were assessed in response to the Npt2a inhibitor in both groups of mice. Expression and localization of Npt2a/c and levels of plasma phosphate, calcium, parathyroid hormone (PTH) and fibroblast growth factor 23 (FGF-23) were studied up to 24-hours after Npt2a-I treatment.
Results
In normal mice, Npt2a inhibition caused a dose-dependent increase in urinary phosphate (ED50 approximately 21 mg/kg), calcium, sodium and chloride excretion. In contrast, urinary potassium excretion, flow rate and urinary pH were not affected dose dependently. Plasma phosphate and PTH significantly decreased after 3 hours, with both returning to near baseline levels after 24 hours. Similar effects were observed in the mouse model of CKD but were reduced in magnitude.
Conclusions
Npt2a inhibition causes a dose-dependent increase in phosphate, sodium and chloride excretion associated with reductions in plasma phosphate and PTH levels in normal mice and in a CKD mouse model.
Inorganic phosphate (Pi) is an important mineral within the body. The intestine and kidneys play important roles in Pi homeostasis, whereas bone acts as a storage compartment.1 Absorption of Pi from the diet occurs in the small intestine, with a large proportion being via the type 2 sodium-dependent phosphate cotransporter Npt2b (SLC34A2), which accounts for approximately 50% of the overall intestinal Pi absorption.2 In the proximal tubule of the kidney, the type 2 sodium-dependent phosphate cotransporters Npt2a (SLC34A1), Npt2c (SLC34A3), and type 3 sodium-dependent phosphate cotransporter Pit2 (SLC20A2) mediate Pi reabsorption.3 Fractional Pi excretion is between 5% and 20% depending on dietary Pi content. Parathyroid hormone (PTH) and fibroblast growth factor 23 (FGF-23) are the primary regulators of renal Pi excretion, both mediating the retrieval of Npt2a/c from the luminal membrane.4 The contribution of Npt2a and Npt2c for renal Pi transport has been delineated in gene-targeted mice and mutations of Pi transporters in humans. Studies in Npt2a knockout mice (Npt2a−/−) identified that Npt2a contributes to 70% of renal Pi reabsorption.5 Npt2c−/− mice do not have a Pi phenotype but exhibited hypercalcemia (only at 4 weeks of age), hypercalciuria, and increased 1,25-dihydroxyvitamin D3 levels.6 In contrast, kidney-specific Npt2c knockout mice did not show any differences in urinary Pi and calcium excretion, or plasma levels of Pi, calcium, PTH, or FGF-23 levels.7 Npt2a/c double knockout mice display a blend of both phenotypes: hypophosphatemia, more severe phosphaturia, increased 1,25-dihydroxyvitamin D3 levels, and hypercalciuria.8 Humans with heterozygous mutations in the Npt2a gene presenting with urolithiasis or bone demineralization have hypophosphatemia and urinary Pi loss.9 Single nucleotide deletions, compound heterozygous deletions, and missense mutations in the Npt2c gene are the cause of hereditary hypophosphatemic rickets with hypercalciuria.10–12 In mice, gene deletion of another Pi transporter, Pit2, does not affect urinary Pi and calcium excretion, plasma Pi, calcium, PTH, or FGF-23 levels when fed a control diet.13
Treatment of hyperphosphatemia is limited to a few options: dietary Pi restriction, oral Pi binders,14 sodium-hydrogen exchanger isoform 3 (NHE3) inhibitors (currently not approved),15 and nicotinamide.16 Recently, an orally nonabsorbable Npt2b inhibitor was developed with the vision of inhibiting intestinal Pi uptake.17 Unfortunately, this compound was ineffective in reducing plasma Pi levels in healthy volunteers or patients with ESKD.17 The aim here was to examine for the first time the in vivo role of an orally absorbable, selective Npt2a inhibitor (Npt2a-I), PF-06869206. The effect of this Npt2a-I on urinary Pi and calcium excretion, plasma levels of Pi and calcium, as well as the effect on PTH and FGF-23 levels was determined under normal conditions and in a model of CKD. The data demonstrate for the first time that pharmacologic Npt2a inhibition causes dose-dependent phosphaturia associated with decreased plasma Pi and PTH levels. Pharmacologic Npt2a inhibition could be a valuable tool to increase renal Pi excretion to treat conditions associated with hyperphosphatemia.
Methods
All animal experimentation was conducted in accordance with the Guide for Care and Use of Laboratory Animals (National Institutes of Health, Bethesda, MD) and was approved by the local Institutional Animal Care and Use Committee (reference 3338R). Male C57BL/6J mice were purchased from the Jackson Laboratories (000664; Bar Harbor, ME). Mice were housed under a 12-hour light/dark cycle in isolated, ventilated cages with free access to standard rodent chow (TD.2018; 0.7% phosphate, 1% calcium; Envigo, Madison, WI) and tap water. Experiments were performed on 3- to 5-month-old mice.
Short-Term Metabolic Cage Experiments
Mice were randomized to acute application, via oral gavage (1% of body weight), of vehicle (5% DMSO, 5% Cremophor EL, 90% sterile water) or Npt2a-I (PF-06869206, 0.3–300 mg/kg; Pfizer Worldwide Research & Development, Cambridge, MA). The synthesis of PF-06869206 and pharmacokinetic data were described recently.18 The reported t1/2 after 1 mg/kg intravenous administration was 45 minutes.18 After their bladders were emptied (urine was obtained by picking up the mice to elicit reflex urination and holding them over a clean petri dish for sample collection), the mice were given vehicle or Npt2a-I by oral gavage and placed in metabolic cages for quantitative urine collection over 3 hours without access to food or water.19 Urine was analyzed as described below.
Twenty-Four-Hour Metabolic Cage Experiments
Mice were randomized to acute application, via oral gavage, of vehicle or Npt2a-I (30 mg/kg). Because mice underwent several rounds of acute metabolic cage experiments, mice were not further acclimatized for 24-hour metabolic cage experiments. After their bladders were emptied, mice were placed in metabolic cages at 9:00 for quantitative urine collection for 24 hours with free access to food and water. Urine was collected at 3, 6, 12, and 24 hours.20 After each collection period, the bladders were emptied, as described above, to assure complete collection. Urine was analyzed as described below.
Blood Chemistry after Ntp2a Inhibition
To determine time-dependent changes in plasma Pi, calcium, PTH, and FGF-23 in response to Npt2a inhibition, vehicle or Npt2a-I (30 mg/kg by oral gavage) were administered. C57Bl/6J mice were briefly anesthetized with isoflurane and blood withdrawn from the retro-orbital plexus at baseline (0 minutes), after 3 and 24 hours. Each time, 40 µl of blood was collected. In time-course experiments, blood was collected in a similar manner at baseline (0 minutes) after 1, 2, 3, and 24 hours. Only 20 µl of blood was collected for determination of plasma Pi. After centrifugation, plasma was analyzed as described below. In another cohort of mice, plasma concentrations of sodium, chloride, potassium, pH, and bicarbonate were determined at baseline and 3 hours after administration of vehicle or Npt2a-I using a blood gas analyzer (OPTIMedical, Roswell, GA).
Western Blotting and Immunohistochemistry
Another cohort of mice was randomized for acute application of vehicle or Npt2a-I (30 mg/kg by oral gavage) and anesthetized by ketamine/xylazine after 3 or 24 hours. The left kidney was immediately removed and total kidney homogenates or plasma membrane–enriched samples (by centrifugation at 17,000 × g) were prepared for Western blotting.21–23 Proteins were transferred to polyvinylidene difluoride membranes and immunoblotted with Npt2a,20,23 Npt2c,20,23 total NHE3,20,24 or phosphorylated serine residue 552–NHE3 (Novus Biologicals, Littleton, CO). Chemiluminescent detection was performed with ECL Plus (Amersham, Piscataway, NJ). Signal intensity in specific bands was quantified using Image Studio Lite (Qiagen, Hilden, Germany) densitometry analysis. Proteasome 20S was used as loading control (Abcam, Cambridge, United Kingdom). The right kidney was perfused in vivo with 4% paraformaldehyde in PBS and fixed overnight in the same solution. Kidney sectioning and labeling were performed as previously described.22,23,25
PTH Administration
Mice were randomized to either acute application of PTH vehicle (sterile water, 2 µl/g body wt, intraperitoneally) with Npt2a-I vehicle (see above, oral gavage), PTH (200 µg/kg body wt, intraperitoneally; GenScript, Piscataway, NJ)23,26,27 with Npt2a-I vehicle, PTH vehicle with Npt2a-I, or PTH with Npt2a-I. PTH or PTH vehicle were applied 30 minutes before Npt2a-I or Npt2a-vehicle application. After their bladders were emptied, the mice were placed in metabolic cages for quantitative urine collection over 3 hours without access to food or water. Urine was analyzed as described below.
CKD Model
A 5/6 (subtotal) nephrectomy (Nx) model was used to mimic CKD. Surgery was performed at the Jackson Laboratories. The surgery follows a two-stage procedure. First, around each pole of the left kidney, at its one-third position, two ligatures are placed and the poles excised. One week thereafter, a right-side Nx is performed. One week after recovery, mice were received at the University of South Florida. Fluid and food intake were determined in their home cages daily, and body weight was determined every other day. Eight weeks after the last surgery, mice were used for experiments (short-term metabolic cage experiments as well as blood collections, as described above). GFR was determined in conscious mice using plasma kinetics of FITC-Sinistrin after a single intravenous injection 10 weeks after surgery.28,29
Analysis of Plasma and Urine Samples
All clinical chemistry was performed using commercially available assays that were modified to work with small volumes.20,28 Phosphate and calcium in plasma and urine were determined using Inorganic Phosphorous Reagent and Calcium Arsenazo III Reagent, respectively (Pointe Scientific, Canton, MI). Urinary chloride was analyzed by the thiocyanide method (Stanbio Laboratory, Boerne, TX). Urinary sodium and potassium concentrations were measured by flame photometry (BWB Technologies, Newbury, United Kingdom). Urinary glucose and creatinine were determined using Infinity Glucose Hexokinase and Infinity Creatinine Liquid Stable Reagent (Thermo Fisher Scientific), respectively. Urinary l-amino acids were determined using a commercial assay (MAK002; Sigma-Aldrich). PTH (Quidel, San Diego, CA) and intact FGF-23 (Quidel) were determined according to the manufacturer instructions. Urinary pH was determined using a pH electrode (9810BN; Thermo Fisher Scientific).
Statistical Analyses
The data are expressed as mean±SEM. Unpaired and paired t tests were performed, as appropriate, to analyze for statistical differences between and within groups. One-way and two-way ANOVA, repeated measure where applicable, were used for comparison of several experimental curves and procedures followed by the Dunnett, Newman–Keuls and Tukey post hoc tests (all data analyzed via GraphPad Prism, San Diego, CA, and SigmaPlot, San Jose, CA). P<0.05 was considered statistically significant.
Results
Npt2a Inhibition Causes Dose-Dependent Phosphaturia
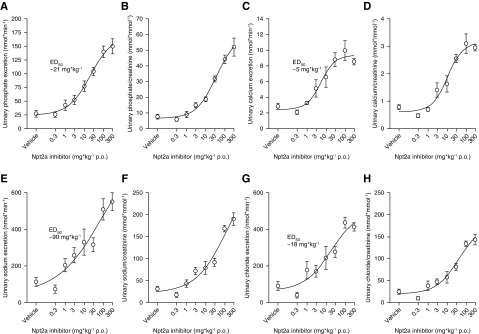
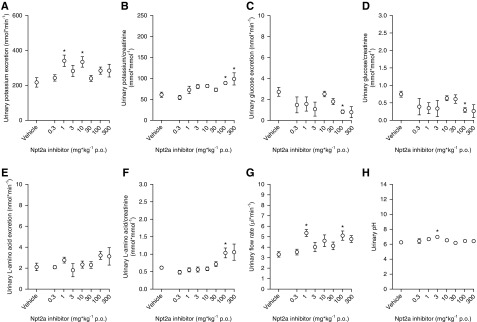
Administration of Npt2a-I via oral gavage caused a dose-dependent increase in urinary Pi excretion from 27±6 nmol/min in response to vehicle to a maximum of 150±14 nmol/min at 300 mg/kg (50% effective dose of 21 mg/kg) over a 3-hour period (Figure 1A). In addition, Npt2a inhibition resulted in a dose-dependent increase in urinary calcium excretion from 2.8±0.4 to 8.5±0.4 nmol/min (Figure 1C), urinary sodium excretion from 113±24 to 551±48 nmol/min (Figure 1E), and urinary chloride excretion from 90±24 to 413±22 nmol/min (Figure 1G). Similar results were obtained when minerals and electrolytes were related to urinary creatinine (Figure 1, B, D, F, and H). In contrast, urinary potassium excretion and urinary potassium/creatinine ratios (Figure 2, A and B), urinary glucose excretion and urinary glucose/creatinine ratios (Figure 2, C and D), urinary l-amino acid excretion and urinary l-amino acid/creatinine ratios (Figure 2, E and F), urinary flow rate (Figure 2G), and urinary pH (Figure 2H) did not show a clear dose dependence and there was no significant difference between the response to vehicle and the maximum response observed at 300 mg/kg. The percentage changes of urinary excretions are shown in Supplemental Figure 1, A–H.
Figure 1.
Short-term Npt2a inhibition causes a dose-dependent increase in urinary phosphate, calcium, sodium, and chloride excretion. Response to acute oral (p.o.) application of Npt2a-I (0.3–300 mg/kg via oral gavage) or vehicle in short-term (3 hour) metabolic cage experiments. (A) Dose-dependent increase in urinary phosphate excretion in absolute terms (50% effective dose [ED50] of 21 mg/kg), and (B) when corrected by urinary creatinine. (C and D) Similar effects were observed for calcium, (E and F) sodium, and (G and H) chloride. Data are expressed as mean±SEM. n=6–14 for 0.3–100 mg/kg; n=3 for 300 mg/kg.
Figure 2.
Short-term Npt2a inhibition does not result in a clear dose-dependent effect on urinary potassium, glucose, or L-amino acid excretion, urinary flow rate, or urinary pH. Response to acute oral (p.o.) application of Npt2a-I (0.3–300 mg/kg via oral gavage) or vehicle in short-term (3 hour) metabolic cage experiments. (A) A clear dose-dependent increase in urinary potassium excretion in absolute terms, and (B) when corrected by urinary creatinine, was absent. Similar results were obtained for urinary glucose (C) and L-amino acid excretion (E) in absolute terms and when corrected by urinary creatinine (D and F, respectively). There was also no effect on urinary flow rate (G) or urinary pH (H). Data were analyzed by two-way ANOVA followed by the Dunnett multiple comparisons test and are expressed as mean±SEM. n=6–14 for 0.3–100 mg/kg; n=3 for 300 mg/kg. *P<0.05 versus vehicle.
Changes in Plasma Electrolytes and Minerals, PTH, and FGF-23 after Npt2a Inhibition
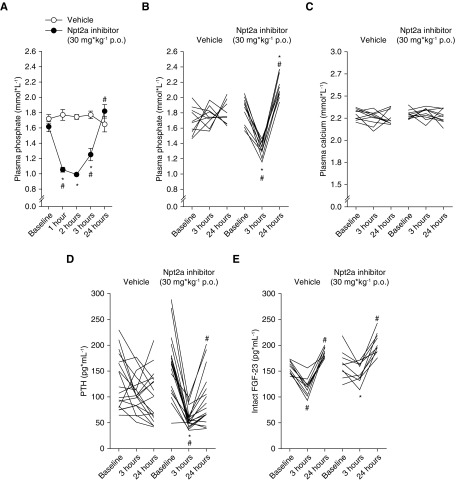
Next, we determined if the increased urinary excretion of Pi, calcium, sodium, and chloride in response to the Npt2a-I affects the plasma concentrations of electrolytes and minerals as well as PTH and FGF-23. A time course of Npt2a inhibition (30 mg/kg) on plasma Pi levels identified a rapid decrease in plasma Pi (−0.6 mmol/L) after 1 hour (Figure 3A) that started to recover after 3 hours and returned to relatively normal levels after 24 hours. This fits well with the expected t1/2 of the Npt2a-I (approximately 45 minutes).18 We studied the 3-hour time point in all other acute experiments. In another set of experiments, compared with baseline, vehicle application (Figure 3B) did not change plasma Pi concentrations after 3 or 24 hours. Once again, Npt2a-I (Figure 3B) caused a decrease in plasma Pi concentrations after 3 hours followed by an increase after 24 hours.
Figure 3.
Npt2a inhibition decreases plasma phosphate and PTH levels without affecting plasma calcium. Plasma phosphate significantly decreased (A) after 1 hour followed by (A and B) an increase after 24 hours. Acute oral (p.o.) vehicle application did not significantly affect plasma phosphate. (C) Plasma calcium levels were not affected by vehicle or Npt2a-I. (D) PTH significantly decreased after 3 hours followed by an increase after 24 hours. Vehicle application did not significantly affect PTH levels. (E) Intact FGF-23 levels significantly decreased after 3 hours followed by a significant increase after 24 hours in response to vehicle application. In contrast, the decrease after 3 hours was absent in response to Npt2a-I; however, a small but significant increase was present after 24 hours. Data were analyzed (A) by two-way ANOVA and (B–E) repeated measures two-way ANOVA, followed by the Tukey multiple comparisons test, and are expressed as mean±SEM. n=6–18. *P<0.05 versus vehicle, #P<0.05 versus previous time point.
Neither vehicle nor Npt2a-I application (Figure 3C) changed plasma calcium concentrations after 3 or 24 hours. Compared with baseline, vehicle application (Figure 3D) did not change plasma PTH concentrations after 3 or 24 hours. In contrast, Npt2a-I (Figure 3D) caused a decrease after 3 hours, followed by an increase at 24 hours. Compared with baseline, vehicle application (Figure 3E) caused a small but significant decrease of intact FGF-23 concentrations in plasma after 3 hours, followed by an increase after 24 hours. In contrast, Npt2a-I (Figure 3E) did not affect intact FGF-23 concentrations after 3 hours and remained significantly higher compared with vehicle, but subsequently caused a significant increase at 24 hours. Changes in plasma Pi, calcium, PTH, and FGF-23 are shown in Supplemental Figure 2, A–D. Despite dose-dependent natriuresis and urinary chloride excretion, no significant changes in plasma sodium and chloride were observed in response to Npt2a inhibition (Supplemental Figure 2, E and F). In addition, the responses of plasma potassium, pH, and bicarbonate were not significantly affected by Npt2a inhibition compared with vehicle (Supplemental Figure 2, G–I).
Effects of Npt2a Inhibition on Npt2a and Npt2c Protein Abundance and Localization
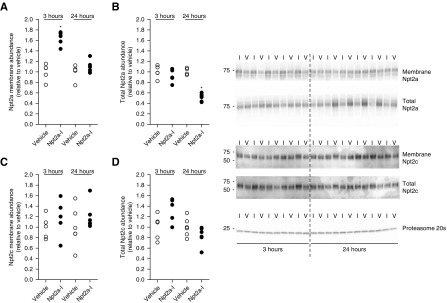
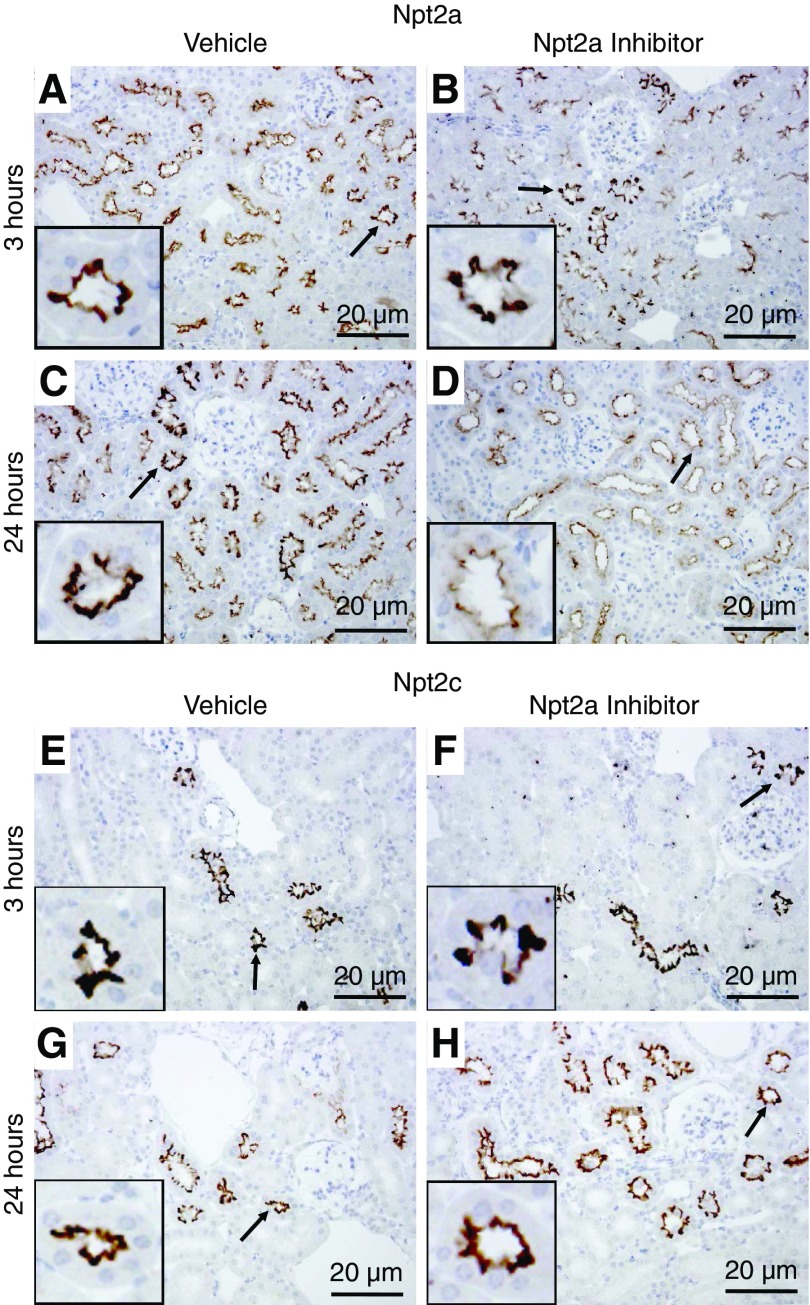
The effects of Npt2a-I on Npt2a and Npt2c total protein abundance and plasma membrane levels were studied at 3 and 24 hours after Npt2a inhibition. At 3 hours after Npt2a inhibition, Npt2a membrane abundance was increased 1.6-fold compared with vehicle (Figure 4A). Total Npt2a abundance was not affected at the 3-hour time point (Figure 4B). After 24 hours, Npt2a membrane abundance was not significantly different between vehicle and Npt2a-I (Figure 4A). In contrast, total Npt2a abundance was 50% lower in response to Npt2a-I compared with vehicle application (Figure 4B). The abundance of Npt2c (membrane and total) was not affected by Npt2a inhibition compared with vehicle at either time point (Figure 4, C and D). Immunohistochemistry (Figure 5) detected Npt2a staining predominantly in the microvilli of the proximal tubule and no visible changes were observed in localization or labeling intensity 3 or 24 hours after vehicle administration. In contrast, labeling intensity of Npt2a was visibly weaker 24 hours after Npt2a inhibition, consistent with Western blot data. At the level of light microscopy, clear differences in membrane-associated Npt2a 3 hours after Npt2a-I were not apparent. No visible differences were observed for Npt2c in response to vehicle administration or Npt2a inhibition, consistent with the Western blotting data. Because Npt2a-I acts on the proximal tubule and causes a dose-dependent natriuresis, we determined the effects of Npt2a inhibition on the major sodium reabsorption pathway in this segment, NHE3. The abundance of NHE3 and phosphorylation of serine residue 552 (an inhibitory site) was not affected by Npt2a inhibition compared with vehicle at any time point examined (Supplemental Figure 3, A–D).
Figure 4.
Npt2a inhibition affects Npt2a but not Npt2c. Western blot analysis of Npt2a and Npt2c abundances in membrane fractions and total homogenates of kidneys from mice treated (30 mg/kg) with vehicle (V) or Npt2a inhibitor (I). (A) Npt2a membrane abundance was significantly increased 3 hours after Npt2a-I treatment and not different from vehicle treatment after 24 hours. (B) Total Npt2a abundance was unaffected after 3 hours and significantly reduced after 24 hours. In contrast, no effect was observed at any time point in (C) membrane fractions or (D) total homogenate Npt2c abundance. Data were analyzed by unpaired t test and are expressed as mean±SEM, n=5–6. *P<0.05 versus vehicle.
Figure 5.
Qualitative immunohistochemical labeling identifies differences in Npt2a after 24 hours but not in Npt2c. Representative immunohistochemistry images after 3 and 24 hours from mice treated with vehicle or the Npt2a-I. (A) In vehicle-treated mice, Npt2a was detected throughout the proximal tubule starting in the early (S1) segment. Npt2a staining was predominantly localized to the apical microvilli. (B) Three hours after Npt2a-I treatment, Npt2a staining was not visibly different compared with vehicle treatment. (C and D) Twenty-four hours after treatment with the Npt2a-I, Npt2a staining was clearly weaker compared with vehicle. (E–H) Npt2c labeling was found throughout the proximal tubule in apical microvilli but staining intensity or distribution of Npt2c was not visibly different in vehicle- or Npt2a-I–treated mice after 3 or 24 hours. Arrows indicate regions magnified in the insets. n=5–6.
Twenty-Four-Hour Urinary Phosphate and Calcium Excretion in Response to Npt2a Inhibition
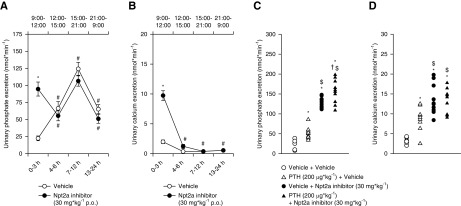
To establish a potential circadian profile of urinary Pi and calcium excretion in response to Npt2a-I, 24-hour metabolic cage experiments were performed. Following vehicle application via oral gavage (Figure 6A), urinary Pi excretion was 22±3 nmol/min from 9:00 to 12:00, which subsequently significantly increased from 12:00 to 15:00 (approximately threefold) and from 15:00 to 21:00 (approximately twofold). Subsequently, from 21:00 to 9:00 urinary Pi excretion significantly decreased (approximately twofold). A similar pattern of Pi excretion has been described before in humans.30 Confirming the previous results of Npt2a application during a 3-hour period (Figure 1A), in this study the Npt2a-I at 30 mg/kg caused significant phosphaturia (95±10 nmol/min) from 9:00 to 12:00 (Figure 6A). Urinary Pi excretion decreased in the subsequent period from 12:00 to 15:00 (approximately twofold) to levels similar to vehicle application (Figure 6A). Excretion during subsequent collecting periods was similar to vehicle application. Because plasma Pi increased at 24 hours (Figure 3, A and B), but circadian urinary Pi excretion was identical between groups after the initial 3-hour period, this suggests that increased intestinal Pi uptake or release from other cells in the body contributes to the re-establishment of plasma Pi levels.
Figure 6.
Npt2a inhibition–induced phosphaturia is only present in the first 3 hours after application. Response to acute oral (p.o.) application of Npt2a-I (30 mg/kg via oral gavage, n=9) or vehicle (n=11) in 24-hour metabolic cages. Experiments were started at 9:00. Urine was collected in 3-hour intervals until 15:00, a 6-hour interval until 21:00, and another 12-hour interval until 9:00 the next day. (A) Acute oral vehicle application showed a rise in urinary phosphate excretion until 12 hours after the start of the experiment. In the last 12 hours, urinary phosphate excretion significantly decreased. The Npt2a-I caused phosphaturia in the first 3 hours, but urinary phosphate excretion decreased in the subsequent period to levels similar with vehicle application. Excretion during subsequent collecting periods was similar to vehicle application. (B) Vehicle application showed the highest urinary calcium excretion in the first 3 hours, urinary calcium excretion was significantly lower in the remaining collecting periods. The Npt2a-I caused calciuria in the first 3 hours, but subsequently urinary calcium excretion followed the pattern of vehicle application. (C) Pretreatment with PTH (n=10) caused significantly greater urinary phosphate excretion compared with vehicle (n=6), with application of PTH plus Npt2a-I (n=10) showing an additive effect compared with Npt2a-I alone (n=10). (D) Calcium excretion increased in response to PTH, but no difference was observed when combined with the Npt2a-I. Data were analyzed by one-way ANOVA followed by the Tukey multiple comparisons test and are expressed as mean±SEM. *P<0.05 versus vehicle, #P<0.05 versus 0–3 hours, $P<0.05 versus PTH plus vehicle, †P<0.05 versus vehicle plus Npt2a-I.
Urinary calcium excretion in response to vehicle application (Figure 6B) was 2.0±0.3 nmol/min from 9:00 to 12:00, which subsequently significantly decreased from 12:00 to 15:00 (approximately 6-fold) and remained at this level from 15:00 to 9:00. Npt2a-I at 30 mg/kg caused significant calciuria (9.7±0.8 nmol/min) from 9:00 to 12:00 (Figure 6B). In the subsequent collecting period, calcium excretion dropped to levels similar to vehicle and followed a similar pattern for the remainder of the experimental period (Figure 6B).
To limit the amount of Npt2a in the brush border membrane, mice were treated with PTH (200 µg/kg) 30 minutes before an acute 3-hour metabolic cage experiment. This dose was previously shown to cause significant Npt2a internalization.23,26,27 In contrast to vehicle application, PTH caused significantly higher urinary Pi (Δ approximately 25 nmol/min) and calcium (Δ approximately 5 nmol/min) excretion (Figure 6, C and D). Application of Npt2a-I after PTH sustained the effect seen with PTH alone (Δ approximately 25 nmol/min) and resulted in the highest urinary Pi excretion (Figure 6C). This effect was not seen for urinary calcium excretion (Figure 6D).
Effect of Npt2a Inhibition in a Model of CKD
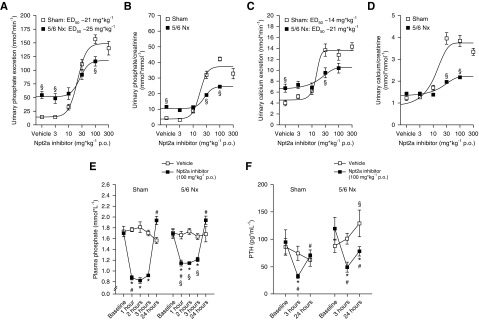
Ten days after surgery, body weight in 5/6 Nx mice was significantly lower compared with sham mice. In subsequent weeks, both groups significantly gained body weight; however, 5/6 Nx mice gained significantly more weight so that the difference between groups was lost at 21 days after surgery (Supplemental Figure 4A). The increase in body weight was associated with a significantly higher average food intake in 5/6 Nx mice compared with sham mice (Supplemental Figure 4B). At 10 weeks after surgery, GFR was approximately 66% lower in 5/6 Nx mice compared with sham mice (160±13 versus 469±36 µl/min, P<0.05; Supplemental Figure 4C). Consistent with previous reports,31,32 5/6 Nx mice were polyuric, as evidenced by a 50% lower urine osmolality and an approximately twofold higher fluid intake compared with sham mice (Supplemental Figure 4, D and E). This was associated with a more acidic urine (Δ 1.6 pH units) in 5/6 Nx mice, a predictor of CKD,33 and lower hematocrit (Supplemental Figure 4, F and G). Urinary Pi/creatinine ratio in spontaneously voided urine was not significantly different between sham and 5/6 Nx mice (9.7±1 versus 10.3±1 mmol/mmol, NS). In sham mice, administration of Npt2a-I via oral gavage caused a dose-dependent increase in urinary Pi excretion from 14±1 nmol/min in response to vehicle to 140±12 nmol/min at 300 mg/kg (50% effective dose of 21 mg/kg) over a 3-hour period (Figure 7, A and B). Sham mice showed dose dependency of urinary calcium (Figure 7, C and D), sodium, and chloride excretion as well as urinary flow rate (Supplemental Figure 5, A–E). Urinary potassium and glucose excretion as well as urinary pH did not show a clear dose dependence (Supplemental Figure 5, F–K). Mice with 5/6 Nx showed a higher urinary Pi excretion in response to vehicle compared with sham mice (Figure 7, A and B), consistent with a higher fractional Pi excretion in CKD.34 Increasing doses of Npt2a-I in 5/6 Nx mice also showed a dose dependence for urinary Pi excretion; however, the maximum effect was reduced compared with sham mice (Figure 7, A and B). Similar effects were observed for urinary calcium excretion (Figure 7, C and D). Urinary excretions of sodium and chloride, as well as urinary flow rate in response to Npt2a-I, did show a significant dose-dependence difference between sham and 5/6 Nx mice (Supplemental Figure 6, A–E). Urinary excretions of potassium and glucose as well as urinary pH were not dose dependent (Supplemental Figure 6, F–K). Because urinary Pi excretion in response to Npt2a-I at 30 mg/kg was not as pronounced compared with sham mice, we studied the effect of 100 mg/kg on the time course of plasma Pi. Both sham and 5/6 Nx mice had significantly decreased plasma Pi (−0.8±0.1 and −0.5±0.1 mmol/L, P<0.05, versus baseline and versus sham) 1 hour after Npt2a-I administration, which was slightly but significantly less pronounced in 5/6 Nx mice (Figure 7E). Both groups remained at this level up to 3 hours after administration and plasma Pi subsequently recovered after 24 hours. Compared with baseline, vehicle application (Figure 7F) did not change plasma PTH concentrations after 3 or 24 hours in sham or 5/6 Nx mice. Both sham and 5/6 Nx mice showed a significant decrease in plasma PTH (−63±22 and −70±12 pg/ml, P<0.05 versus baseline, respectively) followed by an increase after 24 hours (Figure 7F) after Npt2a inhibition.
Figure 7.
Npt2a inhibition in mice with 5/6 Nx causes a dose-dependent increase in urinary phosphate excretion and a decrease in plasma phosphate and PTH levels. Response to acute oral (p.o.) application of Npt2a-I (0.3–300 mg/kg) or vehicle in short-term (3-hour) metabolic cage experiments in sham and 5/6 Nx mice. Sham mice show dose-dependent increases in (A) urinary phosphate and (C) calcium excretion in absolute terms and (B and D) when corrected by urinary creatinine. Mice with 5/6 Nx show dose-dependent urinary phosphate and calcium excretion but the maximum effects are reduced. The dose of 300 mg/kg in 5/6 Nx mice was not included in the analysis because mice appeared lethargic after application. Application of Npt2a-I (100 mg/kg) caused a decrease in (E) plasma phosphate and (F) PTH in both sham and 5/6 Nx mice. Data were analyzed by one-way ANOVA followed by Newman–Keuls multiple comparisons test and are expressed as mean±SEM. n=6–14 for 0.3–100 mg/kg; n=4 for 300 mg/kg. *P<0.05 versus vehicle, §P<0.05 versus sham, #P<0.05 versus previous time point.
Discussion
These studies demonstrate for the first time that in vivo pharmacologic Npt2a inhibition, via an orally absorbable Npt2a-I, causes phosphaturia in mice. This is consistent with studies of Npt2a−/− mice for a major role of Npt2a in Pi reabsorption. Acutely, Npt2a inhibition also results in increased renal calcium, sodium, and chloride excretion, alongside significant reductions in plasma Pi and PTH. Under conditions of reduced kidney function (5/6 Nx model), Npt2a inhibition had similar effects, but they were slightly reduced in magnitude.
Although the role of Npt2a in humans remains controversial,35,36 these data from Npt2a inhibition in mice are consistent with certain phenotypic features of individuals who carry specific mutations in the SLC34A1 gene. For example, a homozygous single nucleotide variation in SLC34A1 is associated with hypercalcemia, hypercalciuria, hypophosphatemia, and nephrocalcinosis,37 and a heterozygous mutation causes hypophosphatemia, phosphaturia, urolithiasis, or bone demineralization.9 Another study identified a homozygous mutation in SLC34A1 causing renal Fanconi syndrome and hypophosphatemic rickets.38 Whether these differences relate to changes in the Pi-transporting activity9,37 of Npt2a and/or trafficking defects38–40 is unknown. Of note, other proximal tubule transport pathways, including uptake of glucose or amino acids, appeared to not be affected by Npt2a inhibition. Our data also provide evidence, albeit indirectly, that the Npt2a-I (PF-06869206) specificity affects Npt2a but not Npt2c in vivo. As described, patients with SLC34A1 mutations may also present with calcium-Pi stones or nephrocalcinosis.11,37,39 However, although stone formation is facilitated by alkaline urinary pH,41 our studies did not identify substantial changes in urinary or blood pH caused by Npt2a-I. It remains to be determined if long-term inhibition of Npt2a results in stone formation, nephrocalcinosis, or changes in bone mineralization.
Approximately 60%–70% of filtered calcium is passively reabsorbed in the proximal tubule as a consequence of primary reabsorption of sodium and water.42 Our data demonstrating that Npt2a inhibition caused a dose-dependent calciuria are consistent with, but do not prove, that inhibition of proximal tubular reabsorption of sodium via Npt2a causes a secondary reduction in reabsorption of calcium; however, the mechanism(s) remain elusive. Another possible player is PTH. Following Npt2a-I, phosphaturia and a reduction of plasma Pi resulted in a significant reduction of plasma PTH, similar to dietary Pi restriction.23 A reduction in plasma Pi was previously seen with phosphonoformic acid (a nonselective Npt2 inhibitor) in clearance experiments.43 These reduced PTH levels might further contribute to reduced calcium reabsorption in the distal convoluted tubule via transient receptor potential vanilloid 5 (TRPV5) channels44 that are activated by PTH.45 However, despite calciuria and changes in plasma PTH levels, plasma calcium levels were not significantly altered. This implies that Pi alone can regulate PTH release via unknown mechanism(s) given that plasma calcium levels remained unchanged. The latter is somewhat surprising given the drastic changes in PTH. Reasons for unchanged calcium might include: (1) stimulation of 1,25-dihydroxyvitamin D3 production, stimulated by hypophosphatemia, resulting in enhanced intestinal calcium absorption; and/or (2) inhibition of Npt2a in osteoclasts,46 where Npt2a is localized at the basolateral membrane which could have secondary consequences on bone resorption.
Why does pretreatment with PTH result in greater phosphaturia when combined with Npt2a inhibition than either PTH or Npt2a-I alone? PTH administration at the used dose is well described to retrieve Npt2a from the brush border membrane,23,26,27 resulting in less Npt2a available for Pi reabsorption. Thus, at the dose used in this experiment (30 mg/kg), more drug was available to inhibit the remaining transporters, resulting in a phosphaturic effect in the range of the 300 mg/kg dose (Figure 1A). However, it cannot be excluded that early effects of PTH on Npt2c are also contributing to the increased urinary Pi excretion after 3 hours.
Because Npt2a transports three sodium ions together with Pi, it is not surprising that Npt2a inhibition causes natriuresis. Npt2a inhibition results in a dose-dependent inhibition of chloride reabsorption because chloride reabsorption in the proximal tubule is sodium dependent. Because the observed dose-dependent sodium and chloride excretion after Npt2a inhibition did not result in changes in NHE3 phosphorylation or abundance, this indirectly indicates that the major sodium transport pathway in the proximal tubule is not mediating this response. However, downstream effects in other tubule segments cannot be completely excluded. Along those lines, why urinary potassium excretion is not affected by Npt2a inhibition remains to be determined.
Our results employing pharmacologic inhibition of Npt2a are consistent with previously described roles of the transporter from studies in Npt2a−/− mice and humans with certain mutations in the SLC34A1 gene. However, whether Npt2a inhibition in humans is a valuable treatment for conditions with impaired Pi homeostasis remains to be determined considering Npt2c in humans is hypothesized to have a larger role in renal Pi reabsorption.10,47 Are effects of Npt2a inhibition preserved in CKD? Data regarding a possible role of Npt2 inhibition in CKD are controversial. In vitro studies on brush border membrane vesicles from 5/6 Nx rats showed that phosphonoformic acid had a similar inhibitory potency on Npt2 activity compared with brush border membrane vesicles from sham rats.48 In contrast, the responsiveness of the proximal tubule to PTH or, potentially, to drugs acting on the tubule are impaired in CKD. Our studies demonstrate that, although most of the effects seen in control mice after Npt2a-I are preserved after 5/6 Nx, they are attenuated. We appreciate that the model used in this study represents a mild form of CKD in that plasma Pi was normal and vehicle application resulted in a higher urinary Pi excretion compared with sham. It remains to be seen if Npt2a inhibition is still efficacious in conditions where hyperphosphatemia is present, e.g., in severe CKD, acute tumor lysis syndrome, rhabdomyolysis, hemolysis, hyperthermia, profound catabolic stress, or acute leukemia.
Disclosures
None.
Funding
This work was supported by the National Institute of Diabetes and Digestive and Kidney Diseases grant 1R01DK110621 (to Dr. Rieg) and American Heart Association Transformational Research Award 19TPA34850116 (to Dr. Rieg). Funding (to Dr. Fenton) was provided by the LeDuq Foundation, the Danish Medical Research Council, and the Novo Nordisk Foundation. Mr. Xue was supported by an American Heart Association predoctoral fellowship (18PRE33990236) and Dr. Thomas by a postdoctoral fellowship (19POST34400026).
Supplementary Material
Acknowledgments
Dr. Rieg and Dr. Thomas conceived and designed the work. Dr. Thomas, Mr. Xue, Dr. Murali, Dr. Fenton, Dr. Dominguez Rieg, and Dr. Rieg contributed to the acquisition, analysis, or interpretation of data for the work. Dr. Rieg drafted the work; Dr. Thomas, Mr. Xue, Dr. Fenton, and Dr. Dominguez Rieg revised it critically for important intellectual content. Dr. Thomas, Mr. Xue, Dr. Murali, Dr. Fenton, Dr. Dominguez Rieg, and Dr. Rieg approved the final version of the manuscript.
Footnotes
Published online ahead of print. Publication date available at www.jasn.org.
See related editorial, “Another Tool in the Fight Against Phosphate Toxicity: Where Will It Fit and What Does It Tell Us about Phosphate Homeostasis?” on pages 2039–2040.
Supplemental Material
This article contains the following supplemental material online at http://jasn.asnjournals.org/lookup/suppl/doi:10.1681/ASN.2018121250/-/DCSupplemental.
Supplemental Figure 1. Percent change in urinary parameters in response to Npt2a inhibition.
Supplemental Figure 2. Change in plasma parameters in response to Npt2a inhibition.
Supplemental Figure 3. Npt2a-inhibition does not affect NHE3 and pS552-NHE3.
Supplemental Figure 4. Pathophysiological consequences of 5/6 nephrectomy (Nx).
Supplemental Figure 5. Comparison of Npt2a inhibitor dose-response effects between Sham and 5/6 nephrectomy (Nx) mice.
References
- 1.Wagner CA, Biber J, Murer H: Of men and mice: Who is in control of renal phosphate reabsorption? J Am Soc Nephrol 19: 1625–1626, 2008 [DOI] [PubMed] [Google Scholar]
- 2.Murer H, Biber J: Phosphate transport in the kidney. J Nephrol 23[Suppl 16]: S145–S151, 2010 [PubMed] [Google Scholar]
- 3.Biber J, Hernando N, Forster I, Murer H: Regulation of phosphate transport in proximal tubules. Pflugers Arch 458: 39–52, 2009 [DOI] [PubMed] [Google Scholar]
- 4.Bergwitz C, Jüppner H: Regulation of phosphate homeostasis by PTH, vitamin D, and FGF23. Annu Rev Med 61: 91–104, 2010 [DOI] [PMC free article] [PubMed] [Google Scholar]
- 5.Beck L, Karaplis AC, Amizuka N, Hewson AS, Ozawa H, Tenenhouse HS: Targeted inactivation of Npt2 in mice leads to severe renal phosphate wasting, hypercalciuria, and skeletal abnormalities. Proc Natl Acad Sci U S A 95: 5372–5377, 1998 [DOI] [PMC free article] [PubMed] [Google Scholar]
- 6.Segawa H, Onitsuka A, Kuwahata M, Hanabusa E, Furutani J, Kaneko I, et al.: Type IIc sodium-dependent phosphate transporter regulates calcium metabolism. J Am Soc Nephrol 20: 104–113, 2009 [DOI] [PMC free article] [PubMed] [Google Scholar]
- 7.Myakala K, Motta S, Murer H, Wagner CA, Koesters R, Biber J, et al.: Renal-specific and inducible depletion of NaPi-IIc/Slc34a3, the cotransporter mutated in HHRH, does not affect phosphate or calcium homeostasis in mice. Am J Physiol Renal Physiol 306: F833–F843, 2014 [DOI] [PubMed] [Google Scholar]
- 8.Segawa H, Onitsuka A, Furutani J, Kaneko I, Aranami F, Matsumoto N, et al.: Npt2a and Npt2c in mice play distinct and synergistic roles in inorganic phosphate metabolism and skeletal development [published correction appears in Am J Physiol Renal Physiol 312: F848, 2017]. Am J Physiol Renal Physiol 297: F671–F678, 2009 [DOI] [PubMed] [Google Scholar]
- 9.Prié D, Huart V, Bakouh N, Planelles G, Dellis O, Gérard B, et al.: Nephrolithiasis and osteoporosis associated with hypophosphatemia caused by mutations in the type 2a sodium-phosphate cotransporter. N Engl J Med 347: 983–991, 2002 [DOI] [PubMed] [Google Scholar]
- 10.Bergwitz C, Roslin NM, Tieder M, Loredo-Osti JC, Bastepe M, Abu-Zahra H, et al.: SLC34A3 mutations in patients with hereditary hypophosphatemic rickets with hypercalciuria predict a key role for the sodium-phosphate cotransporter NaPi-IIc in maintaining phosphate homeostasis. Am J Hum Genet 78: 179–192, 2006 [DOI] [PMC free article] [PubMed] [Google Scholar]
- 11.Tencza AL, Ichikawa S, Dang A, Kenagy D, McCarthy E, Econs MJ, et al.: Hypophosphatemic rickets with hypercalciuria due to mutation in SLC34A3/type IIc sodium-phosphate cotransporter: Presentation as hypercalciuria and nephrolithiasis. J Clin Endocrinol Metab 94: 4433–4438, 2009 [DOI] [PMC free article] [PubMed] [Google Scholar]
- 12.Ichikawa S, Sorenson AH, Imel EA, Friedman NE, Gertner JM, Econs MJ: Intronic deletions in the SLC34A3 gene cause hereditary hypophosphatemic rickets with hypercalciuria. J Clin Endocrinol Metab 91: 4022–4027, 2006 [DOI] [PubMed] [Google Scholar]
- 13.Bon N, Frangi G, Sourice S, Guicheux J, Beck-Cormier S, Beck L: Phosphate-dependent FGF23 secretion is modulated by PiT2/Slc20a2. Mol Metab 11: 197–204, 2018 [DOI] [PMC free article] [PubMed] [Google Scholar]
- 14.Carfagna F, Del Vecchio L, Pontoriero G, Locatelli F: Current and potential treatment options for hyperphosphatemia. Expert Opin Drug Saf 17: 597–607, 2018 [DOI] [PubMed] [Google Scholar]
- 15.Labonté ED, Carreras CW, Leadbetter MR, Kozuka K, Kohler J, Koo-McCoy S, et al.: Gastrointestinal inhibition of sodium-hydrogen exchanger 3 reduces phosphorus absorption and protects against vascular calcification in CKD. J Am Soc Nephrol 26: 1138–1149, 2015 [DOI] [PMC free article] [PubMed] [Google Scholar]
- 16.Kempson SA, Colon-Otero G, Ou SY, Turner ST, Dousa TP: Possible role of nicotinamide adenine dinucleotide as an intracellular regulator of renal transport of phosphate in the rat. J Clin Invest 67: 1347–1360, 1981 [DOI] [PMC free article] [PubMed] [Google Scholar]
- 17.Larsson TE, Kameoka C, Nakajo I, Taniuchi Y, Yoshida S, Akizawa T, et al.: NPT-IIb inhibition does not improve hyperphosphatemia in CKD. Kidney Int Rep 3: 73–80, 2017 [DOI] [PMC free article] [PubMed] [Google Scholar]
- 18.Filipski KJ, Sammons MF, Bhattacharya SK, Panteleev J, Brown JA, Loria PM, et al.: Discovery of orally bioavailable selective inhibitors of the sodium-phosphate cotransporter NaPi2a (SLC34A1). ACS Med Chem Lett 9: 440–445, 2018 [DOI] [PMC free article] [PubMed] [Google Scholar]
- 19.Rieg T, Steigele H, Schnermann J, Richter K, Osswald H, Vallon V: Requirement of intact adenosine A1 receptors for the diuretic and natriuretic action of the methylxanthines theophylline and caffeine. J Pharmacol Exp Ther 313: 403–409, 2005 [DOI] [PubMed] [Google Scholar]
- 20.Fenton RA, Poulsen SB, de la Mora Chavez S, Soleimani M, Dominguez Rieg JA, Rieg T: Renal tubular NHE3 is required in the maintenance of water and sodium chloride homeostasis. Kidney Int 92: 397–414, 2017 [DOI] [PMC free article] [PubMed] [Google Scholar]
- 21.Fenton RA, Murali SK, Kaji I, Akiba Y, Kaunitz JD, Kristensen TB, et al.: Adenylyl cyclase 6 expression is essential for cholera toxin-induced diarrhea [published online ahead of print January 8, 2019]. J Infect Dis 10.1093/infdis/jiz013 [DOI] [PMC free article] [PubMed] [Google Scholar]
- 22.Poulsen SB, Kristensen TB, Brooks HL, Kohan DE, Rieg T, Fenton RA: Role of adenylyl cyclase 6 in the development of lithium-induced nephrogenic diabetes insipidus. JCI Insight 2: e91042, 2017 [DOI] [PMC free article] [PubMed] [Google Scholar]
- 23.Fenton RA, Murray F, Dominguez Rieg JA, Tang T, Levi M, Rieg T: Renal phosphate wasting in the absence of adenylyl cyclase 6. J Am Soc Nephrol 25: 2822–2834, 2014 [DOI] [PMC free article] [PubMed] [Google Scholar]
- 24.Fenton RA, Poulsen SB, de la Mora Chavez S, Soleimani M, Busslinger M, Dominguez Rieg JA, et al.: Caffeine-induced diuresis and natriuresis is independent of renal tubular NHE3. Am J Physiol Renal Physiol 308: F1409–F1420, 2015 [DOI] [PMC free article] [PubMed] [Google Scholar]
- 25.Poulsen SB, Marin De Evsikova C, Murali SK, Praetorius J, Chern Y, Fenton RA, et al.: Adenylyl cyclase 6 is required for maintaining acid-base homeostasis. Clin Sci (Lond) 132: 1779–1796, 2018 [DOI] [PMC free article] [PubMed] [Google Scholar]
- 26.Nagai S, Okazaki M, Segawa H, Bergwitz C, Dean T, Potts JT Jr, et al.: Acute down-regulation of sodium-dependent phosphate transporter NPT2a involves predominantly the cAMP/PKA pathway as revealed by signaling-selective parathyroid hormone analogs. J Biol Chem 286: 1618–1626, 2011 [DOI] [PMC free article] [PubMed] [Google Scholar]
- 27.Bacic D, Lehir M, Biber J, Kaissling B, Murer H, Wagner CA: The renal Na+/phosphate cotransporter NaPi-IIa is internalized via the receptor-mediated endocytic route in response to parathyroid hormone. Kidney Int 69: 495–503, 2006 [DOI] [PubMed] [Google Scholar]
- 28.Rieg T, Tang T, Murray F, Schroth J, Insel PA, Fenton RA, et al.: Adenylate cyclase 6 determines cAMP formation and aquaporin-2 phosphorylation and trafficking in inner medulla. J Am Soc Nephrol 21: 2059–2068, 2010 [DOI] [PMC free article] [PubMed] [Google Scholar]
- 29.Rieg T: A High-throughput method for measurement of glomerular filtration rate in conscious mice. J Vis Exp (75): e50330, 2013 [DOI] [PMC free article] [PubMed] [Google Scholar]
- 30.Portale AA, Halloran BP, Morris RC Jr: Dietary intake of phosphorus modulates the circadian rhythm in serum concentration of phosphorus. Implications for the renal production of 1,25-dihydroxyvitamin D. J Clin Invest 80: 1147–1154, 1987 [DOI] [PMC free article] [PubMed] [Google Scholar]
- 31.Gava AL, Freitas FP, Balarini CM, Vasquez EC, Meyrelles SS: Effects of 5/6 nephrectomy on renal function and blood pressure in mice. Int J Physiol Pathophysiol Pharmacol 4: 167–173, 2012 [PMC free article] [PubMed] [Google Scholar]
- 32.Leelahavanichkul A, Yan Q, Hu X, Eisner C, Huang Y, Chen R, et al.: Angiotensin II overcomes strain-dependent resistance of rapid CKD progression in a new remnant kidney mouse model. Kidney Int 78: 1136–1153, 2010 [DOI] [PMC free article] [PubMed] [Google Scholar]
- 33.Nakanishi N, Fukui M, Tanaka M, Toda H, Imai S, Yamazaki M, et al.: Low urine pH Is a predictor of chronic kidney disease. Kidney Blood Press Res 35: 77–81, 2012 [DOI] [PubMed] [Google Scholar]
- 34.Hruska KA, Klahr S, Hammerman MR: Decreased luminal membrane transport of phosphate in chronic renal failure. Am J Physiol 242: F17–F22, 1982 [DOI] [PubMed] [Google Scholar]
- 35.Kassebaum N, Kyu HH, Zoeckler L, Olsen HE, Thomas K, Pinho C, et al.; Global Burden of Disease Child and Adolescent Health Collaboration: Child and adolescent health from 1990 to 2015: Findings from the global burden of diseases, injuries, and risk factors 2015 study [published correction appears in JAMA Pediatr 171: 573–592, 2017]. JAMA Pediatr 171: 573–592, 2017 [DOI] [PMC free article] [PubMed]
- 36.Wagner CA, Rubio-Aliaga I, Biber J, Hernando N: Genetic diseases of renal phosphate handling. Nephrol Dial Transplant 29[Suppl 4]: iv45–iv54, 2014 [DOI] [PubMed] [Google Scholar]
- 37.Rajagopal A, Braslavsky D, Lu JT, Kleppe S, Clément F, Cassinelli H, et al.: Exome sequencing identifies a novel homozygous mutation in the phosphate transporter SLC34A1 in hypophosphatemia and nephrocalcinosis. J Clin Endocrinol Metab 99: E2451–E2456, 2014 [DOI] [PMC free article] [PubMed] [Google Scholar]
- 38.Magen D, Berger L, Coady MJ, Ilivitzki A, Militianu D, Tieder M, et al.: A loss-of-function mutation in NaPi-IIa and renal Fanconi’s syndrome. N Engl J Med 362: 1102–1109, 2010 [DOI] [PubMed] [Google Scholar]
- 39.Schlingmann KP, Ruminska J, Kaufmann M, Dursun I, Patti M, Kranz B, et al.: Autosomal-recessive mutations in SLC34A1 encoding sodium-phosphate cotransporter 2A cause idiopathic infantile hypercalcemia. J Am Soc Nephrol 27: 604–614, 2016 [DOI] [PMC free article] [PubMed] [Google Scholar]
- 40.Fearn A, Allison B, Rice SJ, Edwards N, Halbritter J, Bourgeois S, et al.: Clinical, biochemical, and pathophysiological analysis of SLC34A1 mutations. Physiol Rep 6: e13715, 2018 [DOI] [PMC free article] [PubMed] [Google Scholar]
- 41.Parks JH, Worcester EM, Coe FL, Evan AP, Lingeman JE: Clinical implications of abundant calcium phosphate in routinely analyzed kidney stones. Kidney Int 66: 777–785, 2004 [DOI] [PubMed] [Google Scholar]
- 42.Alexander RT, Dimke H: Effect of diuretics on renal tubular transport of calcium and magnesium. Am J Physiol Renal Physiol 312: F998–F1015, 2017 [DOI] [PubMed] [Google Scholar]
- 43.VanScoy M, Loghman-Adham M, Onsgard M, Szczepanska-Konkel M, Homma S, Knox FG, et al.: Mechanism of phosphaturia elicited by administration of phosphonoformate in vivo. Am J Physiol 255: F984–F994, 1988 [DOI] [PubMed] [Google Scholar]
- 44.Hoenderop JG, van Leeuwen JP, van der Eerden BC, Kersten FF, van der Kemp AW, Mérillat AM, et al.: Renal Ca2+ wasting, hyperabsorption, and reduced bone thickness in mice lacking TRPV5. J Clin Invest 112: 1906–1914, 2003 [DOI] [PMC free article] [PubMed] [Google Scholar]
- 45.de Groot T, Lee K, Langeslag M, Xi Q, Jalink K, Bindels RJ, et al.: Parathyroid hormone activates TRPV5 via PKA-dependent phosphorylation. J Am Soc Nephrol 20: 1693–1704, 2009 [DOI] [PMC free article] [PubMed] [Google Scholar]
- 46.Gupta A, Tenenhouse HS, Hoag HM, Wang D, Khadeer MA, Namba N, et al.: Identification of the type II Na+-Pi cotransporter (Npt2) in the osteoclast and the skeletal phenotype of Npt2-/- mice. Bone 29: 467–476, 2001 [DOI] [PubMed] [Google Scholar]
- 47.Lorenz-Depiereux B, Benet-Pages A, Eckstein G, Tenenbaum-Rakover Y, Wagenstaller J, Tiosano D, et al.: Hereditary hypophosphatemic rickets with hypercalciuria is caused by mutations in the sodium-phosphate cotransporter gene SLC34A3. Am J Hum Genet 78: 193–201, 2006 [DOI] [PMC free article] [PubMed] [Google Scholar]
- 48.Loghman-Adham M, Szczepanska-Konkel M, Dousa TP: Phosphate transport in brush border membranes from uremic rats. Response to phosphonoformic acid. J Am Soc Nephrol 3: 1253–1259, 1992 [DOI] [PubMed] [Google Scholar]
Associated Data
This section collects any data citations, data availability statements, or supplementary materials included in this article.


