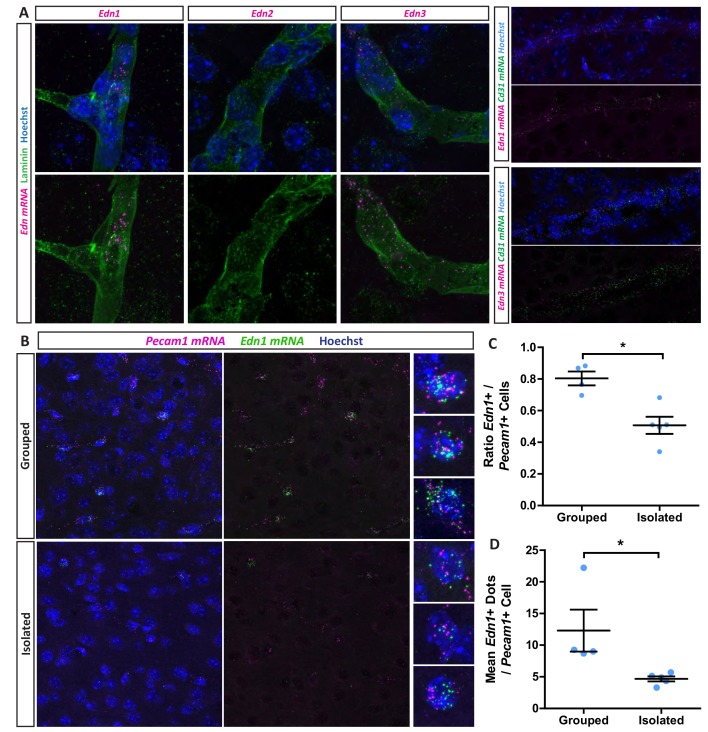
Figure 2. Social isolation reduces vascular endothelin expression.
(A) Edn1 and Edn3 mRNA expression in laminin positive and CD31 positive blood vessels as revealed by RNAScope in situ hybridisation. (B) Representative images of Edn1 and Pecam1 mRNA expression in the mPFC. (C) Quantification of the number of Edn1 expressing Pecam1 positive endothelial cells. Grouped 0.8033 ± 0.04411 n = 4 mice, Isolated 0.5074 ± 0.05412 n = 5 mice (mean ± standard error). Mann-Whitney test, p=0.0159. (D) Quantification of the mean Edn1 mRNA molecules expressed by Pecam1 positive cells per mouse. Grouped 12.29 ± 3.312 n = 4 mice, Isolated 4.673 ± 0.4059 n = 5 mice (mean ± standard error). Mann-Whitney test, p=0.0159.


