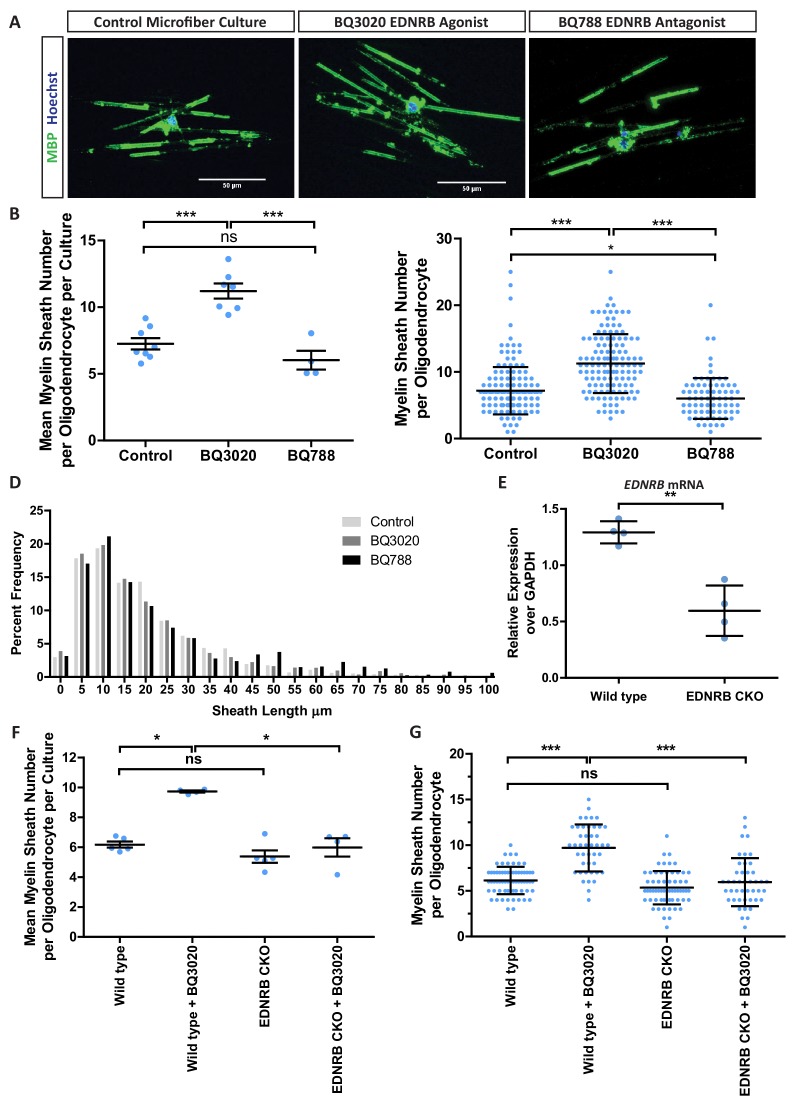
Figure 4. EDNRB enhances myelin sheath number in vitro.
(A) Representative images of MBP positive oligodendrocytes in microfiber culture. Scale bar = 50 μm. (B) Mean number of myelin sheaths formed by rat oligodendrocytes on microfibers per independent culture preparation. Control 7.253 ± 0.4258 n = 8 independent cultures, BQ3020 11.21 ± 0.58635 n = 7 independent cultures, BQ788 6.026 ± 0.7046 (mean ± standard error) n = 4 independent cultures. 1-way ANOVA with Tukey’s post hoc test. (C) Pooled data for number of myelin sheaths formed by rat oligodendrocytes on microfibers. Control 7.194 ± 3.544 n = 160 cells from eight independent cultures, BQ3020 11.25 ± 4.420 n = 127 from seven independent cultures, BQ788 6.024 ± 3.059 n = 85 cells from four independent cultures (mean ± standard deviation). Kruskal-Wallis test, with Dunns post hoc. (D) Frequency distribution of myelin sheath lengths formed on microfibers. (E) qPCR for EDNRB from mouse oligodendrocyte cultures. Wild type 1.292 ± 0.04933 n = 4 independent cultures, EDNRB CKO 0.5958 ± 0.1117 n = 4 independent cultures, BQ788 6.026 ± 0.7046 (mean ± standard error). Unpaired T-test p=0.0013. (F) Mean number of myelin sheaths formed by mouse oligodendrocytes on microfibers per independent culture preparation. Wild type 6.18 ± 0.2082 n = 5 independent cultures, Wild type + BQ3020 9.732 ± 0.07548 n = 4 independent cultures, EDNRB CKO 5.380 ± 0.4181 n = 5 independent cultures, EDNRB CKO + BQ3020 5.989 ± 0.6125 n = 4 independent cultures (mean ± standard error). 1-way ANOVA. (G) Pooled data for number of myelin sheaths formed by mouse oligodendrocytes on microfibers. Wild type 6.138 ± 1.499 n = 65 cells from five independent cultures, Wild type + BQ3020 9.705 ± 2.575 n = 44 from 4independent cultures, EDNRB CKO 5.345 ± 1.824 n = 65 cells from 5independent cultures, EDNRB CKO + BQ3020 5.955 ± 2.632 n = 44 cells from four independent cultures (mean ± standard deviation). Kruskal-Wallis test, with Dunns post hoc.

