. 2019 Oct 28;8:e49493. doi: 10.7554/eLife.49493

Figure 5. Protein kinase C epsilon is downstream of EDNRB to regulate myelin sheath number.

(A) Western blot images of rat oligodendrocytes treated with EDNRB agonist BQ3020 and PKCε agonist FR 236924 for 15 min. Antibodies used: Phosphorylated PKCε S729 and loading control GAPDH. (B) Mean number of myelin sheaths formed by rat oligodendrocytes on microfibers per experiment. Control 5.959 ± 0.4708 n = 4, FR 236924 9.542 ± 0.3614 n = 3 (mean ± standard error). Unpaired T-test p=0.0024. (C) Pooled data for number of myelin sheaths formed by rat oligodendrocytes on microfibers. Control 5.952 ± 2.525 n = 62 cells from four experiments, FR 236924 9.542 ± 4.016 n = 48 from three experiments (mean ± standard deviation). Mann-Whitney test, p=<0.001. (D) Schematic for zebrafish larvae treatment with FR 236924. (E) Representative images of 4 dpf zebrafish larvae treated with DMSO control or FR 236924. Scale bar = 500 μm. (F) Representative images of mbp:EGFP-CAAX oligodendrocytes in four dpf zebrafish larvae. Scale bar = 10 μm. (G) Pooled data for number of myelin sheaths formed by zebrafish oligodendrocytes. EDNRB Het 12.35 ± 3.746 n = 20 cells, EDNRB Hom (rse) 9.073 ± 2.229 n = 41 from four experiments, EDNRB Het + FR 236924 13.5 ± 3.098 n = 22 cells from five experiments, EDNRB Hom + FR 236924 14 ± 4.807 n = 19 cells (mean ± standard deviation). 1-way ANOVA.

Figure 5.

Figure 5—figure supplement 1. Global loss of EDNRB increases the number of oligodendrocytes in the zebrafish ventral spinal cord.

Figure 5—figure supplement 1.

(A) Representative images of MBP positive oligodendrocytes in the zebrafish spinal cord. (B) Oligodendrocyte cell numbers in the dorsal tract: EDNRB Het 20.23 ± 5.639, EDNRB Hom 21.21 ± 7.138, ventral tract: EDNRB Het 39.09 ± 7.157, EDNRB Hom 45.47 ± 7.09 and total: EDNRB Het 59.32 ± 9.766, EDNRB Hom 66.79 ± 11.73. EDNRB Het n = 22, EDNRB Hom n = 14. T-test, Ventral p=0.0119, Total p=0.0463.
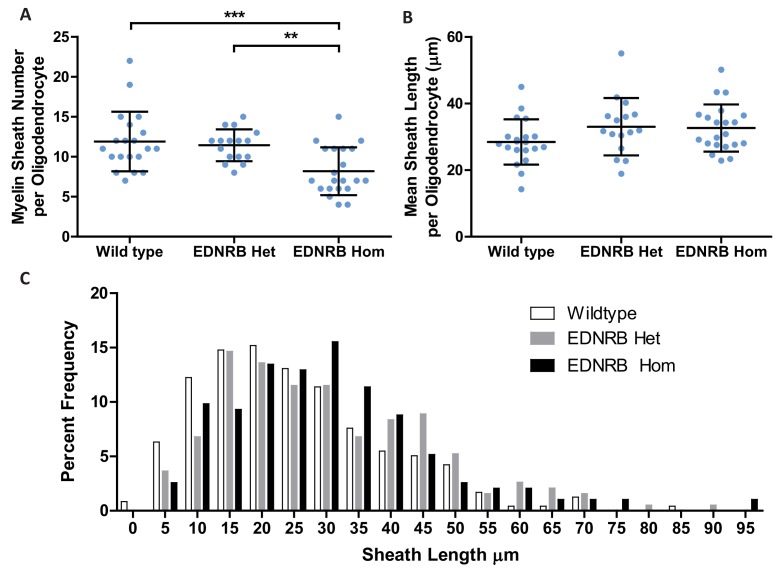
Figure 5—figure supplement 2. Global loss of EDNRB reduces the number of myelin sheath formed by zebrafish oligodendrocytes.

Figure 5—figure supplement 2.

(A) Pooled data for number of myelin sheaths formed by zebrafish oligodendrocytes. Wild Type 11.9 ± 3.726 n = 20 cells, EDNRB Het 11.44 ± 1.999 n = 16 cells, EDNRB Hom 8.19 ± 2.994 n = 21 cells from four experiments, (mean ± standard deviation). 1-way ANOVA. (B) Pooled data for mean myelin sheath length formed by zebrafish oligodendrocytes. Wild Type 28.45 ± 6.8 n = 20 cells, EDNRB Het 33.04 ± 8.629 n = 16 cells, EDNRB Hom 32.65 ± 7.098 n = 21 from four experiments, (mean ± standard deviation). 1-way ANOVA. (C) Frequency distribution of myelin sheath length.
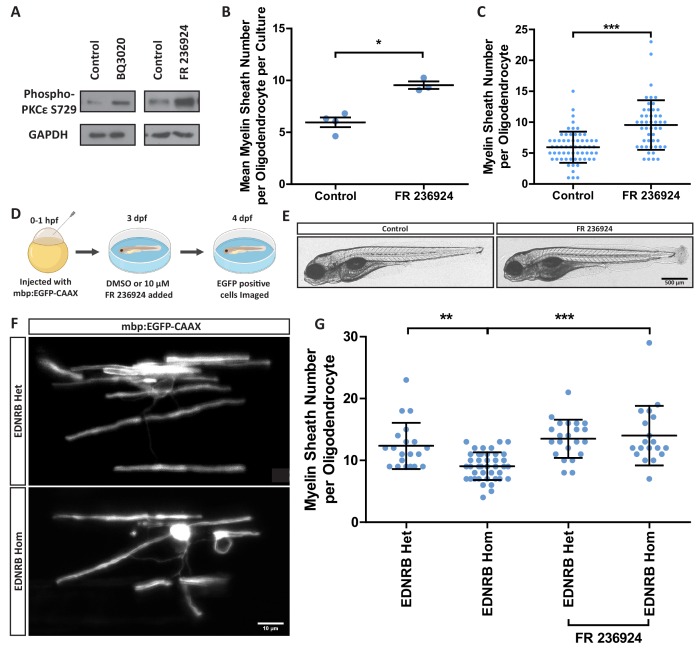
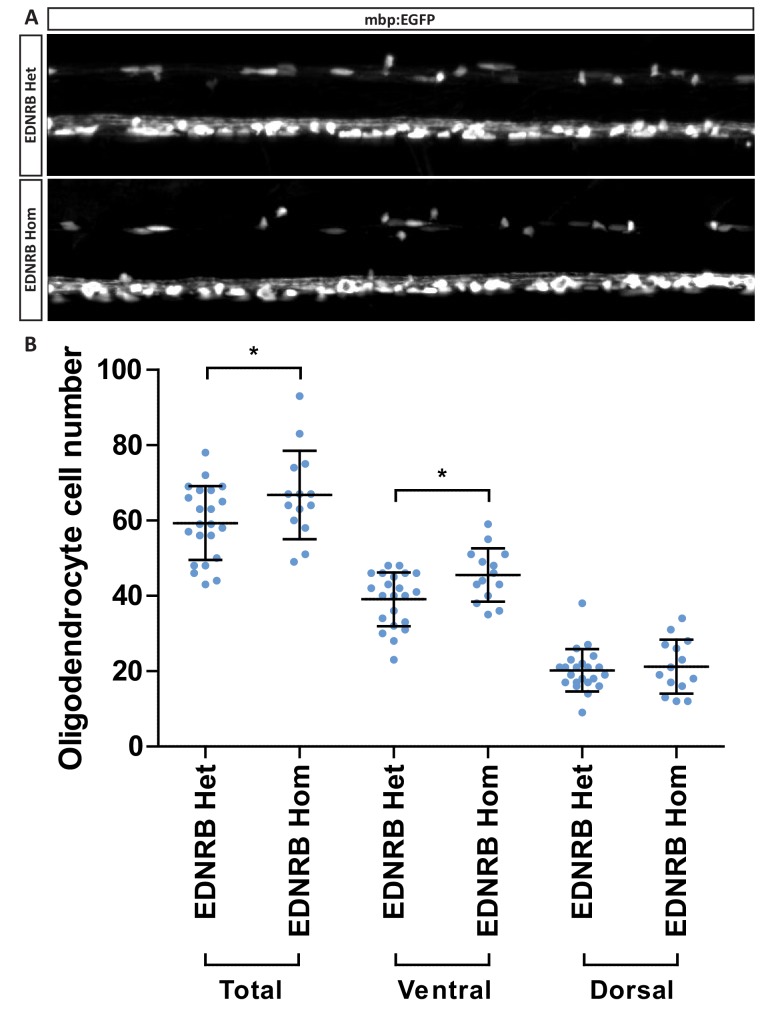
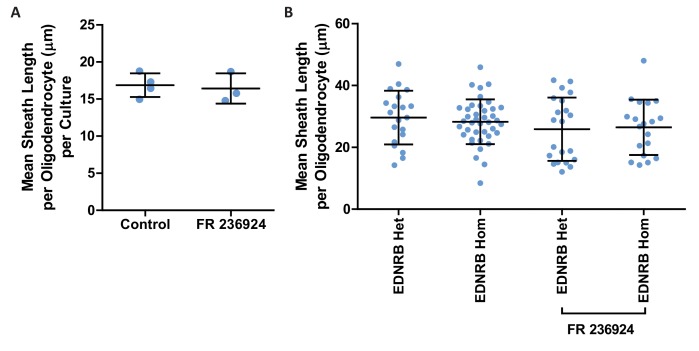
Figure 5—figure supplement 3. Protein kinase C epsilon activation does not affect myelin sheath length.

Figure 5—figure supplement 3.

(A) Mean myelin sheath lengths formed by oligodendrocytes in microfiber cultures. Control 16.87 µm ± 0.7932, FR 16.42 µm ± 1.176 n = 3–4 (mean ± standard error). (B) Pooled data for number myelin sheath length formed by zebrafish oligodendrocytes. EDNRB Het 29.62 ± 8.685 n = 20 cells, EDNRB Hom 28.27 ± 7.242 n = 41 from, EDNRB Het + FR 236924 25.86 ± 10.25n = 21 cells, EDNRB Hom + FR 236924 26.48 ± 8.951 n = 19 cells (mean ± standard deviation).