Supplemental Digital Content is available in the text.
Background.
Socioeconomic barriers can prevent successful kidney transplant (KT) but are difficult to measure efficiently in clinical settings. We created and validated an individual-level, single score Kidney Transplant Derailers Index (KTDI) and assessed its association with waitlisting and living donor KT (LDKT) rates.
Methods.
The dataset included 733 patients presenting for KT evaluation in a transplant center in California. Exploratory factor analysis was used to identify socioeconomic barriers to KT (derailers) to include in the index. Potential KT derailers included health insurance, employment, financial insecurity, educational attainment, perception of neighborhood safety, access to a vehicle, having a washer/dryer, and quality of social support. Validity was tested with associations between KTDI scores and the following: (1) the Area Deprivation Index (ADI) and (2) time to KT waitlisting and LDKT.
Results.
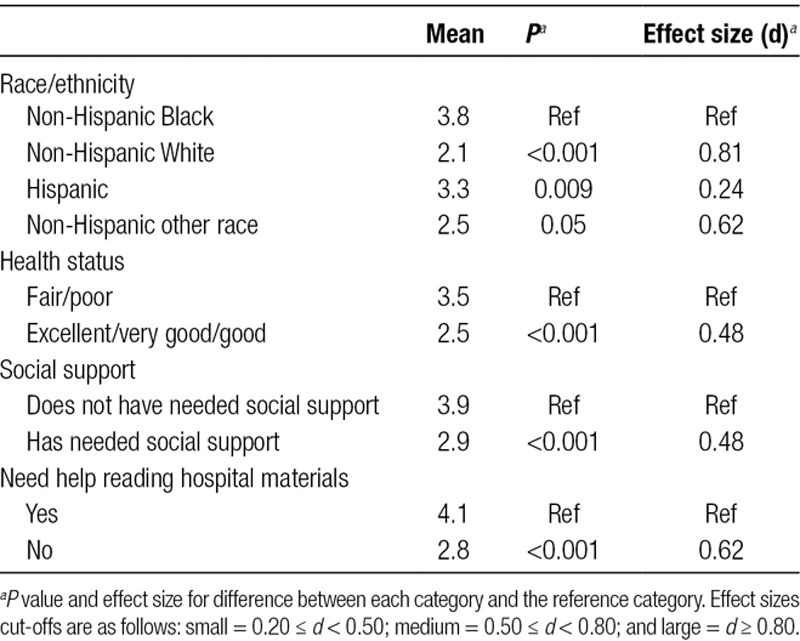
Nine derailers were retained, omitting only social support level from the original set. The KTDI was scored by summing the number of derailers endorsed (mean: 3.0; range: 0–9). Black patients had higher estimated KTDI scores than other patient groups (versus White patients, 3.8 versus 2.1; P < 0.001, effect size = 0.81). In addition, the KTDI was associated with the ADI (γ = 0.70, SE = 0.07; P < 0.001). Finally, in comparison to the lower tertile, patients in the upper and middle KTDI tertiles had lower hazard of waitlisting (upper tertile hazard ratio [HR]: 0.34, 95% confidence interval [CI]: 0.25-0.45; middle tertile HR: 0.54, 95% CI: 0.40-0.72) and receiving an LDKT (upper tertile HR: 0.15, 95% CI: 0.08-0.30; middle tertile HR: 0.35, 95% CI: 0.20-0.62). These associations remained significant when adjusting for the ADI and other patient characteristics.
Conclusions.
The KTDI is a valid indicator of socioeconomic barriers to KT for individual patients that can be used to identify patients at risk for not receiving a KT.
Although kidney transplant (KT) is the medically optimal treatment for end-stage kidney disease (ESKD), completing transplant evaluation and receiving a transplant is complex. Also, before ESKD, many kidney patients, particularly Black and Hispanic patients,1 face greater levels of socioeconomic challenges including neighborhood violence,2,3 employment instability, and not having basic amenities at home4 including access to a vehicle.5,6 After a diagnosis of ESKD, even more socioeconomic challenges emerge including patients becoming unemployed at greater rates,7,8 starting disability,8 and, if transplanted, requiring health insurance coverage to pay for lifetime immunosuppressant medications.9 For these reasons, lower socioeconomic status (SES) in kidney patients is associated with lower likelihood of receiving a deceased donor KT (DDKT) or living donor KT (LDKT).10,11
However, measurement of individual- and community-level indicators of SES in transplant research and clinical settings is inconsistent. Previous research has used many different individual measures of SES, including patients’ educational level,1,12,13 income,11 type of health insurance,1,11-14 and employment status,1 but often fails to assess multiple aspects of SES at the same time. Neighborhood or zip code community-level indexes from Census data, with indicators like the percentage of individuals in poverty, percentage of individuals with college education, value of owner-occupied homes, and the level of racial segregation,9,10 have also demonstrated associations with reduced access to transplant,10 as well as with transplant outcomes.12 While multiple, well-validated community-level SES indices are available,15,16 fewer multidimensional indexes at the individual patient level exist. Although several indicators at the individual level may be used as SES proxies (eg, type of health insurance), an index combines information from multiple indicators to reflect the additional risk imparted when a patient experiences several SES barriers simultaneously. In addition, it is critical to have an individual-level SES index that is able to flag reduced access to transplant in particular.
A KT-specific, individual-level index capturing multiple SES barriers to transplant could ease the burden of clinical screening and risk-stratify patients with higher rates of SES challenges who may require additional support. This article details the creation and validation of a single score Kidney Transplant Derailers Index (KTDI) using a sample of patients presenting for transplant evaluation. Validation analyses for the new KTDI included examining associations with a community-level SES index and with KT waitlisting and LDKT receipt, as well as estimating the mean KTDI score in a sample of low-income dialysis patients.
MATERIALS AND METHODS
Study Sample
The primary dataset used for this study was collected during a randomized controlled trial testing the impact of KT education and tailored feedback on transplant knowledge and access to transplant; its protocol has been published elsewhere17 (Transplant Evaluation Sample). This study recruited 733 Hispanic, non-Hispanic Black, non-Hispanic White, and non-Hispanic patients of other races when they presented for transplant evaluation at an academic KT center in Southern California. This study’s baseline data before the educational intervention was used for scale development and the majority of validation analyses. In addition, a secondary dataset was used for validation analyses that included 561 Black and White dialysis patients with low-income (defined as annual household income of 250% of the federal poverty level) from 122 dialysis clinics throughout the state of Missouri.18 The UCLA Institutional Review Board approved the protocols used to collect the data in both studies (transplant evaluation study: 14-000802; dialysis study: 14-000382), and in both, the participants were treated in a manner in accordance with the Declaration of Helsinki and the Declaration of Istanbul.
Measures
Patient-Level Measures
Using a general review of the literature, and a theoretical framework identifying barriers to transplant,19 we selected 10 SES indicators to assess on the preintervention surveys. These included the following: (1) having no full-time employment; (2) use of disability employment; (3) having no private health insurance; (4) use of Medicaid; (5) financial insecurity, defined as being able to live <2 months without current income (patient reported); (6) having low educational attainment, defined as having a high school degree or less education; (7) feeling unsafe in the patient’s neighborhood; (8) having no access to a vehicle; (9) having no washer and dryer at home; and (10) having less social support than the patient requires. Each of these indicators, or potential KT derailers, were coded as presence versus absence of the specific derailer (1 versus 0). This coding sets the direction of the index we aimed to create, which focuses on the derailers (eg, higher versus lower derailers) instead of SES (eg, higher versus lower SES).
In addition to the derailer variables, we collected data on patients’ demographic and clinical characteristics. These included patients’ age, race/ethnicity (Hispanic, non-Hispanic Black, non-Hispanic White, and non-Hispanic other race), gender (male/female), etiology of ESKD (transplant evaluation sample only, categorized as diabetes, hypertension, or other), whether the patient was on dialysis, and patient reported health status (rated as excellent to poor). In addition, we assessed patients’ level of health literacy by asking whether the patient ever needed help reading hospital materials (yes versus no).
Finally, we used the transplant center medical records to determine the time to transplant waitlisting and time to LDKT for each patient. The data for these analyses were downloaded on March 11, 2017, making this the default administrative censor date. Otherwise, for the time to waitlisting analysis, patients were censored when they died. For the time to LDKT analysis, patients were censored when they died or received a DDKT. For each outcome, we calculated the number of days from the survey to the event (waitlisting or LDKT) or censor date.
Zip Code SES Index
Finally, we also supplemented our individual-level SES indicators with a new, well-validated zip code-level SES index called the Area Deprivation Index (ADI).15,20 The ADI draws data from the US Census on 17 SES indicators (eg, percent of families below the poverty level and percent of households without a motor vehicle). Weights for these indicators were used to generate a score ranging from 0 to 100, with higher scores indicating greater deprivation.
Statistical Analyses
Statistical analyses were conducted in SAS v9.4 or R v3.4.3.21,22 For all statistical tests, a P < 0.05 was considered statistically significant. To describe and summarize patient characteristics, we calculated frequencies and percentages for categorical variables, and means, standard deviations, and ranges for continuous variables.
Creation of the KTDI
Using the transplant evaluation sample, we conducted several analyses to create the KTDI. First, since each derailer indicator was coded to be dichotomous, tetrachoric correlations between each pair were estimated. Cohen’s conventions for magnitude of correlations were used to determine the size of correlations: small = 0.10 ≤ r < 0.243; medium = 0.243 ≤ r < 0.371; large = r ≥ 0.371.23 These cutoffs correspond to small, medium, and large magnitude of standardized effect sizes. Next, an exploratory factor analysis was performed using principal factoring on the derailer indicators’ tetrachoric correlation matrix. First, we examined the results of this factor analysis to determine whether the indicators formed a unidimensional scale; that is, whether or not indicators measured a single, underlying construct. The ratio of the first to second eigenvalue >3 from the factor analysis was used as the cutoff to indicate unidimensionality.24 If unidimensionality was established, we then examined the factor loading for each indicator, and retained indicators with factor loadings of ≥0.40 for inclusion in the KTDI. Finally, after selecting indicators for inclusion in the index, we calculated a score by summing the number of derailers endorsed. Higher scores on the index indicate greater presence of KT derailers.
Validation Analyses
After creating the index, several types of validity were examined, all among the transplant evaluation sample except where noted. First, we calculated the KTDI score in the sample of low-income dialysis patients to test the hypothesis that KTDI scores would be significantly higher in this sample in comparison to the transplant evaluation sample. Next, “known groups” construct validity was tested by determining whether the KTDI distinguished between prespecified categories of race/ethnicity, health status, and health literacy. We hypothesized the following: (1) non-Hispanic Black patients would have higher KTDI scores versus other racial/ethnic groups; (2) patients with “Fair/Poor” self-rated health would have higher KTDI scores in comparison to patients with “Excellent/Very Good/Good” self-rated health; and (3) patients with lower health literacy would have higher KTDI scores than patients with higher health literacy. We used 1-way ANOVA or independent samples t-tests, as appropriate, to test these hypotheses, and significant differences in mean transplant derailers index scores in the hypothesized direction were taken as evidence of construct validity. In addition, for each of these tests, Cohen’s d was computed as a measure of standardized effect size. Cohen’s conventions for magnitude of effect sizes were used: small = 0.20 ≤ d < 0.49; medium = 0.50 ≤ d < 0.79; and large = d ≥ 0.80.23
Then, criterion validity was assessed by testing the association between the KTDI and the ADI. As the ADI is a zip code-level measure, with individual patients nested within zip codes, we used a mixed effects model accounting for this clustered relationship. Since both the KTDI and the ADI measure nearly the same construct, we hypothesized a statistically significant, positive association.
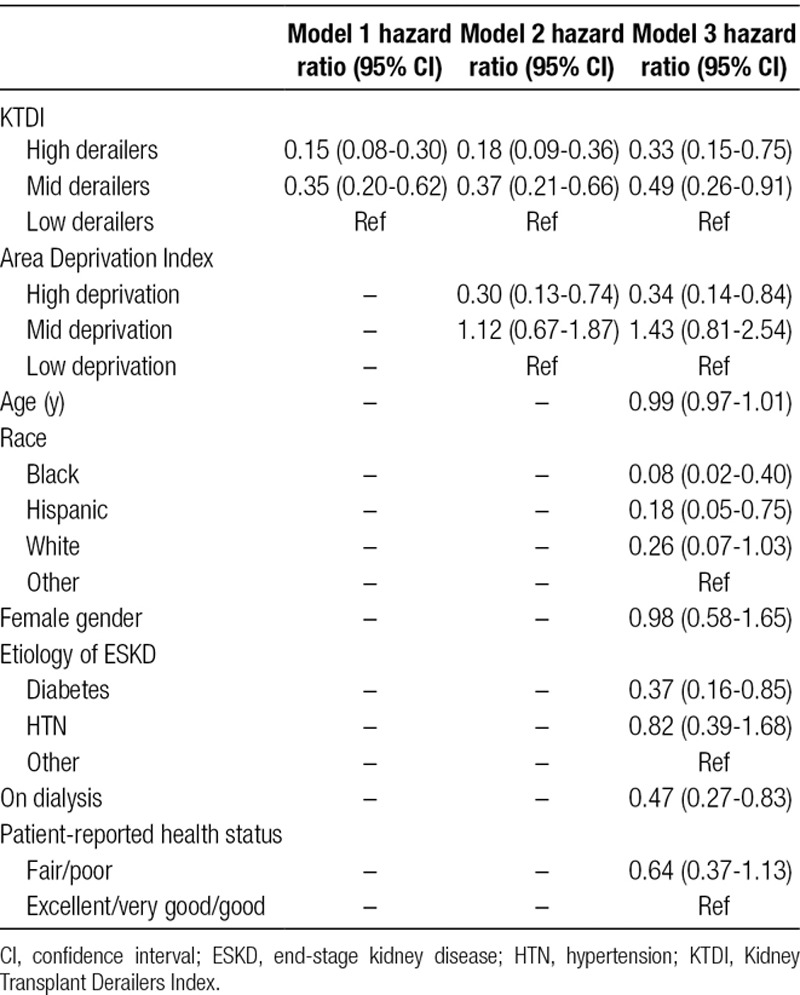
Finally, we assessed predictive validity by testing the association between time to waitlisting and LDKT stratified by the tertiles of the KTDI score with separate Kaplan-Meier failure plots and log-rank tests. We also fit a series of Cox proportional hazards models that (1) estimated the univariate association of the KTDI with each outcome (Model 1, separate models for each); (2) added the ADI (Model 2); (3) added age (per y), race/ethnicity (Hispanic, non-Hispanic Black, non-Hispanic White, and non-Hispanic Other), gender, etiology of ESKD (diabetes, hypertension, and others), whether the patient was on dialysis, and patient-reported health status (fair/poor, excellent/very good/good) (Model 3). These models used shared frailties to account for clustering within zip codes on the ADI score. For these analyses, we hypothesized higher KTDI scores would be associated with a higher hazard of waitlisting and LDKT receipt, even when adjusting for community-level SES and other patient factors.
RESULTS
Patients and Frequency of KT Derailers
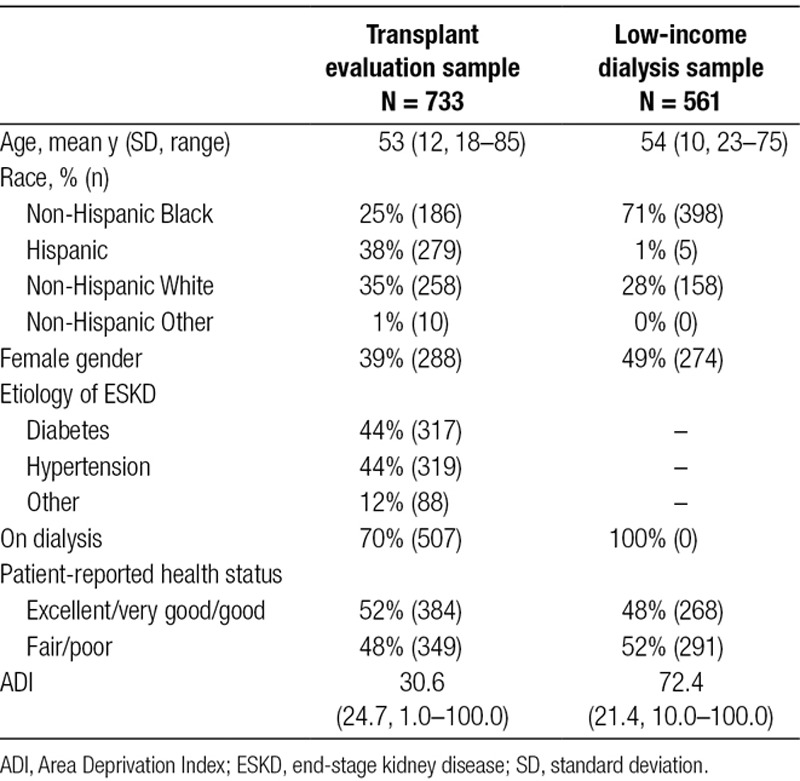
The characteristics of patients in both the transplant and low-income dialysis samples are given in Table 1. Among the 733 patients included in the transplant evaluation sample, the mean age was 53 years, and the largest proportion were Hispanic (38%). A minority was female (39%), equal proportions had diabetes or hypertension as their etiology of ESRD (44% each), and 70% were on dialysis. Patient-reported health status was split evenly between “Excellent/very good/good” (52%) and “Fair/poor” (48%). By comparison, a much larger proportion of patients in the low-income dialysis sample (N = 561) were non-Hispanic Black (71%) and a larger proportion were female (49%). The ADI scores differed between these samples with the transplant evaluation sample mean of 30.6 and dialysis sample mean of 72.4, indicating higher deprivation among the low-income dialysis sample.
TABLE 1.
Participant characteristics
The most common KT derailers experienced were having no full-time employment (Black patients = 86%, Hispanic = 75%, and White = 72%), followed by having no private insurance (Black patients = 58%, Hispanic = 52%, and White = 30%), and having high school or less education (Black patients = 31%, Hispanic = 51%, and White = 17%) (Figure 1). The least common derailers were feeling unsafe in the neighborhood (Black patients = 32%, Hispanic = 16%, and White = 12%) and not having access to a vehicle (Black patients = 20%, Hispanic = 10%, and White = 3%).
FIGURE 1.
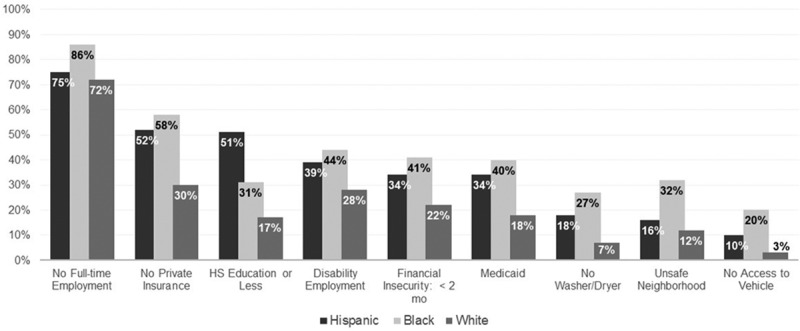
Frequency of reported kidney transplant derailers by race/ethnicity.
Selection of Derailers for the KTDI
We considered the results of psychometric analyses to create the KTDI. Tetrachoric correlations between several KT derailers exceeded the cutoff for large magnitude (Table S1, SDC, http://links.lww.com/TXD/A224). Correlations of the largest magnitude were between having no full-time employment, use of disability employment, having no private insurance, use of Medicaid insurance, and financial insecurity. Having no access to a vehicle evidenced a large correlation with several of these variables as well. Having inadequate social support tended to have small correlations with other derailers.
The exploratory factor analysis indicated that these derailers were unidimensional with a first to second eigenvalue ratio of 3.92/0.98 = 4.00. The factor loadings for all derailers exceeded 0.40 except not having adequate social support (loading = 0.29) (Table 2). Therefore, we omitted this variable and re-ran the exploratory factor analysis. In the second run, unidimensionality was again evidenced, all factor loadings exceeded 0.40, and the 9 derailers accounted for 75% of the variance of the underlying factor suggested by the factor model.
TABLE 2.
Factor loadings from exploratory factor analysis of kidney transplant derailers
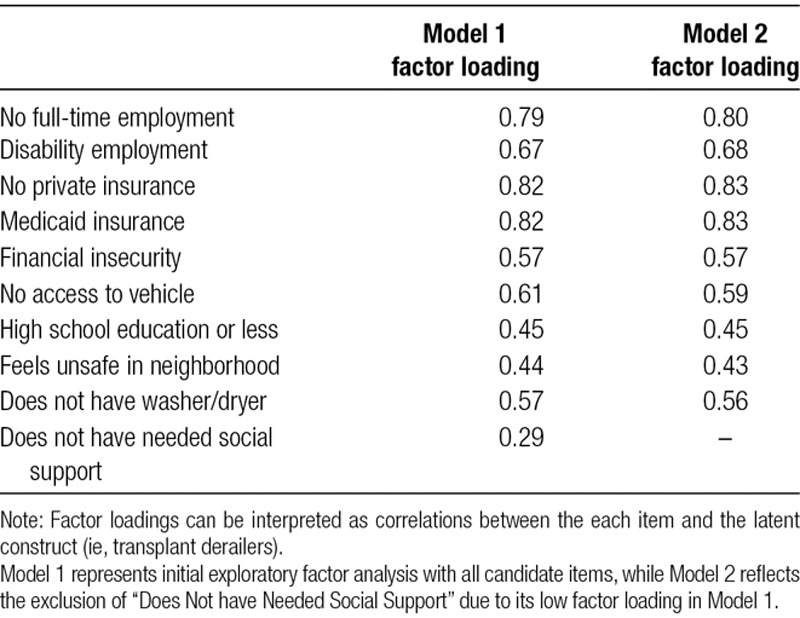
We then created the KTDI from the following derailers: having no full-time employment, use of disability employment, have no private health insurance, use of Medicaid, financial insecurity, low educational attainment, having no access to a vehicle, feeling unsafe in the neighborhood, and not having a washer and dryer at home.
Validation Analyses for the KTDI
The mean KTDI score among the transplant evaluation sample (sum of number of derailers) was 3.0 (range: 0–9) (Table 3). By comparison, the mean KTDI score in the low-income dialysis sample was 5.6. This difference was statistically significant at P < 0.001 (Figure 2). In “known groups” construct validity tests, the magnitude of effect sizes ranged widely (Table 4).The strongest associations were with the KTDI and race/ethnicity, with Black patients having the highest level of KT derailers (effect size = 0.81). Since social support was not selected for inclusion in the KTDI, we decided ad hoc to use it as an additional variable in these analyses. Associations of the KTDI with race, health status, social support, and health literacy were statistically significant in the hypothesized directions.
TABLE 3.
Descriptive characteristics of the Kidney Transplant Derailers Index
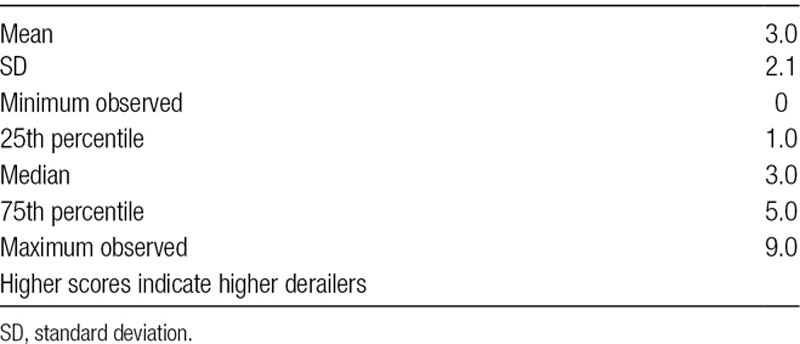
FIGURE 2.
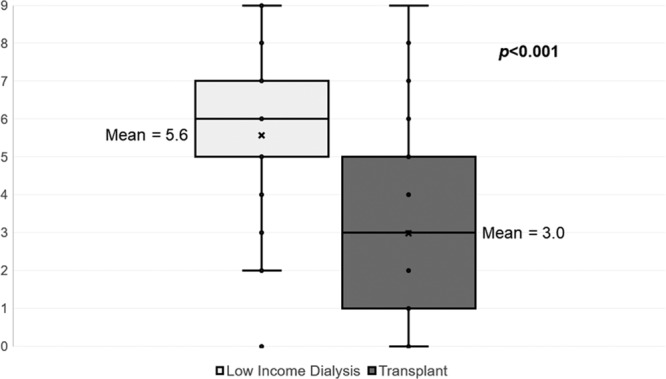
Box plots comparing Kidney Transplant Derailers Index scores between the transplant sample and low-income dialysis sample.
TABLE 4.
Construct validity tests for the Kidney Transplant Derailers Index
In addition, there was a significant, positive association between the KTDI and ADI score for the patient’s zip code. Since the ADI’s SD in this sample was 24.1, we estimated the unit change in KTDI per SD in ADI. We observed a 0.70 point KTDI change per SD change in ADI (γ = 0.70, SE = 0.07; P < 0.001). These findings support the validity of the KTDI, since a positive association between individual and neighborhood-level SES is expected.
Finally, tertiles of KTDI scores demonstrated a monotonic relationship with hazard of KT waitlisting (Figure 3A) and hazard of LDKT (Figure 3B) such that the upper KTDI tertile had the lowest hazards of each outcome and the lower tertile had the highest hazards (log-rank P < 0.001 for both). The unadjusted waitlisting hazard ratio (HR) for the upper versus lower KTDI tertile was 0.34 (95% confidence interval [CI]: 0.25-0.45) and for the middle versus lower KTDI tertile was 0.54 (95% CI: 0.40-0.72). These point estimates remained statistically significant and changed little in magnitude when adjusting for the ADI and patient demographic and clinical factors (Table 5). Similarly, the unadjusted LDKT HR for the upper versus lower KTDI tertile was 0.15 (95% CI: 0.08-0.30) and for the middle versus lower KTDI tertile was 0.35 (95% CI: 0.20-0.62) (Table 6). Like the waitlisting results, these point estimates attenuated only a little when adjusting for the ADI. However, unlike the waitlisting results, they were diminished some when adjusting for demographic and clinical characteristics, although they remained statistically significant.
FIGURE 3.
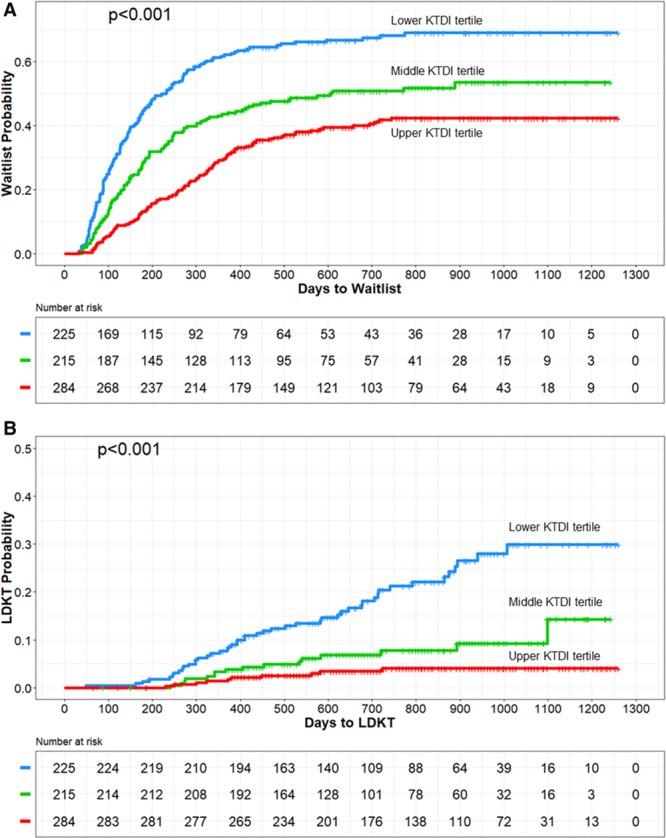
A, Time to kidney transplant waitlisting for patients by Kidney Derailers Transplant Index tertiles. B, Time to living donor kidney transplant for patients by Kidney Derailers Transplant Index tertiles. KT, kidney transplant; KTDI, Kidney Transplant Derailers Index; LDKT, living donor KT.
TABLE 5.
Multivariable Cox regression with shared frailty for time to kidney transplant waitlisting
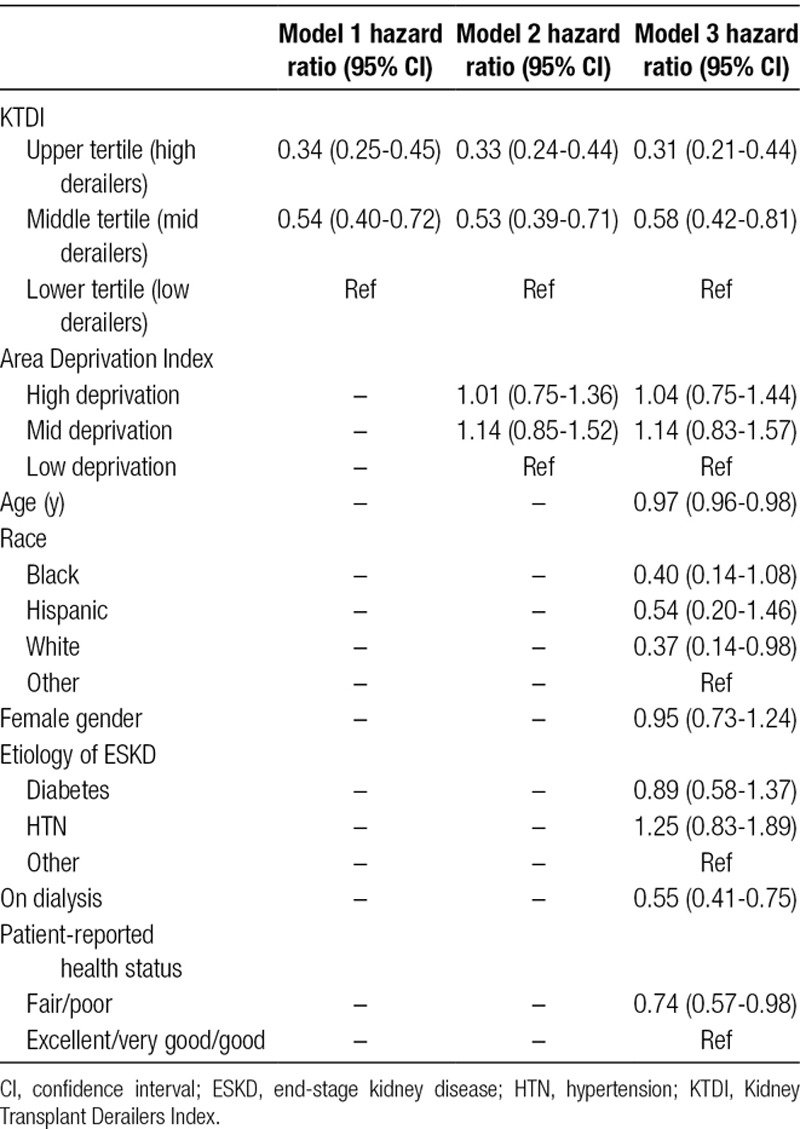
TABLE 6.
Multivariable Cox regression with shared frailty for time to living donor kidney transplant
DISCUSSION
In summary, we have shown that the KTDI is a valid and efficient indicator of socioeconomic barriers to kidney transplantation that predicts waitlisting and LDKT outcomes. Moreover, the KTDI represents a rare individual-level scale measuring socioeconomic barriers. While community-level socioeconomic indexes like percentage of persons in poverty within a zip code or neighborhood14 and indexes including population density, average property value, average household income, and percent of individuals who are unemployed10,25 are available without any patient surveying, they cannot pinpoint the specific socioeconomic characteristics of individual patients for planning of interventions.
In the Supplemental materials to this article (SDC, http://links.lww.com/TXD/A224), we provide the survey questions and scoring algorithm for the KTDI. Clinicians and researchers can use these materials to obtain valuable information on socioeconomic barriers patients face that are predictive of not making it through the transplant evaluation process or receiving LDKTs. Our approach to creation of the KTDI responds to a recent call for greater application of psychometric approaches to developing SES indexes.26 After using psychometric approaches (eg, factor analysis) to identify the most salient transplant derailers, the KTDI demonstrated evidence of construct validity, criterion validity, and predictive validity, supporting its suitability for use in clinical screening. Most importantly for these considerations, the KTDI was a strong predictor of time to waitlisting and LDKT receipt, even after adjusting for other patient factors known to be associated with these outcomes and a community-level SES index.
With its use of individual indicators, the KTDI can be used in clinical screenings to assist in targeting patients in need of interventions to overcome socioeconomic challenges to successful transplant. For example, in this study sample, Black patients had the highest level of KT derailers compared with other groups. If asked at the start of transplant evaluation, patients with greater KTDI scores could receive resources to help overcome specific socioeconomic barriers like transportation assistance.17 Additionally, even though the KTDI captures multiple socioeconomic barriers in a single score, its individual items can be used to specify the particular barrier or barriers a patient is experiencing, and focus on those during social worker discussions.
The KTDI also may be useful in research settings. For example, the KTDI may serve as a KT-specific SES covariate in studies of transplant access. Patzer and McClellan put forth a multilevel framework for heath disparities for chronic kidney disease.9 This framework separates SES factors that impact chronic kidney disease risk and outcomes into community and individual levels. In another conceptual analysis of health disparities in KT, Waterman and colleagues identified barriers to transplant across multiple levels, including the patient and family, social network, healthcare provider, healthcare system, and the community and society levels.19 Both of these conceptual models draw directly or indirectly from the socioecological model,27 under which analyses of health risks, behaviors, and outcomes should incorporate factors across multiple levels simultaneously, including the individual and the community.28 In this context, the KTDI may be viewed as an individual-level complement to community-level measures of SES that are more often used in transplant research.
Like all studies, this study has important limitations to consider when interpreting its results. First, although the patient samples used for this study are diverse, both geographically and in terms of demographic characteristics, they are likely unrepresentative of larger populations of KT patients. Future validation studies of the KTDI should be conducted in national samples of patients and with Spanish-speaking patients. Next, while the KTDI covered many individual barriers to KT, other individual barriers not included in the KTDI may be important to kidney patients, such as overall perceived social status. Future work should examine whether inclusion of additional derailers improves the KTDI. In addition, the validation analyses in this article focused on associations of the overall index and waitlisting and receipt of LDKT, but they do not shed light on which individual indicators are also associated with these endpoints. Future research should examine this question. Finally, although not strictly a limitation of the study itself, the individual barriers included in the KTDI are not available in established transplant registries. However, at only 9 indicators, the KTDI is brief, and several of the indicators are likely already collected by many transplant programs. By adding the remaining indicators to their intake packets, the KTDI could easily be calculated by transplant programs.
In conclusion, the KTDI can be used in clinical and research applications for efficient assessment of an individual patient’s level of SES-related barriers to transplant and risk for dropping out of evaluation or not receiving an LDKT. The ability to accurately assess and intervene with patients at highest risk can be improved by use of the KTDI.
Supplementary Material
Footnotes
Published online 8 October, 2019.
This work was supported by NIDDK R01DK088711-01A1 (awarded to A.D.W.), HRSA R39OT26843-01-02 (awarded to A.D.W.), and HRSA R39OT29879 (awarded to A.D.W.).
The authors declare no conflicts of interest.
J.D.P. conceived the study design, conducted statistical analyses, and led the article drafting. J.L.B. conducted statistical analyses and critically reviewed the article. Y.C. prepared the data and critically reviewed the article. A.D.W. conceived the study design, conducted data analyses, and critically reviewed the article. M.R., A.P., and C.A. provided input to the study design and performed critical review of the article.
Supplemental digital content (SDC) is available for this article. Direct URL citations appear in the printed text, and links to the digital files are provided in the HTML text of this article on the journal’s Web site (www.transplantationdirect.com).
REFERENCES
- 1.Kasiske BL, London W, Ellison MD. Race and socioeconomic factors influencing early placement on the kidney transplant waiting list. J Am Soc Nephrol 199892142–2147 [DOI] [PubMed] [Google Scholar]
- 2.Lumeng JC, Appugliese D, Cabral HJ, et al. Neighborhood safety and overweight status in children. Arch Pediatr Adolesc Med 200616025–31 [DOI] [PubMed] [Google Scholar]
- 3.Tucker-Seeley RD, Subramanian SV, Li Y, et al. Neighborhood safety, socioeconomic status, and physical activity in older adults. Am J Prev Med 200937207–213 [DOI] [PMC free article] [PubMed] [Google Scholar]
- 4.Nobles J, Weintraub MR, Adler NE. Subjective socioeconomic status and health: relationships reconsidered. Soc Sci Med 20138258–66 [DOI] [PMC free article] [PubMed] [Google Scholar]
- 5.Arcury TA, Preisser JS, Gesler WM, et al. Access to transportation and health care utilization in a rural region. J Rural Health 20052131–38 [DOI] [PubMed] [Google Scholar]
- 6.Syed ST, Gerber BS, Sharp LK. Traveling towards disease: transportation barriers to health care access. J Community Health 201338976–993 [DOI] [PMC free article] [PubMed] [Google Scholar]
- 7.Sandhu GS, Khattak M, Pavlakis M, et al. Recipient’s unemployment restricts access to renal transplantation. Clin Transplant 201327598–606 [DOI] [PubMed] [Google Scholar]
- 8.Erickson KF, Zhao B, Ho V, et al. Employment among patients starting dialysis in the United States. Clin J Am Soc Nephrol 201813265–273 [DOI] [PMC free article] [PubMed] [Google Scholar]
- 9.Patzer RE, McClellan WM. Influence of race, ethnicity and socioeconomic status on kidney disease. Nat Rev Nephrol 20128533–541 [DOI] [PMC free article] [PubMed] [Google Scholar]
- 10.Axelrod DA, Dzebisashvili N, Schnitzler MA, et al. The interplay of socioeconomic status, distance to center, and interdonor service area travel on kidney transplant access and outcomes. Clin J Am Soc Nephrol 201052276–2288 [DOI] [PMC free article] [PubMed] [Google Scholar]
- 11.Schold JD, Gregg JA, Harman JS, et al. Barriers to evaluation and wait listing for kidney transplantation. Clin J Am Soc Nephrol 201161760–1767 [DOI] [PubMed] [Google Scholar]
- 12.Goldfarb-Rumyantzev AS, Koford JK, Baird BC, et al. Role of socioeconomic status in kidney transplant outcome. Clin J Am Soc Nephrol 20061313–322 [DOI] [PubMed] [Google Scholar]
- 13.Waterman AD, Peipert JD, Hyland SS, et al. Modifiable patient characteristics and racial disparities in evaluation completion and living donor transplant. Clin J Am Soc Nephrol 20138995–1002 [DOI] [PMC free article] [PubMed] [Google Scholar]
- 14.Patzer RE, Amaral S, Klein M, et al. Racial disparities in pediatric access to kidney transplantation: does socioeconomic status play a role? Am J Transplant 201212369–378 [DOI] [PMC free article] [PubMed] [Google Scholar]
- 15.Kind AJ, Jencks S, Brock J, et al. Neighborhood socioeconomic disadvantage and 30-day rehospitalization: a retrospective cohort study. Ann Intern Med 2014161765–774 [DOI] [PMC free article] [PubMed] [Google Scholar]
- 16.Agency for Healthcare Research and Quality. Chapter 3: Creation of New Race-Ethnicity Codes and SES Indicators for Medicare Beneficiaries. Available at https://archive.ahrq.gov/research/findings/final-reports/medicareindicators/medicareindicators3.html. Accessed September 20, 2018.
- 17.Waterman AD, Robbins ML, Paiva AL, et al. Your path to transplant: a randomized controlled trial of a tailored computer education intervention to increase living donor kidney transplant. BMC Nephrol. 2014;15:166. doi: 10.1186/1471-2369-15-166. [DOI] [PMC free article] [PubMed] [Google Scholar]
- 18.Waterman AD, McSorley AM, Peipert JD, et al. Explore transplant at home: a randomized control trial of an educational intervention to increase transplant knowledge for black and white socioeconomically disadvantaged dialysis patients. BMC Nephrol. 2015;16:150. doi: 10.1186/s12882-015-0143-0. [DOI] [PMC free article] [PubMed] [Google Scholar]
- 19.Waterman AD, Rodrigue JR, Purnell TS, et al. Addressing racial and ethnic disparities in live donor kidney transplantation: priorities for research and intervention. Semin Nephrol 20103090–98 [DOI] [PMC free article] [PubMed] [Google Scholar]
- 20.University of Wisconsin School of Medicine and Public Health. Area Deprivation Index. Available at https://www.neighborhoodatlas.medicine.wisc.edu/. Accessed July 13, 2018.
- 21.SAS Institute Inc. Base SAS(R) 9.4 Procedures Guide: Statistical Procedures. 2nd ed. Cary, NC: SAS Institute, Inc; 2013. [Google Scholar]
- 22.R: A Language and Environment for Statistical Computing [computer program] Vienna, Austria: R Foundation for Statistical Computing; 2017. [Google Scholar]
- 23.Cohen J. Statistical Power Analysis for the Behavioral Sciences. New York, NY: Academic Press; 1988. [Google Scholar]
- 24.Slocum-Gori SL, Zumbo BD. Assessing the unidimensionality of psychological scales: using multiple criteria from factor analysis. Soc Indic Res 2011102443–461 [Google Scholar]
- 25.Waterman AD, Peipert JD, Goalby CJ, et al. Assessing transplant education practices in dialysis centers: comparing educator reported and medicare data. Clin J Am Soc Nephrol 2015101617–1625 [DOI] [PMC free article] [PubMed] [Google Scholar]
- 26.Oakes JM, Rossi PH. The measurement of SES in health research: current practice and steps toward a new approach. Soc Sci Med 200356769–784 [DOI] [PubMed] [Google Scholar]
- 27.Bronfenbrenner U. The Ecology of Human Development: Experiments by Nature and Design. Cambridge, MA: Harvard University Press; 1979. [Google Scholar]
- 28.Richard L, Gauvin L, Raine K. Ecological models revisited: their uses and evolution in health promotion over two decades. Annu Rev Public Health 201132307–326 [DOI] [PubMed] [Google Scholar]


