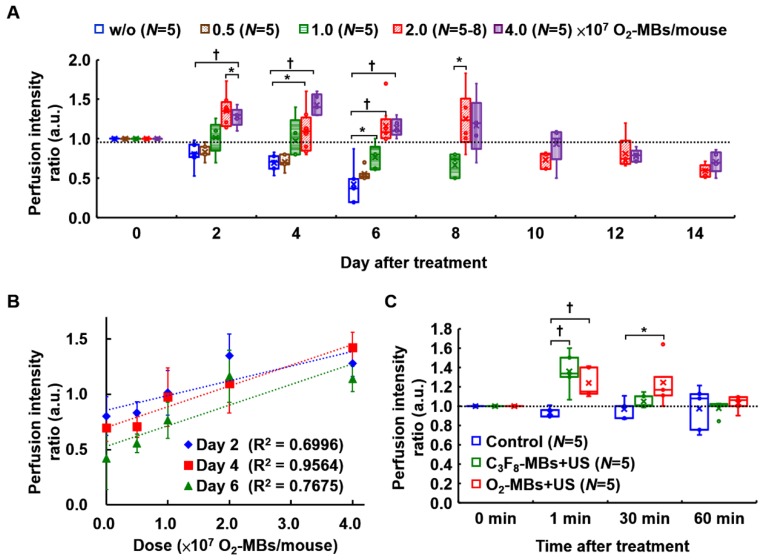
Figure 4.
(A) The threshold of tumor perfusion enhancement at various O2-MBs doses was evaluated to determine the VN inducible dose of O2-MBs. The legend of w/o means without O2-MBs injection. (B) Linear correlation between perfusion intensity ratio and O2-MBs dose. The correlation coefficients are 0.659, 0.795, and 0.719 at day 2, 4, and 6 after O2-MBs treatment, respectively. Data are presented as mean ± standard deviation. (C) The transient effect of perfusion enhancement by MBs cavitation. Data are presented as box-and-whiskers plots and analyzed by one-way ANOVA (* p<0.05; † p<0.01). Each dot represents a sample (N=5 to 8 mice per group).

