Abstract
Heart rate variability (HRV) is an objective measure of emotional regulation. This study aimed to estimate the accuracy with which an artificial neural network (ANN) algorithm could classify emotions using HRV data that were obtained using wristband heart rate monitors.
Four emotions were evoked during gameplay: pleasure, happiness, fear, and anger. Seven normalized HRV features (i.e., 3 time-domain features, 3 frequency-domain features, and heart rate), which yielded 29,727 segments during gameplay, were collected and analyzed first by statistics and then classified by the trained ANN model.
General linear model adjusted for individual differences in HRV showed that all HRV features significantly differed across emotions, despite disparities in their magnitudes and associations. When compared to neutral status (i.e., no emotion evoked), the mean of R-R interval was significantly higher for pleasure and fear but lower for happiness and anger. In addition, pleasure evidenced the HRV features that suggested a superior parasympathetic to sympathetic activation. Happiness was associated with a prominent sympathetic activation. These statistical findings suggest that HRV features significantly differ across emotions evoked by gameplay. When further utilizing ANN-based emotion classification, the accuracy rates for prediction were above 75.0% across the 4 emotions with accuracy rates for classification of paired emotions ranging from 82.0% to 93.4%.
For classifying emotion in an individual person, the trained ANN model utilizing HRV features yielded a high accuracy rate in our study. ANN is a time-efficient and accurate means to classify emotions using HRV data obtained from wristband heart rate monitors. Thus, this integrated platform can help monitor and quantify human emotions and physiological biometrics.
Keywords: artificial neural networks, emotion classification, heart rate variability, smartphone, wristband heart rate monitor
1. Introduction
Emotions consist of appetitive and defensive motivational systems, and affect cognition, attention, action, and physiological reaction, depending on the environments that individuals encounter and the goals that they pursue.[1] Emotions are considered to be regulated by several regions of the brain, particularly the prefrontal and cingulate cortex,[2] which are also the regions that control the somatic and autonomic physiological systems.[3,4,5] Emotional changes may also present as prodromal symptoms of various psychiatric disorders [6] and neurodegenerative diseases.[7] Neurotransmitters such as acetylcholine,[8] serotonin, noradrenaline, and dopamine, are involved in the behavioral control[9] of emotions. Modulation of these neurotransmitters has been used as a therapeutic strategy for various disorders.[10,11] Despite the evidence that autonomic function is an objective measure of emotional regulation,[12] there is an unmet need for an accessible device that can simultaneously detect and quickly analyze these biological processes.
Emotional status is often assessed using self-report questionnaires and professional personnel's interpretations, whereas autonomic responses to emotions are assessed using objective and unbiased data that are obtained through various physiological examinations.[6,13,14] Among these examinations, mounting evidence shows that emotional well-being can be predicted by heart rate variability (HRV), which is an indicator of autonomic nervous system activity.[15] HRV measurement has been found to be an accessible research tool to understand the role of emotions in psychopathological processes.[16] HRV may affect oscillatory activity and enhance functional connectivity strength in emotion regulation brain networks in a synchronized fashion.[12] People with high HRV have better emotional regulation than those with low HRV.[12] In contrast, low HRV is indicative of an index of difficulty in regulating emotions.
At present, there is an emerging research field that studies video game designs and their interactions with players; they use numerous qualitative and quantitative techniques to collect data about player behaviors to evaluate player experience.[17] These data are mainly gathered by means of players’ self-reports and observers’ interpretations of their cognitive and emotional processes. Among the various biofeedback parameters, HRV is one of the most useful biometrics that researchers can use to determine players’ emotional statuses.[17] In addition, video games were shown to be useful for motivating players to engage in HRV biofeedback training.[18]
Given the close relationship between emotion and the autonomic system, we conducted a study to examine the feasibility of a novel accessible technique that utilizes a wristband heart rate monitor to instantly and easily examine HRV in response to the emotions that are evoked by stimulations. In this study, 4 video games were used as stimulations to evoke participants’ emotions and simultaneously measure their HRV, which was categorized in accordance with an artificial neural network (ANN)-based classification.
2. Methods
This study utilized a wristband heart rate monitor to instantly and continuously collect large amounts of HRV data during the entire course of the emotional stimulation. Subsequently, the collected data were statistically analyzed in order to examine differences in HRV features across emotions. Finally, in order to classify emotions, we utilized an ANN algorithm to estimate the accuracy of emotion classification using the input data of all HRV features.
2.1. Participants
Twelve male participants between the ages of 20 and 22 (20.8 ± 0.8) years were enrolled in this study. The sample size was based on a prior study[18] and was evaluated further by power analyses; when the significance level was set at 0.05, a sample size of 12 has 80.0% power to detect an effect size of 1.2 between paired emotions. The total extraction time for signal analysis was at least 30 minutes for each emotion, and the window duration time was set as 5 seconds. A total of 29,727 segments of HRV data were extracted for analysis. This study was carried out in accordance with the protocol approved by the MacKay Memorial Hospital Institution Ethics Review Board (number 16MMHIS101e) with written informed consent from all subjects.
2.2. System architecture
Our system consisted of 3 components: a wristband heart rate monitor that served as the emotion perception interface, a smartphone that served as the emotion perception and data collection platform, and a backend computer that served as the emotion perception data analysis platform (Fig. 1).
Figure 1.
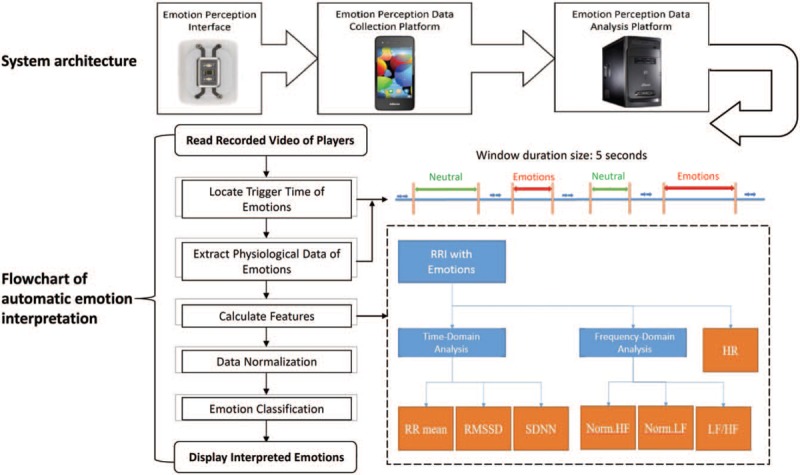
System architecture and flowchart of automatic emotion interpretation. The system architecture consists of three components. Heart rate (HR) data and R-R interval (RRI) during neutral and triggered-emotion statuses were extracted for signal analysis. The total extraction time was up to 30 minutes for each of the neutral and triggered-emotion statuses. Window duration time was set as 5 seconds and resampled to 4 Hz for the Fast Fourier Transform (FFT). Time-domain features, frequency-domain features, and HR were used for ANN-based classification. As per the suggested standards of measurement of HRV, the RR mean, Standard Deviation of Normal to Normal (SDNN), and Root Mean Square of Successive Differences (RMSSD) were used for time domains. With regard to power spectrum density, frequencies between 0.04 Hz and 0.15 Hz were defined as low frequency (LF) and those between 0.15 Hz and 0.4 Hz were defined as high frequency (HF). The features of the data were calculated and normalized for the classification algorithm (Norm.HF = normalized high frequency; Norm.LF = normalized low frequency).
2.2.1. Wristband heart rate monitor
In this study, a wristband heart rate monitor that is based on the photoplethysmogram (PPG) was used for continuous heart rate measurement. The measured data were collected and transmitted to the smartphone via Bluetooth 4.0. PPG instantly measures heart rate by estimating blood volume changes in blood vessels. Heart rate and HRV are measured based on rhythmical changes in reflected light via the transformation algorithm that is presented in Fig. 2.
Figure 2.
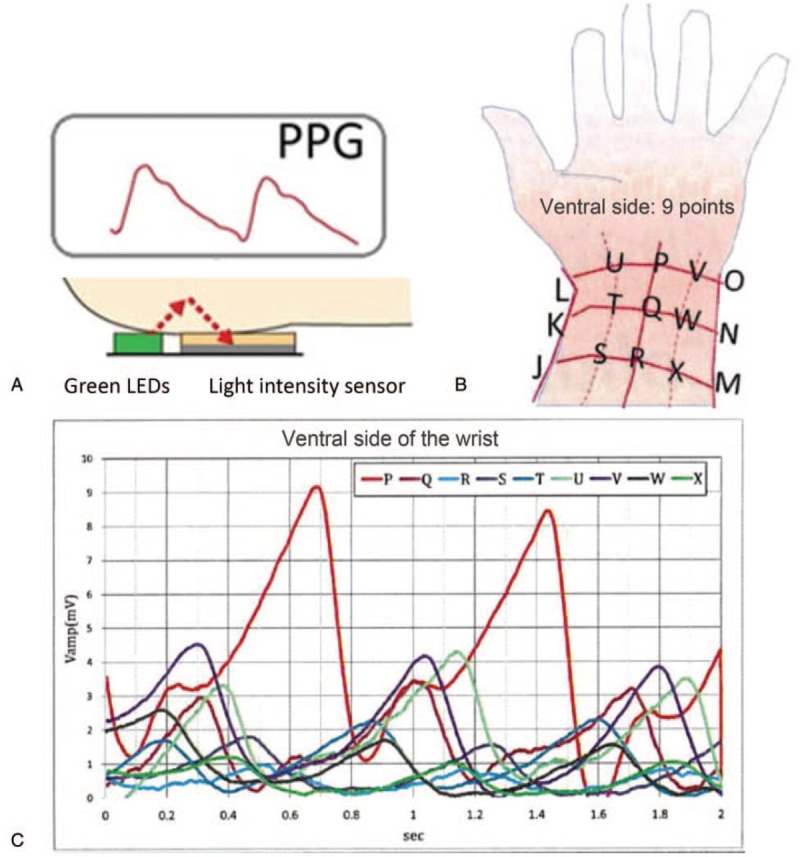
Illustration of the photoplethysmogram (PPG). In the wristband heart rate monitor, there are 2 green light emitting diodes (LEDs) and 1 light-intensity sensor (Panel A). The photodiode sensor detects the reflected green light that is emitted by the LEDs; it penetrates the skin to reach the dermis layer where abundant blood vessels exist. Because hemoglobin in the blood vessels absorbs the light emitted by the green LED, we are able to detect rhythmic changes in the reflected light intensity that is synchronized with the cardiac pumping rate. The changes in the reflected light intensity can be utilized to calculate heart rate and heart rate variability. The detected PPG wave was strongest at the middle line of the ventral wrist, which is denoted as “P” in Panels B and C.
2.2.2. Smartphone and backend computer
We utilized an Android smartphone to simultaneously record the player's facial expressions, audial responses, and physical appearance during gameplay and collect the player's heart rate data that were transmitted through the wristband heart rate monitor. The recorded video was used to identify the player's emotional status. The backend computer was utilized to analyze heart rate data. Both time-domain and frequency-domain analyses were conducted with the RR interval (RRI) of HRV data to extract features for corresponding emotions. Subsequently, the extracted features were fed into an ANN for classification training of automatic emotion classification.
2.3. Procedure and data analytic strategy
2.3.1. Experimental settings
Python programs were developed for corresponding emotion classifications. First, we reviewed the recorded videos of the players in order to examine the physical expressions that were evoked during gameplay (Fig. 1). The total extraction time for signal analysis was at least 30 minutes for neutral status and emotion triggered status. HRV and RRI data were extracted during both the neutral status and the period during which emotions were triggered. The window of the time duration was set as 5 seconds[19] and resampled to 4 Hz for the Fast Fourier Transform (FFT). In this manner, HRV data segments were created to extract features for further emotion analysis. Time-domain and frequency-domain analyses were conducted to extract corresponding features with heart rate as inputs for ANN-based emotion classification (Fig. 1).
2.3.2. Emotion stimulation
The selection of 4 categories of emotions was based on the valence-arousal theory, which consists of 2 dimensions, namely, valence (i.e., the polarity of negativity or positivity of emotions) and arousal (i.e., the intensity of emotions; Table 1).[20] According to the circumplex model of affect developed by Russell,[20] happiness and pleasure were positive-valence emotions, whereas anger and fear were negative-valence emotions. Happiness entails greater arousal intensity than pleasure; similarly, anger elicits stronger arousal than fear.[20] Based on user comments across various famous game-user platforms (http://store.steampowered.com), 4 frequently played games, namely, Portal, Left 4 Dead 2, Five Nights at Freddy's, and League of Legends, were selected to stimulate the corresponding emotions of players (Table 1).
Table 1.
The 4 games used to stimulate corresponding emotions in the players.

2.4. Calculation and normalization of features
Time-domain analysis of HRV data was used to calculate the mean and standard deviation of heart rate across a period of time. As per the suggested standards of measurement of HRV,[21] the mean heart R-R interval (RR mean), Standard Deviation of Normal to Normal (SDNN), and Root Mean Square of Successive Differences (RMSSD) were used (Fig. 1). In the following sections, we discuss how these features were calculated.
RR mean is the average of R-R intervals across a period of time. The calculation method is as shown in Eq. (1) and the respective unit of measurement is milliseconds (ms).
 |
In this equation, N represents the number of R-R interval data within a given period of time, and RR i represents the ith R-R interval.
SDNN is the standard deviation of R-R intervals across a period of time. The calculation method is shown in Eq. (2). First, the R-R interval of each period is subtracted from the mean R-R interval of the period; subsequently, the standard deviation is calculated. The respective unit of measurement is milliseconds.
 |
In Eq. (2), N represents the number of R-R interval data within a period of time, and RR i represents the ith R-R interval.
RMSSD is the root-mean-square value of R-R intervals across a period of time. The calculation method is shown in Eq. (3); in this equation, each adjacent R-R interval is subtracted for a given period of time; subsequently, the standard deviation is calculated in milliseconds.
 |
In this equation, N represents the number of R-R intervals within a given period of time, and RR i represents the ith R-R interval.
The frequency-domain analysis of HRV was used to calculate the energy intensity at different frequencies through power spectrum density (PSD). The PSD of HRV has been proven to be a useful tool in the evaluation of cardiovascular autonomic activity. The calculation method of PSD was divided into 2: parametric and non-parametric. The parametric method utilized the Autoregressive (AR) and Moving-average (MA) models. When the sample size is small, the accuracy of the PSD is high; however, the adaptability and complexity of the selection model has to be verified. In contrast, the non-parametric method utilizes the Fast Fourier Transform (FFT); thus, the operation and processing speed of the model is faster.
According to the standard protocol for examining the functioning of parasympathetic and sympathetic pathways, the PSD frequency of the recorded HRV is broken down into 2 frequency bands, based on their effects on heart-rate cyclic variability: low frequency (LF) and high frequency (HF).[21] The HF component can be used as an indicator of parasympathetic activity; in contrast, the LF component is believed to either be an indicator of sympathetic activity or affected by both the sympathetic and parasympathetic nervous system.[21] Therefore, a high LF/HF ratio suggests a low parasympathetic tone or high sympathetic tone, which in turn reflects a nervous, irritable, and hyperactive emotional state; conversely, a low LF/HF ratio is indicative of a depressed mood.
To reduce differences in daily physiological signals, the normalization method that is presented in Eq. (4) was performed; specifically, the calculated feature values were removed to decipher the maximum and minimum values for their normalization.
 |
In this equation, S i represents the ith feature value before normalization, S max and S min represent the maximal and minimal feature values, respectively, and Si, normalized represents the ith normalized feature value.
In total, 7 features were used in the analysis: 3 time-domain features (i.e., RR mean, RMSSD, and SDNN), 3 frequency-domain features in normalized units (HF, LF, LF/HF), and heart rate.
2.5. ANN classification
ANN is an algorithm that has self-learning capabilities. The multilayer ANN consists of 1 or more hidden layers as shown in Fig. 3. Python 2.7 and Scikit-Learn ANN were utilized to implement ANN classification. We adopted multilayer perceptrons in scikit-neuralnetwork (SKNN, http://scikit-neuralnetwork.readthedocs.io/en/latest/index.html) as our ANN-based classification mechanism. In addition, the number of hidden layers and the number of neurons within the hidden layer may be highly correlated with the accuracy of the training model in the multilayer ANN. Therefore, we adjusted and estimated the values of various ANN parameters to achieve the most accurate classification.
Figure 3.
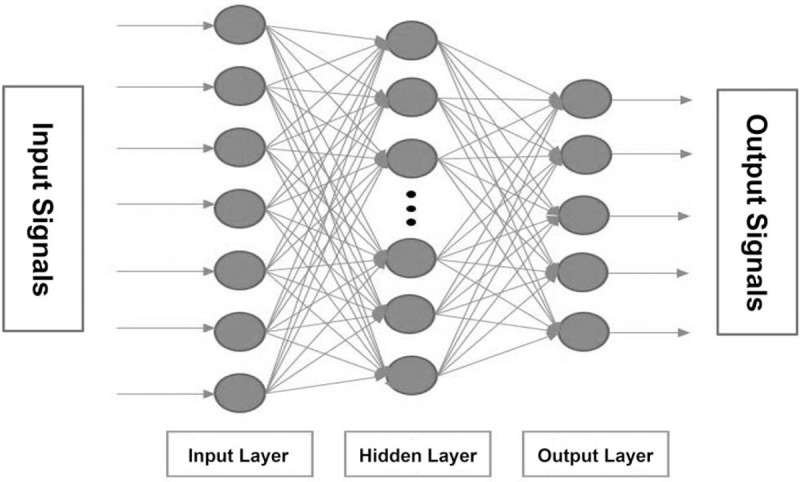
Illustration of the structure of a multi-layer artificial neural network (ANN). A multilayer ANN consists of 1 or more hidden layers. The network has the ability to correct the feedforward when the input signal enters the network. When the output signal was different from the expected output, the error value was calculated and fed forward to the input to adjust the weight. In the ANN-related parameter settings, the number of hidden layer neurons, the number of hidden layers, and the learning rates affected the accuracy of ANN-based classification.
2.6. Process of emotion recognition
The values of the emotion features were inputted into the ANN to train the model to generate an individual emotion-classification model. When feature values were inputted into the classification model, the emotion type was subsequently interpreted and outputted. The processing of the classification included 3 steps. First, during the training process, a portion of the data in each emotion was used as the training data. After the feature values were calculated and normalized, they were inputted into the ANN to train the classification model. Subsequently, during the sub-testing process, the remaining data were used as the testing data. In other words, the testing data did not overlap with the training data. After the feature values were calculated and normalized, they were inputted into the ANN to determine the classification. Finally, K-fold cross-validation was undertaken, whereby a 10-fold cross-validation was used to verify the correctness of the emotion classification.
2.7. Statistical analyses and power estimation
A general linear model (GLM) was used to examine the emotions that are associated with HRV features. Individual differences in HRV features were examined and adjusted as a confounding factor in the GLM models. The normality of distributions of continuous data was tested using the Shapiro–Wilk test. All statistical analyses were conducted using Version 9.4 of SAS software (SAS Institute). P values (P) of <.05 were considered to be statistically significant.
3. Results
3.1. Emotion classification with HRV features
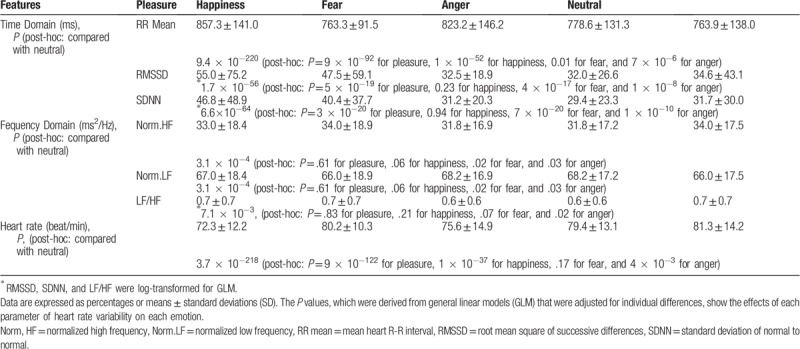
There were significant individual differences across all parameters (P < 1 × 10−90); therefore, they were adjusted as a confounding factor in all the GLM models. Differences in HRV, as a function of emotional changes during gameplay, are shown in Table 2. HRV traits were log-transformed (RMSSD, SDNN, and LF/HF) to reduce non-normality. All HRV parameters, including the parameters of time-domains, frequency domains, and heart rate, significantly differed between emotions, despite disparities in their magnitudes and associations with certain emotions. For example, when compared to the neutral status, GLM adjusting for individual differences showed that the effects of the RR mean was significantly higher for pleasure (beta = 55.4, 95% confidence interval, CI = 50.2–60.1) and fear (beta = 7.8, 95% CI = 1.7–14.0) but lower for happiness (beta = −42.2, 95% CI = −47.5–−36.8) and anger (beta = −13.6, 95% CI = −19.5–−7.6); (Table 2). When compared to neutral status, pleasure evidenced a higher RR mean, RMSSD (beta = 0.2, 95% CI = 0.1–0.2), and SDNN (beta = 0.2, 95% CI = 0.1–0.2) and a lower heart rate (beta = −5.6, 95% CI = −6.1–−5.2), thereby suggesting that parasympathetic activation is superior to sympathetic activation in pleasure. Happiness was associated with a lower RR mean and a higher heart rate (beta = 3.2, 95% CI = 2.7–3.7) than neutral status; these trends suggest that sympathetic activation is dominant over parasympathetic activation in happiness. However, fear had a higher RR mean (beta = 7.8, 95% CI = 1.7 to 14) and HF (beta = 1.5, 95% CI = 0.2–2.7), and lower RMSSD (beta = −0.15, 95% CI = −0.19 to −0.12), SDNN (beta = −0.17, 95% CI = −0.2 to −0.13), and LF (beta = −1.5, 95% CI = −2.7 to −0.2); these trends yield inconclusive results about the interpretation of autonomic function. Similarly, HRV data were inconclusive because anger tended to have a lower RR mean, RMSSD (beta = −0.10, 95% CI = −0.14 to −0.07), and SDNN (beta = −0.12, 95% CI = −0.17 to −0.09) and a higher heart rate (beta =0.8, 95% CI = 0.3–1.3), which suggested sympathetic activation; at the same time, anger had a higher HF (beta =1.5, 95% CI = 0.1–2.8) and a lower LF (beta = −1.5, 95% CI = −2.8 to −0.1), which suggested parasympathetic activation.
Table 2.
Differences in heart rate variability as a function of emotional changes during gameplay.
The characteristics of the PSD intensity of emotions are illustrated in Fig. 4. Specifically, anger evidenced a high LF and a low HF, fear evidenced a low LF and a low HF, happiness evidenced a low LF and a high HF, and pleasure evidenced a high LF and a high HF; these findings suggest that there are differences in autonomic regulation between emotions. Although both pleasure and anger showed signal strength in LF and HF parts, the intensity of the HF of pleasure was higher than that of anger, which can be used for separation of pleasure and anger.
Figure 4.
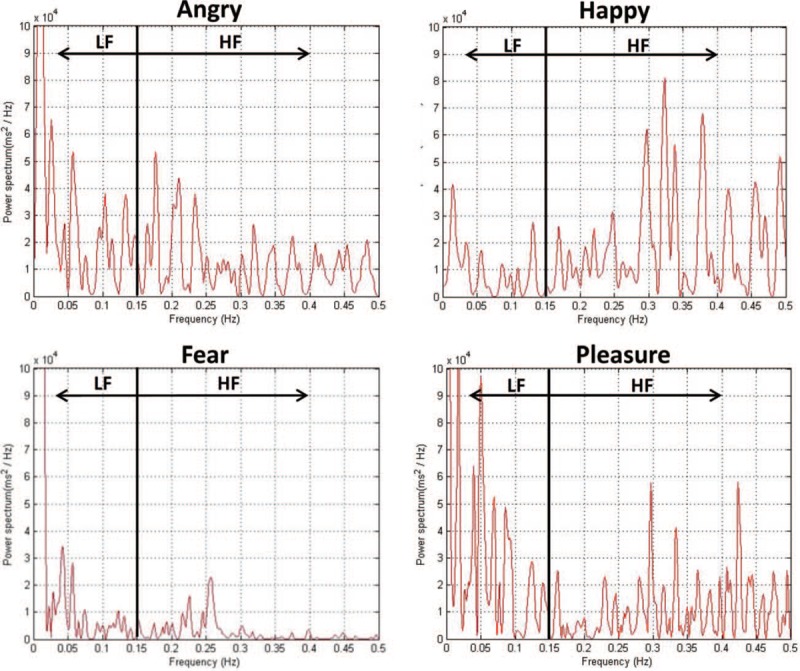
Frequency-domain analysis of differences in heart rate variability between the emotions of pleasure, happiness, fear, and anger. In power spectrum density (PSD), frequencies between 0.04 Hz and 0.15 Hz are defined as low frequency (LF) and those between 0.15 Hz and 0.4 Hz are defined as high frequency (HF). Utilizing the differences in the distribution of PSD with frequency changes, we found that the characteristic of the PSD was low for both the HF and LF of fear; high HF and low LF were observed for happiness. Although both pleasure and anger have signal strength in LF and HF parts, the intensity of the HF of pleasure was relatively higher than that of anger; this difference can be used for emotion classification.
3.2. Parameter settings for hidden layers of multilayer ANN
In multilayer ANN, the optimal number of hidden layers and the number of neurons in the hidden layer were estimated in order to achieve the best recognition accuracy in emotion classification. In the single hidden layer, recognition accuracy was increased by expanding the number of neurons (Fig. 5). When an additional hidden layer was included, the overall accuracy was lowered. In addition, with 2 hidden layers, there was a ceiling for the recognition accuracy rate when the number of neurons was increased from 200 to 300. Thus, we set our ANN as a single layer with the number of neurons set to 300 to achieve the best accuracy.
Figure 5.
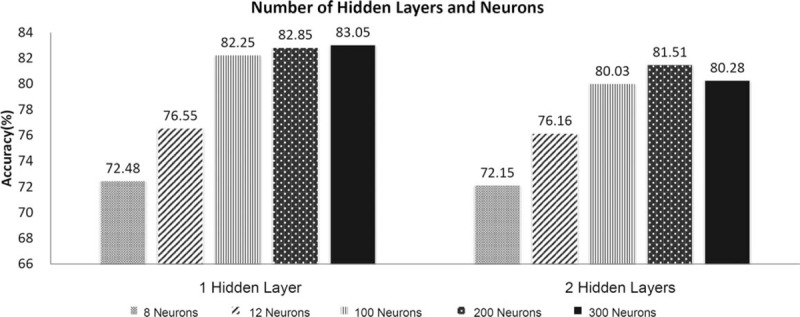
The number of hidden layers and neurons in the proposed artificial neural network. In multilayer ANN, the optimal number of hidden layers and the number of neurons in the hidden layer were estimated in order to achieve the best recognition accuracy in emotion classification. When an additional hidden layer was added, the overall accuracy was lowered. With a single hidden layer, the recognition accuracy was augmented by increasing the number of neurons. However, in the model with 2 hidden layers, there was a ceiling for the recognition accuracy rate when the number of neurons was raised from 200 to 300.
3.3. Emotion recognition by ANN
The normalized values of the 7 HRV features were inputted into Python programs for ANN-based classification model training, with the condition of a single hidden layer with 200 to 300 neurons. The average accuracy is shown in Table 3. Data about the players’ emotions were cross-validated to estimate the rate of accuracy. The accuracy rates for pleasure, happiness, fear, anger, and neutral status were 84.4%, 79.1%, 86.8%, 88.6%, and 75.3%, respectively. Overall, the accuracy rate of the ANN in emotion classification was higher than 75%.
Table 3.
Accuracy of artificial neural networks-based emotion classification.

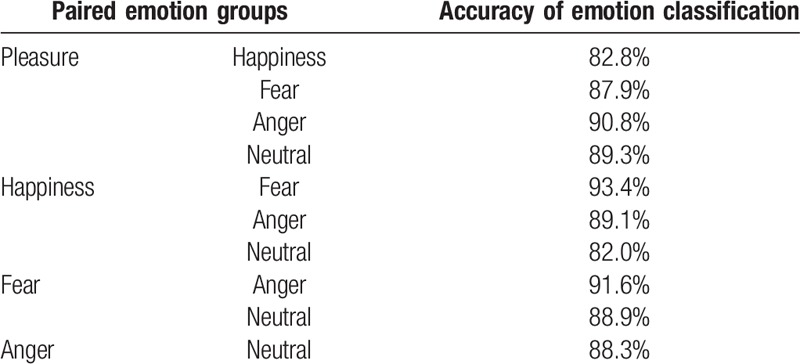
We tested the accuracy rate of the ANN in distinguishing between emotions with different valences and arousals; we found that the ANN had the greatest classification ability to separate 2 emotions, when they were significantly different in both valence and arousal (happiness vs fear: accuracy rate = 93.4%; pleasure vs anger: accuracy rate = 90.8%; Table 4). With regard to emotions with similar valence, we found that the accuracy of classification of fear and anger (91.6%) was higher than that of pleasure and happiness (82.8%).
Table 4.
Accuracy of classification of paired emotions.
3.4. Individual differences in HRV features in response to emotions
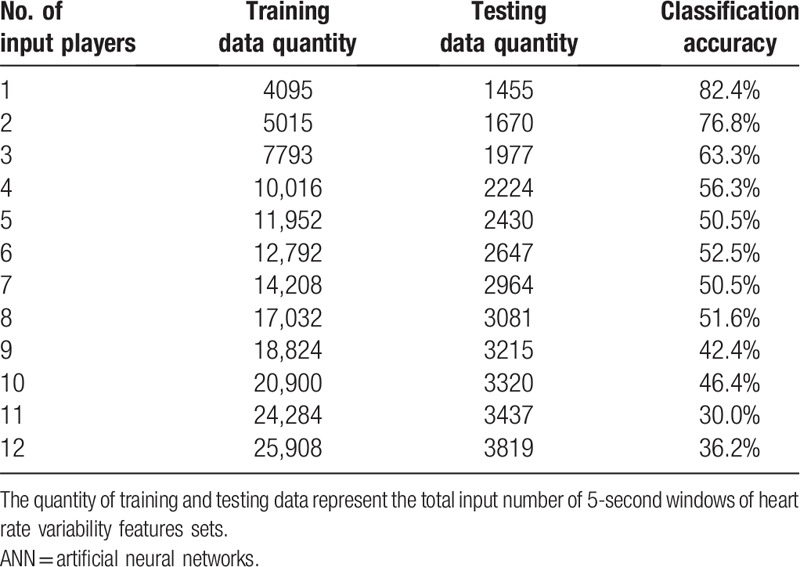
To verify whether there were individual differences in HRV features in response to emotions in the ANN algorithm, the accuracy of emotion classification was estimated by adding 1 player's data to the model in each iteration (Table 5). When additional player's data were inputted into the model, the accuracy decreased; this suggested that there were heterogeneities in the HRV features in responses to emotions between individuals. Therefore, a personalized model is recommended for the classification of emotions.
Table 5.
Accuracy of ANN-based classification in each iteration of cumulitative player data.
4. Discussion
This study utilized a wristband heart rate monitor to instantly and continuously collect large amounts of HRV data during emotional stimulation. The findings of this study showed that all the HRV features, including the parameters of time domains, frequency domains, and heart rate, significantly differed across emotions, despite significant individual differences in all features. There were significant disparities in the associations between individual HRV features and emotions. The ANN model using HRV features was capable of accurately and effectively classifying emotions. The accuracy of classification was especially high when emotions with opposing valence and arousal were compared. The findings of the present study suggest that the ANN may be a time-efficient means to accurately classify emotions. This integrated platform may help monitor and quantify human emotions and physiological biometrics.
Classification from labeled data is one of the most important applications for machine learning. Several important algorithms, such as ANN, support vector machines, and random forests, have been proposed as classification tools. In contrast to support vector machines that are more suitable for a supervised method for homogenous dataset and random forests that are designed for large amount of data classification, ANN was the best algorithm for classifying the heterogeneous HRV dataset with 29,727 segments of dataset.[22,23] We have thus decided to utilize ANN as our classification algorithm for emotion prediction.
HRV was regarded as a reflection of balance between excitatory sympathetic and inhibitory parasympathetic components. In statistical terms, the findings suggested that parameters of time domains, frequency domains, and heart rate, significantly differed across emotions, which underscore the effects that are related to autonomic regulation.[24] Emotional status is often assessed using self-report questionnaires and professional personnel's interpretations, whereas autonomic responses to emotions are assessed using objective data that are obtained through physiological examinations.[6,13,14] HRV, an indicator of autonomic nervous system activity, has been found to be an accessible research marker to understand the role of emotions in psychopathological processes.[15,16] High HRV has been linked to elevated parasympathetic activity and well emotional regulation.[12] Elevated parasympathetic activity has been associated with body regeneration, which is prominent during sleeping and resting;[21] conversely, low parasympathetic activity is linked to the risk of prominent physiological stress and decreased electric heart stability. Interestingly, fear was associated with remarkably low autonomic activity on PSD in this study. In rodent models, fearful events have been found to rapidly reduce HRV with or without a simultaneous increase in heart rate.[25,26] This fearful response was inhibited by a beta-adrenergic antagonist, indicative of strong sympathetic activation.[27]
This study has several limitations. First, because the sample size was small and the participants were young, the results may not be generalizable to senior or aging populations. Further study with a larger cohort is needed to draw final conclusions in this regard. Second, we did not consider the effect of motion on the wristband device during gameplay, which may influence the PPG sensitivity. Because hand swinging may have an influence on the PPG signal, the individual should try to maintain stationary during gameplay to improve the accuracy of the HRV. When our participants played the games, they were requested to place both of his/her hands on the keyboard to avoid hand swinging and subsequent non-stationary PPG data. Third, although autonomic modulation of HRV can be influenced by respiration, HRV measurements may be less affected by breathing rate because we measured HRV on the wrist. Fourth, we did not obtain direct biomarkers of autonomic regulation or continuous electrocardiography for comparisons; these may have provided direct evidence regarding the accuracy of the PPG performance. Therefore, future studies that employ a larger number of participants and traditional electrocardiography recordings are needed to examine the validity of the present study findings.
5. Conclusions
Wristband heart rate monitors and smartphones are efficient means to gather large amounts of instant and continuous HRV data during periods of emotional stimulation. The findings of the present study suggest that the ANN may instead be a time-efficient means to classify emotions with accuracy rates that range from 75.3% to 88.6%. This integrated platform may help monitor and quantify human emotions and physiological biometrics. Further, personalized models are recommended for the classification of emotions because they account for individual differences in HRV features.
Acknowledgments
The authors would like to thank Professor Shyh-Kang Jeng, Department of Electrical Engineering of National Taiwan University (NTU/EE), for his valuable comments on an earlier draft of the manuscript.
Author contributions
Conceptualization: Chun-Chieh Hsiao, Ren-Guey Lee.
Data curation: Chun-Chieh Hsiao, Wen-Dian Zheng.
Formal analysis: Yi-Chun Chen.
Funding acquisition: Ren-Guey Lee.
Investigation: Robert Lin.
Methodology: Yi-Chun Chen, Chun-Chieh Hsiao, Wen-Dian Zheng, Robert Lin.
Project administration: Chun-Chieh Hsiao.
Supervision: Chun-Chieh Hsiao.
Validation: Chun-Chieh Hsiao.
Writing – original draft: Yi-Chun Chen.
Writing – review & editing: Yi-Chun Chen, Chun-Chieh Hsiao, Ren-Guey Lee.
Footnotes
Abbreviations: ANN = artificial neural network, AR = autoregressive, CI = confidence interval, FFT = Fast Fourier Transform, GLM = general linear model, HF = high frequency, HRV = heart rate variability, LF = low frequency, MA = moving-average, Norm.HF = normalized high frequency, Norm.LF = normalized low frequency, PPG = photoplethysmogram, PSD = power spectrum density, RMSSD = Root Mean Square of Successive Differences, RRI = RR interval, SDNN = Standard Deviation of Normal to Normal, SKNN = scikit-neuralnetwork.
Part of this study was funded by Ministry of Science and Technology (MOST, R.O.C., 107-2218-E--027-004 and 108-2410-H-262-003) and National Taipei University of Technology (NTUT-USTB-106-04).
The authors have no conflicts of interests to disclose.
References
- [1]. Bradley MM, Codispoti M, Cuthbert BN, et al. Emotion and motivation I: defensive and appetitive reactions in picture processing. Emotion 2001;1:276–98. [PubMed] [Google Scholar]
- [2]. Arnsten AF. Stress signalling pathways that impair prefrontal cortex structure and function. Nat Rev Neurosci 2009;10:410–22. [DOI] [PMC free article] [PubMed] [Google Scholar]
- [3]. Jennings JR, Sheu LK, Kuan DC, et al. Resting state connectivity of the medial prefrontal cortex covaries with individual differences in high-frequency heart rate variability. Psychophysiology 2016;53:444–54. [DOI] [PMC free article] [PubMed] [Google Scholar]
- [4]. Sakaki M, Yoo HJ, Nga L, et al. Heart rate variability is associated with amygdala functional connectivity with MPFC across younger and older adults. Neuroimage 2016;139:44–52. [DOI] [PMC free article] [PubMed] [Google Scholar]
- [5]. Ulrich-Lai YM, Herman JP. Neural regulation of endocrine and autonomic stress responses. Nat Rev Neurosci 2009;10:397–409. [DOI] [PMC free article] [PubMed] [Google Scholar]
- [6]. Aldao A, Nolen-Hoeksema S, Schweizer S. Emotion-regulation strategies across psychopathology: a meta-analytic review. Clin Psychol Rev 2010;30:217–37. [DOI] [PubMed] [Google Scholar]
- [7]. Ismail Z, Gatchel J, Bateman DR, et al. Affective and emotional dysregulation as pre-dementia risk markers: Exploring the mild behavioral impairment symptoms of depression, anxiety, irritability, and euphoria. Int Psychogeriatr 2018;30:185–96. [DOI] [PubMed] [Google Scholar]
- [8]. Picciotto MR, Higley MJ, Mineur YS. Acetylcholine as a neuromodulator: cholinergic signaling shapes nervous system function and behavior. Neuron 2012;76:116–29. [DOI] [PMC free article] [PubMed] [Google Scholar]
- [9]. Lovheim H. A new three-dimensional model for emotions and monoamine neurotransmitters. Med Hypotheses 2012;78:341–8. [DOI] [PubMed] [Google Scholar]
- [10]. Cai Z. Monoamine oxidase inhibitors: promising therapeutic agents for Alzheimer's disease (Review). Mol Med Rep 2014;9:1533–41. [DOI] [PubMed] [Google Scholar]
- [11]. Lanctot KL, Herrmann N, Mazzotta P. Role of serotonin in the behavioral and psychological symptoms of dementia. J Neuropsychiatry Clin Neurosci 2001;13:5–21. [DOI] [PubMed] [Google Scholar]
- [12]. Mather M, Thayer J. How heart rate variability affects emotion regulation brain networks. Curr Opin Behav Sci 2018;19:98–104. [DOI] [PMC free article] [PubMed] [Google Scholar]
- [13]. Petrantonakis PC, Hadjileontiadis LJ. A novel emotion elicitation index using frontal brain asymmetry for enhanced EEG-based emotion recognition. IEEE Trans InfTechnol Biomed 2011;15:737–46. [DOI] [PubMed] [Google Scholar]
- [14]. Ochsner KN, Silvers JA, Buhle JT. Functional imaging studies of emotion regulation: a synthetic review and evolving model of the cognitive control of emotion. Ann N Y Acad Sci 2012;1251:E1–24. [DOI] [PMC free article] [PubMed] [Google Scholar]
- [15]. Berntson GG, Bigger JT, Jr, Eckberg DL, et al. Heart rate variability: origins, methods, and interpretive caveats. Psychophysiology 1997;34:623–48. [DOI] [PubMed] [Google Scholar]
- [16]. Appelhans BM, Luecken LJ. Heart rate variability as an index of regulated emotional responding. Rev Gen Psychol 2006;10:229–40. [Google Scholar]
- [17]. Drachen A, Mirza-Babaei P, Nacke LE. Games User Research. Oxford: Oxford University Press; 2018. [Google Scholar]
- [18]. Wollmann T, Abtahi F, Eghdam A, et al. User-centred design and usability evaluation of a heart rate variability biofeedback game. IEEE Access 2016;4:5531–9. [Google Scholar]
- [19]. Kim D, Cho Y, Park KS. Comparative analysis of affective and physiological responses to emotional movies. Hum Cent Comput Inf Sci 2018;8:15. [Google Scholar]
- [20]. Russell JA. A circumplex model of affect. J Pers Soc Psychol 1980;39:1161–78. [Google Scholar]
- [21]. Camm AJ, Malik M, Bigger JT, et al. Heart rate variability: Standards of measurement, physiological interpretation, and clinical use. Task Force of the European Society of Cardiology and the North American Society of Pacing and Electrophysiology. Circulation 1996;93:1043–65. [PubMed] [Google Scholar]
- [22]. Cömert Z, Kocamaz AF. Comparison of machine learning techniques for fetal heart rate classification. Acta Physica Polonica 2017;132:451–4. [Google Scholar]
- [23]. Raczko E, Zagajewski B. Comparison of support vector machine, random forest and neural network classifiers for tree species classification on airborne hyperspectral APEX images. Eur J Remote Sens 2017;50:144–54. [Google Scholar]
- [24]. Shaffer F, Ginsberg JP. An overview of heart rate variability metrics and norms. Front Public Health 2017;5:258. [DOI] [PMC free article] [PubMed] [Google Scholar]
- [25]. Liu J, Wei W, Kuang H, et al. Heart rate and heart rate variability assessment identifies individual differences in fear response magnitudes to earthquake, free fall, and air puff in mice. PLoS One 2014;9:e93270. [DOI] [PMC free article] [PubMed] [Google Scholar]
- [26]. Liu J, Wei W, Kuang H, et al. Changes in heart rate variability are associated with expression of short-term and long-term contextual and cued fear memories. PLoS One 2013;8:e63590. [DOI] [PMC free article] [PubMed] [Google Scholar]
- [27]. Gaburro S, Stiedl O, Giusti P, et al. A mouse model of high trait anxiety shows reduced heart rate variability that can be reversed by anxiolytic drug treatment. Intl J Neuropsychopharmacol 2011;14:1341–55. [DOI] [PMC free article] [PubMed] [Google Scholar]


