Abstract
Background:
Sepsis is a serious clinical condition with a poor prognosis, despite improvements in diagnosis and treatment.Therefore, novel biomarkers are necessary that can help with estimating prognosis and improving clinical outcomes of patients with sepsis.
Methods:
The gene expression profiles GSE54514 and GSE63042 were downloaded from the GEO database. DEGs were screened by t test after logarithmization of raw data; then, the common DEGs between the 2 gene expression profiles were identified by up-regulation and down-regulation intersection. The DEGs were analyzed using bioinformatics, and a protein-protein interaction (PPI) survival network was constructed using STRING. Survival curves were constructed to explore the relationship between core genes and the prognosis of sepsis patients based on GSE54514 data.
Results:
A total of 688 common DEGs were identified between survivors and non-survivors of sepsis, and 96 genes were involved in survival networks. The crucial genes Signal transducer and activator of transcription 5A (STAT5A), CCAAT/enhancer-binding protein beta (CEBPB), Myc proto-oncogene protein (MYC), and REL-associated protein (RELA) were identified and showed increased expression in sepsis survivors. These crucial genes had a positive correlation with patients’ survival time according to the survival analysis.
Conclusions:
Our findings indicate that the genes STAT5A, CEBPB, MYC, and RELA may be important in predicting the prognosis of sepsis patients.
Keywords: bioinformatics, gene, prognosis, sepsis
1. Introduction
Sepsis is a heterogeneous and complicated pathophysiological syndrome that causes multiple organ dysfunction and high mortality. Sepsis and septic shock are major complications in critical care medicine. Worldwide, there are more than 19 million patients affected by sepsis each year, with a mortality of approximately 30%.[1] These poor outcomes may be due to a lack of understanding of the molecular mechanisms of sepsis. Fortunately, high-throughput sequencing can be used to determine disease mechanisms.
Previous studies have mainly focused on the pathogenesis of sepsis.[2,3] However, as clinicians, we expect to know the potential risk factors that are associated with the prognosis of patients with sepsis. To our knowledge, few studies have focused on the factors correlated with improved prognosis in sepsis. The present study aimed to conduct a comprehensive analysis based on 2 previous studies[4,5] and to explore crucial genes related to prognosis in sepsis, which may be useful in providing clues for future studies.
2. Methods
2.1. Microarray chip data
Two microarray datasets for sepsis were downloaded from the public Gene Expression Omnibus (GEO) database (https://www.ncbi.nlm.nih.gov/geo/): GSE54514[4] and GSE63042.[5] The definition of sepsis 2.0 was used as screening criteria for patients with sepsis in both studies. Dataset GSE54514 was generated on the Illumina HumanHT-12 V3.0 expression beadchip platform and submitted in 2014. Whole-blood samples were collected from patients with sepsis within 5 days of admission to an intensive care unit, for a total of 31 samples from 9 non-survivors and 96 samples from 26 survivors. Dataset GSE63042 was generated on the Illumina Genome Analyzer II (Homo sapiens) platform and submitted in 2015. Peripheral blood samples collected at admission to the emergency department were divided into a non-survivor group (n = 28) and survivor group (n = 78), according to the prognosis at 28-days. Both studies passed ethical review and informed written consent was acquired from all patients or their relatives.
2.2. Screening for DEGs
The 2 datasets were logarithmically normalized. The DEGs between survivors and non-survivors were selected by t-test, with a P value <.05 considered the cut-off criteria. Common DEGs derived from the intersection of DEGs between the 2 datasets were used for subsequent analyses.
2.3. Functional enrichment analysis of the DEGs
Gene ontology (GO) and pathway enrichment analysis for DEGs contribute to a better understanding of the mechanisms of disease. The common DEGs were submitted to the online analytical tool database for annotation, visualization and integrated discovery (DAVID) 6.8[6] (https://david-d.ncifcrf.gov/), with the gene symbol selected as the identifier and the species set to human. As a widely used gene batch annotation tool, DAVID conducts a classification of biological processes and enrichment of signaling pathways based on the KEGG database, with P < .05 as the significance cut-off. Next, the results were submitted for visualization at OmicShare, an online web tool (http://www.omicshare.com). Gene set enrichment analysis (GSEA)[7] tools were used to further investigate the activation of these pathways in the septic patients between the survivor group and non-survivor group.
2.4. Construction of the survival network
A protein-protein interaction (PPI) network is a large-scale analysis based on the previously reported direct interactions between 2 proteins that facilitates the screening of possible key genes. The common DEGs were analyzed using STRING[8] (https://string-db.org/), using the following network settings: “Homo sapiens” for species, “experiments” for interaction source, and “0.3” for the minimum required interaction score. In addition, proteins with fewer than 3 links were removed from the PPI network, taking into account the closeness of the network association, and the PPI network was defined as a “survival network”. Finally, in combination with the expression values of the crucial genes in both datasets, visualization of the survival network was performed using the viacomplex tool[9,10] to illustrate the quality of the survival network.
2.5. Survival analysis of the crucial genes
Dataset GSE54514 provided the survival time for each septic patient within 5 days after admission. The expression values of the crucial genes in the samples from the first day after admission were tabulated, and GraphPad Prism 7 software was used to carry out a survival analysis using the crucial genes, with P < .05 set as statistically significant.
2.6. Ethical review
The current research analyzed previously generated public data by bioinformatics analysis without direct contact with patients. There was no need for ethical review.
3. Results
3.1. Demographics of the septic patients
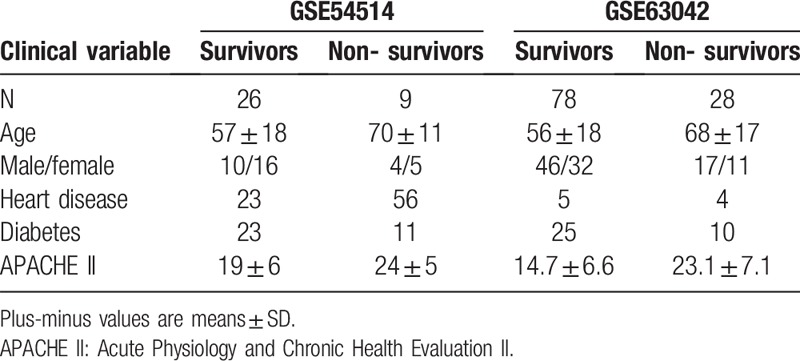
Thirty-five septic patients with microbiological pathology results were recruited into GSE54514, and 106 sepsis patients with clinical infection indicators were enrolled in GSE63042. Clinical characteristics were collected from all included patients, and demographic statistics are described in Table 1.
Table 1.
3.2. Identification of DEGs
After logarithmic homogenization, the DEGs from the 2 datasets were analyzed separately (Fig. 1A and B). A total of 4,404 DEGs were screened from the GSE54514 dataset, of which 1994 were up-regulated and 2410 were down-regulated in the survival group. Similarly, 3248 DEGs were screened in the GSE63042 dataset, of which 3182 were up-regulated and 66 were down-regulated in the survival group. After identifying the intersections of the up-regulated and down-regulated genes, 688 common DEGs were obtained, of which 681 were up-regulated and 7 were down-regulated in the survival group. The common DEGs were used for subsequent analyses.
Figure 1.
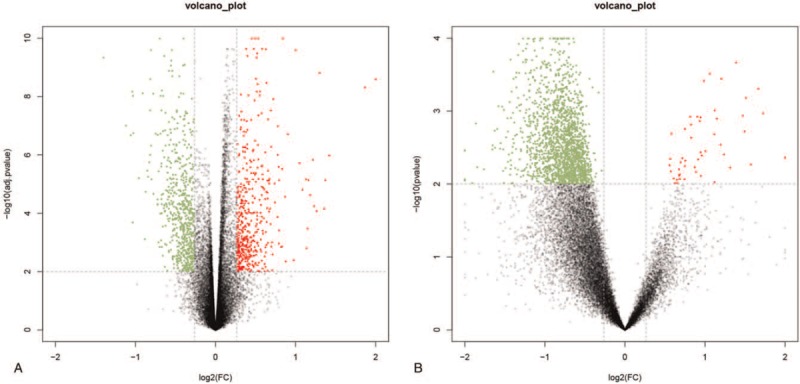
Volcano map of DEGs in GSE54514 (A) and GSE63042 (B). The abscissa represents the log2 (fold change) value of the gene and the ordinate represents the -log10 (adj. P value). The red dots represent the genes that are up-regulated in the death group, while the green dots represent the genes that are down-regulated in the death group.
3.3. Go and pathway enrichment
GO annotation analysis for the common DEGs showed that these genes were mainly distributed in the Biological processes of cell death, apoptosis, protein kinase regulation, vesicle-mediated transport, and signal transduction regulation (Fig. 2A). Furthermore, these DEGs were mainly enriched in the toll-like receptor signaling pathway, natural killer (NK) cell-mediated cytotoxicity, and the T- and B-cell receptor pathways (Fig. 2B). In addition, the results of GSEA analysis revealed that the aforementioned major pathways were up-regulated in the sepsis survival group (P < .05, FDR < .25, Fig. 3A–D). Interestingly, activation of the apoptotic process was revealed by GO analysis and pathway enrichment.
Figure 2.
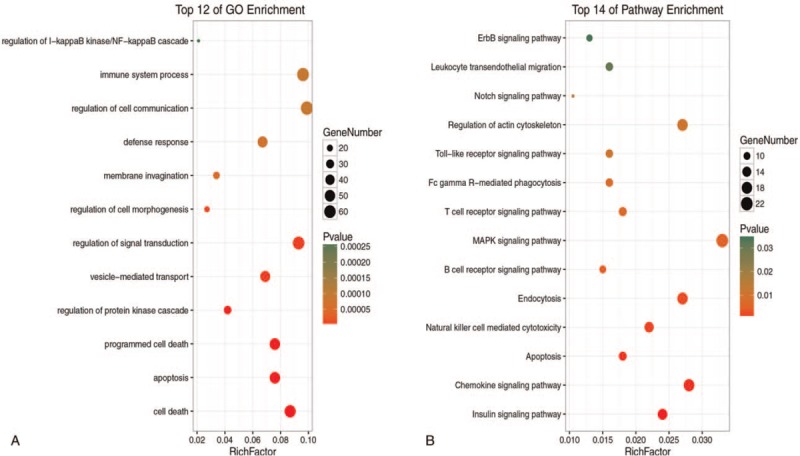
A: The BPs of DEGs in survivor and non-survivor. B: The signalling pathways of DEGs in survivor and non-survivor.
Figure 3.
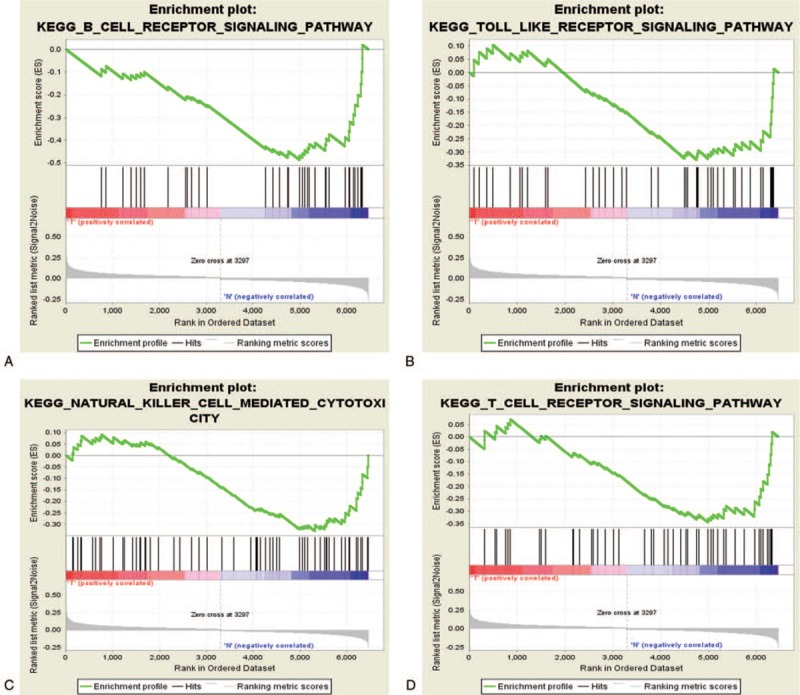
A–D: Enrichment of signaling pathways via GSEA.
3.4. PPI survival network
The common DEGs were analyzed by PPI network analysis and 96 closely related genes were screened to construct the survival network (Fig. 4A). The 96 DEGs in the survival network were all increased in the survival group, compared with those in the non-survivor group (shown in Table 2). Based on the survival network, in combination with their respective expression values, we constructed separate 2.5D topologies of the 2 datasets (Fig. 4B and C). There were 3 repeat peaks in the survival networks in both datasets, which suggests that the constructed survival network has high stability in different contexts. More importantly, the crucial genes Signal transducer and activator of transcription 5A (STAT5A), (CCAAT/enhancer-binding protein beta) CEBPB, Myc proto-oncogene protein (MYC), and REL-associated protein (RELA) were found to be located in the center of the network and are involved in a variety of biological functions, such as immune responses, apoptosis processes and transcriptional regulation.
Figure 4.
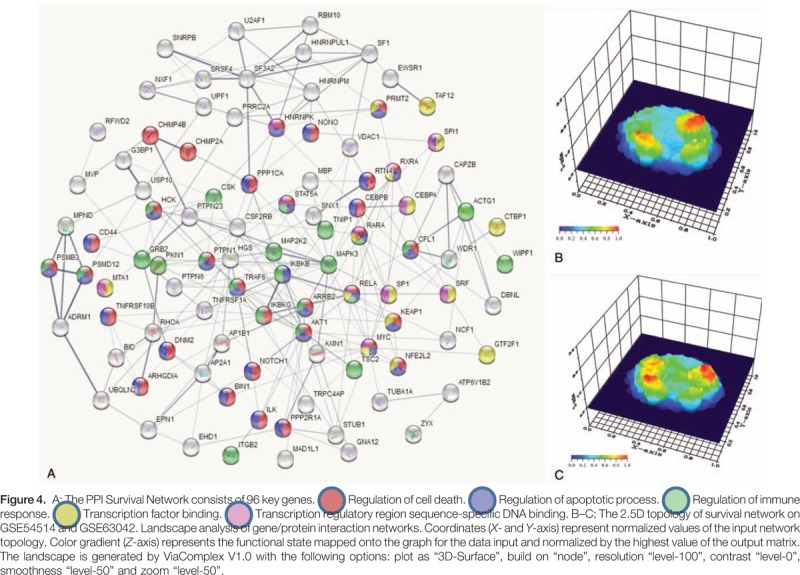
Table 2.
Crucial genes located in survival networks (96).

3.5. Survival curves from crucial genes
Combined with the patient's survival time in GSE54514, we found that the expression levels of the STAT5A, CEBPB, MYC, and RELA genes were significantly associated with prognosis in patients with sepsis (Fig. 5A–D). Compared to the low-expression group, the survival rates were significantly increased in patients with high expression levels of these crucial genes. This positive correlation between these crucial genes and improved prognosis suggests that they may contribute to the survival of patients with sepsis.
Figure 5.
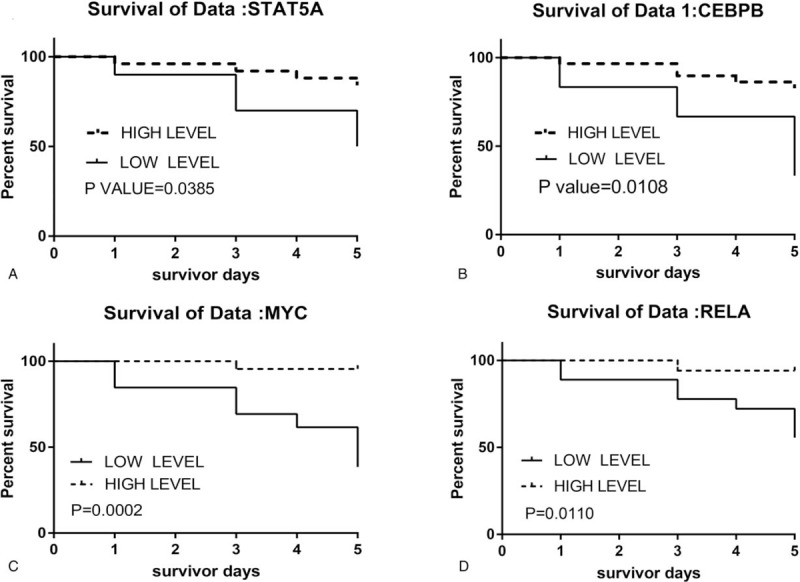
Survival curve of STAT5A (A), CEBPB (B), MYC (C), and RELA (D) in GSE54514. CEBPB = CCAAT/enhancer-binding protein beta, MYC = Myc proto-oncogene protein, STAT5A = Signal transducer and activator of transcription 5A, RELA = REL-associated protein.
4. Discussion
The past decade has seen great advances in critical care medicine, but there has been no substantial improvement in mortality in sepsis. The key factors that determine the prognosis for this disease are still not fully elucidated, but finding such “switch” factors may become very clinically significant.
The monocyte-macrophage system is an innate immune system of the human body and plays an important role in the development of sepsis.[11,12] Studies of sepsis data in non-surviving patients have shown a decrease in the activation of immune-related genes compared with the sepsis survival group.[13] In this study, apoptosis-related gene expression pathways were active in peripheral blood cells from patients with sepsis, while cytokine signaling pathways, NK cell-mediated cytotoxicity, and T- and B-cell receptor pathways were up-regulated in the survival group. Therefore, we speculate that the deaths of patients with sepsis are caused by apoptosis in the monocyte-macrophage system, leading to failure of the immune system and the consequent inability to clear pathogens.
Though microarray chip data can screen thousands of DEGs, such large datasets can still prevent researchers from having a clear direction. The field of bioinformatics has developed a variety of analytical methods, such as co-expression analyses, PPI, etc., for the purpose of dimensionality reductions of large datasets. STRING, a well-known PPI analysis tool based on previous studies, connects 2 proteins that have a direct effect with lines.[8] In the present study, the survival network consisted of 96 closely linked factors that were up-regulated. The similarity of the expression trends of these genes in 2 independent experiments shows that our network was stable and reproducible. Based on our bioinformatics analysis, STAT5A, CEBPB, MYC, and RELA were selected as the key genes for further study. The reasons were as follows:
-
(1)
they were located in the core of the PPI network;
-
(2)
they are involved in transcriptional regulation;
-
(3)
they are involved in apoptosis or immune regulation; and
-
(4)
they were positively correlated with patients’ survival time.
The STAT family is a class of important intracellular signaling molecules and transcription factors involved in a variety of cell signaling pathways.[14] Phosphorylated STATs enter the nucleus, initiate the transcription of target proteins, promote the expression of target proteins, and participate in the regulation of apoptosis.[15] In addition, STAT5A induces changes in the HIF1/2 signaling pathway, enhances glutamine utilization efficiency, and maintains the cell cycle, resulting in anti-apoptotic effects.[16]
CCAAT/enhancer binding protein β (CEBPB) is an important transcription factor that regulates immune- and inflammation-related gene expression. Studies have reported that the dynamic binding of CEBPB and CEBPA results in the regulation of downstream target genes that have biological functions for regulating the self-renewal of differentiated cells and cell regeneration.[17] CEBPB-deficient myeloid progenitor cells produce fewer monocytes and granulocyte-like colonies, indicating a reduced proliferation potential, and supporting the hypothesis that reducing CEBPB expression prevents the production of myeloid-derived suppressor cells and reduces immuno- suppression in septic mice.[18]
The MYC family and its products can promote cell proliferation, immortalization, dedifferentiation, and transformation. Studies have shown that MYC plays a role in inhibiting immune cell apoptosis in uncomplicated malaria.[19] In addition, studies have shown that MYC is involved in the transcriptional regulation of sepsis.[20]
RELA, also known as p65, is modified to effectively regulate NF-κB transcriptional activation. The mammalian NF-κB family of transcription factors is involved in the regulation of several processes, from the development and survival of lymphocytes and lymphoid organs to the control of immune responses and malignant transformation.[21] Studies have found that pro-inflammatory cytokines stimulated by lipopolysaccharide, including TNF-α and IL-6, can be effectively inhibited by disrupting the endogenous p65-mediated transcription complex.[22]
In conclusion, we focused on the prognosis of sepsis and identified 96 DEGs between the survivor and non-survivor groups using bioinformatics. PPI survival networks were constructed using the 96 extensive contacts among the 96 genes. Ultimately, the core genes STAT5A, CEBPB, MYC, and RELA were identified and found to be positively correlated with patients’ survival time, providing clues for our follow-up research. However, determining the exact functions of these genes requires additional experimental data.
Author contributions
Conceptualization: Qian Zhang.
Funding acquisition: Yingchun Hu.
Methodology: Wu Zhong.
Supervision: Muhu Chen.
Visualization: Yingchun Hu.
Writing – original draft: Yingchun Hu.
Writing – review & editing: Wu Zhong, Muhu Chen.
Footnotes
Abbreviations: CEBPB = CCAAT/enhancer-binding protein beta, CSF-1 = colony stimulating factor-1, DAVID = database for annotation, visualization and integrated discovery, DEGs = differentially expressed genes, GEO = gene expression omnibus, GO = gene ontology, GSEA = gene set enrichment analysis, HIF = hypoxia inducible factor, IL-6 = interleukin-6, KEGG = Kyoto Encyclopedia of Genes and Genomes, MDSC = marrow-derived suppressor cell, NF-κB = nuclear transcription factor-κB, NK cell = natural killer cell, PPI = protein-protein interaction, RELA = REL-associated protein, STAT5A = Signal transducer and activator of transcription 5A, TNF-α = tumor necrosis factor alpha.
This work was sponsored by the Luzhou-SWMU united project (2017LZXNYD-J27).
The authors report no conflicts of interest
References
- [1]. Prescott HC, Angus DC. Enhancing Recovery From Sepsis: A Review. JAMA 2018;319:62–75. [DOI] [PMC free article] [PubMed] [Google Scholar]
- [2]. Demaret J, Venet F, Friggeri A, et al. Marked alterations of neutrophil functions during sepsis-induced immunosuppression. J Leukoc Biol 2015;98:1081–90. [DOI] [PubMed] [Google Scholar]
- [3]. Severino P, Silva E, Baggio-Zappia GL, et al. Patterns of gene expression in peripheral blood mononuclear cells and outcomes from patients with sepsis secondary to community acquired pneumonia. Plos One 2014;9:e91886. [DOI] [PMC free article] [PubMed] [Google Scholar]
- [4]. Parnell GP, Tang BM, Nalos M, et al. Identifying key regulatory genes in the whole blood of septic patients to monitor underlying immune dysfunctions. Shock 2013;40:166–74. [DOI] [PubMed] [Google Scholar]
- [5]. Tsalik EL, Langley RJ, Dinwiddie DL, et al. An integrated transcriptome and expressed variant analysis of sepsis survival and death. Genome Med 2014;6:111. [DOI] [PMC free article] [PubMed] [Google Scholar]
- [6]. Huang DW, Sherman BT, Lempicki RA. Bioinformatics enrichment tools: paths toward the comprehensive functional analysis of large gene lists. Nucleic Acids Res 2009;37:1–3. [DOI] [PMC free article] [PubMed] [Google Scholar]
- [7]. Subramanian A, Tamayo P, Mootha VK, et al. Gene set enrichment analysis: a knowledge-based approach for interpreting genome-wide expression profiles. Proc Natl Acad Sci U S A 2005;102:15545–50. [DOI] [PMC free article] [PubMed] [Google Scholar]
- [8]. Szklarczyk D, Morris JH, Cook H, et al. The STRING database in 2017: quality-controlled protein-protein association networks, made broadly accessible. Nucleic Acids Res 2017;45 (D1):D362–8. [DOI] [PMC free article] [PubMed] [Google Scholar]
- [9]. Castro MA, Mombach JC, de Almeida RM, et al. Impaired expression of NER gene network in sporadic solid tumors. Nucleic Acids Res 2007;35:1859–67. [DOI] [PMC free article] [PubMed] [Google Scholar]
- [10]. Castro MA, Filho JL, Dalmolin RJ, et al. ViaComplex: software for landscape analysis of gene expression networks in genomic context. Bioinformatics 2009;25:1468–9. [DOI] [PubMed] [Google Scholar]
- [11]. Hotchkiss RS, Monneret G, Payen D. Sepsis-induced immunosuppression: from cellular dysfunctions to immunotherapy. Nat Rev Immunol 2013;13:862–74. [DOI] [PMC free article] [PubMed] [Google Scholar]
- [12]. Li P, Li M, He K, et al. The effects of Twist-2 on liver endotoxin tolerance induced by a low dose of lipopolysaccharide. Inflammation 2014;37:55–64. [DOI] [PubMed] [Google Scholar]
- [13]. Cheng SC, Scicluna BP, Arts RJ, et al. Broad defects in the energy metabolism of leukocytes underlie immunoparalysis in sepsis. Nat Immunol 2016;17:406–13. [DOI] [PubMed] [Google Scholar]
- [14]. Schwartz DM, Bonelli M, Gadina M, et al. Type I/II cytokines, JAKs, and new strategies for treating autoimmune diseases. Nat Rev Rheumatol 2016;12:25–36. [DOI] [PMC free article] [PubMed] [Google Scholar]
- [15]. Gilbert S, Nivarthi H, Mayhew CN, et al. Activated STAT5 confers resistance to intestinal injury by increasing intestinal stem cell proliferation and regeneration. Stem Cell Rep 2015;4:209–25. [DOI] [PMC free article] [PubMed] [Google Scholar]
- [16]. Fahrenkamp D, de Leur HS, Kuster A, et al. Src family kinases interfere with dimerization of STAT5A through a phosphotyrosine-SH2 domain interaction. Cell Commun Signal 2015;13:10. [DOI] [PMC free article] [PubMed] [Google Scholar]
- [17]. Jakobsen JS, Waage J, Rapin N, et al. Temporal mapping of CEBPA and CEBPB binding during liver regeneration reveals dynamic occupancy and specific regulatory codes for homeostatic and cell cycle gene batteries. Genome Res 2013;23:592–603. [DOI] [PMC free article] [PubMed] [Google Scholar]
- [18]. Dai J, Kumbhare A, Youssef D, et al. Expression of C/EBPbeta in myeloid progenitors during sepsis promotes immunosuppression. Mol Immunol 2017;91:165–72. [DOI] [PMC free article] [PubMed] [Google Scholar]
- [19]. Colborn JM, Ylostalo JH, Koita OA, et al. Human gene expression in uncomplicated plasmodium falciparum malaria. J Immunol Res 2015;2015:162639. [DOI] [PMC free article] [PubMed] [Google Scholar]
- [20]. Liu SY, Zhang L, Zhang Y, et al. Bioinformatic analysis of pivotal genes associated with septic shock. J Biol Regul Homeost Agents 2017;31:935–41. [PubMed] [Google Scholar]
- [21]. Vallabhapurapu S, Karin M. Regulation and function of NF-kappaB transcription factors in the immune system. Annu Rev Immunol 2009;27:693–733. [DOI] [PubMed] [Google Scholar]
- [22]. Park SD, Cheon SY, Park TY, et al. Intranuclear interactomic inhibition of NF-kappaB suppresses LPS-induced severe sepsis. Biochem Biophys Res Commun 2015;464:711–7. [DOI] [PubMed] [Google Scholar]


