Figure 7.
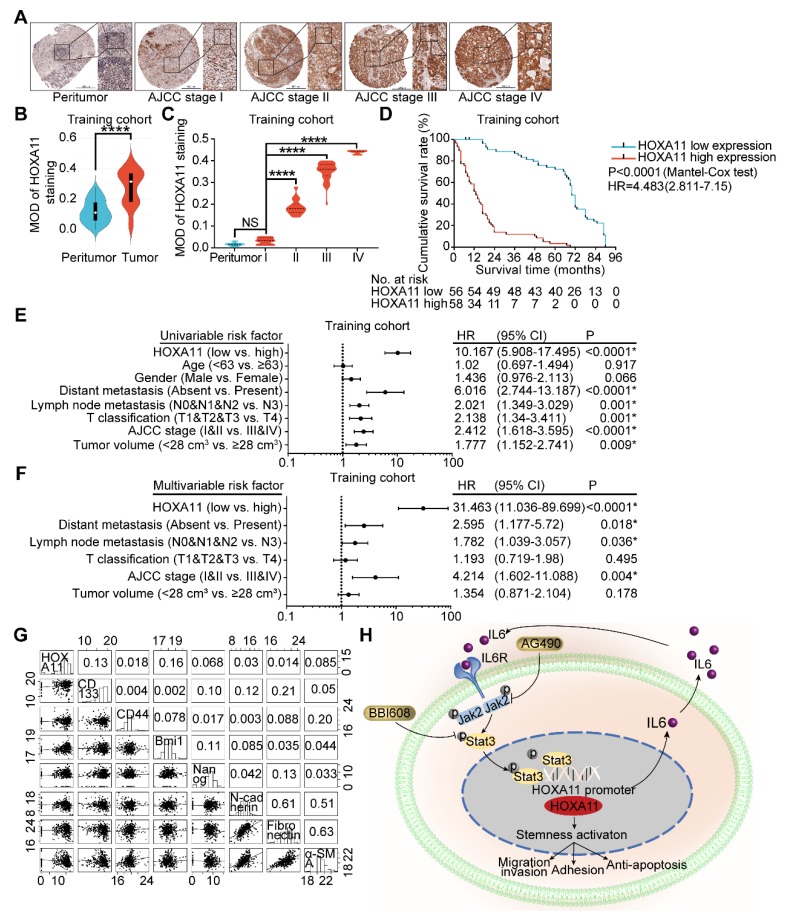
HOXA11 was frequently upregulated in gastric cancer tissues and its correlation with clinicopathological parameters. (A) Examination of HOXA11 expression in primary gastric cancer and peritumor tissues by IHC. The scale bar, 500 μm, 50× magnification; 100 μm, 200× magnification; 50 μm, 400× magnification; (B) Statistical analysis of the HOXA11 expression in the paired primary gastric cancer and peritumor tissues of training cohort by MOD of staining. ****, P<0.0001 (Student t test). (C) Statistical analysis of the HOXA11 expression in peritumor tissues of AJCC stage I and primary gastric cancer tissues of different AJCC stages of training cohort by MOD of staining. NS, no significance; ****, P<0.0001 (the analysis of variance test). (D) Survival of patients in HOXA11-low expression group and HOXA11-high expression group. The survival time of patients in the training cohort was compared between groups using the Mantel-Cox test, which presented significantly longer survival of patients in the HOXA11-low expression group (P<0.0001). (E) Univariate analysis was performed in training cohort. The bar corresponds to 95% confidence intervals. (F) Multivariate analysis was performed in training cohort. The bar corresponds to 95% confidence intervals. (G) Correlations among HOXA11, CD133, CD44, Bmi1, Nanog, N-cadherin, Fibronectin and α-SMA levels in human gastric cancer tissues (TCGA, n=375). (H) Schematic diagram of the relationship between HOXA11, stemness, migration and invasion, adhesion and anti-apoptosis.

